O R I G I N A L R E S E A R C H
Open Access
[
18
F]-BMS-747158-02PET imaging for
evaluating hepatic mitochondrial complex
1dysfunction in a mouse model of
non-alcoholic fatty liver disease
Takemi Rokugawa
1*, Sotaro Momosaki
1, Miwa Ito
1, Hitoshi Iimori
2, Yuki Kato
3and Kohji Abe
1,4Abstract
Background:Mitochondrial dysfunction is one of the main causes of non-alcohol fatty liver disease (NAFLD). [18 F]-BMS-747158-02 (18F-BMS) which was originally developed as a myocardial perfusion imaging agent was reported to bind mitochondrial complex-1 (MC-1). The aim of this study was to investigate the potential use of18F-BMS for evaluating hepatic MC-1 activity in mice fed a methionine- and choline-deficient (MCD) diet.
Male C57BL/6J mice were fed a MCD diet for up to 2 weeks. PET scans with18F-BMS were performed after 1 and 2 weeks of the MCD diet.18F-BMS was intravenously injected into mice, and the uptake (standardized uptake value (SUV)) in the liver was determined. The binding specificity for MC-1 was assessed by pre-administration of rotenone, a specific MC-1 inhibitor. Hepatic MC-1 activity was measured using liver homogenates generated after each positron emission tomography (PET) scan. Blood biochemistry and histopathology were also assessed.
Results:In control mice, hepatic18F-BMS uptake was significantly inhibited by the pre-injection of rotenone. The uptake of18F-BMS was significantly decreased after 2 weeks of the MCD diet. The SUV at 30–60 min was well correlated with hepatic MC-1 activity (r= 0.73,p< 0.05). Increases in plasma ALT and AST levels were also noted at 1 and 2 weeks. Mild hepatic steatosis with or without minimal inflammation was histopathologically observed at 1 and 2 weeks in mice liver on the MCD diet. However, inflammation was observed only at 2 weeks in mice on the MCD diet. Conclusions:The present study demonstrated that18F-BMS is a potential PET probe for quantitative imaging of hepatic MC-1 activity and its mitochondrial dysfunction induced by steatosis and inflammation, such as in NAFLD.
Keywords:[18F]-BMS747158-02, Non-alcoholic fatty liver disease, Non-alcoholic steatohepatitis, Mitochondrial complex-1, Methionine- and choline-deficient diet, Positron emission tomography
Background
Non-alcoholic fatty liver disease (NAFLD) is one of the most common forms of chronic liver disease in patients without a history of alcoholic abuse [1]. NAFLD encom-passes a wide spectrum of conditions ranging from sim-ple steatosis to non-alcoholic steatohepatitis (NASH), which progress to fibrosis in 30–40% of patients and to cirrhosis in 10–15% of patients [2]. Despite the poor prognosis, diagnosis of NAFLD including NASH is
difficult because liver biopsy, which is an invasive method, is the gold standard to identify steatohepatitis [3]. This has both made it difficult to diagnose NAFLD and to identify the mechanism of progression from sim-ple steatosis to NASH, exacerbated by its complicated pathogenesis. One of the key factors in the acceleration of progression from simple steatosis to NASH is the for-mation of reactive oxygen species (ROS) [4, 5]. ROS dir-ectly damage respiratory chain polypeptides and oxidize the unsaturated lipids of cytoplasmic hepatic fat deposits to cause lipid peroxidation. Both ROS and lipid peroxi-dation products attack mitochondrial DNA [6]. Oxida-tive mitochondrial DNA lesions and mitochondrial DNA * Correspondence:[email protected]
1Translational Research Unit, Biomarker R&D Department, Shionogi Co., Ltd,
3-1-1, Futaba-cho, Toyonaka, Osaka 561-0825, Japan
Full list of author information is available at the end of the article
depletion may cause mitochondrial dysfunction includ-ing in energy metabolism. Mitochondrial alterations have been reported in patients with NASH [7] and are associated with impairment of hepatic ATP synthesis [8]. Therefore, mitochondrial dysfunction is a key factor in the progression from steatosis to steatohepatitis. In rats fed a choline-deficient diet, which is well known as a fatty liver disease model, mitochondrial membrane po-tential was decreased with no inflammation [9]. Thus, mitochondrial dysfunction might occur in the early phase of NAFLD.
99m
Tc-MIBI is a single photon emission computed tomography (SPECT) probe which accumulates mito-chondrial membrane potential [10, 11]. Previously, we reported that SPECT using 99mTc-MIBI could detect mitochondrial dysfunction in mice fed a methionine-and choline-deficient (MCD) diet, a commonly used NAFLD model [12]. In clinical studies, it has been re-ported that 99mTc-MIBI uptake correlated with NAFLD activity score [13]. Therefore, evaluation of mitochon-drial dysfunction enables detection of the early phase of NAFLD. It is known that positron emission tomography (PET) has a higher resolution and better quantitation than SPECT [14]. [18F]-BMS-747158-02 (18F-BMS) was originally developed as a myocardial perfusion imaging agent [15, 16]. The uptake of 18F-BMS was reported to depend on mitochondrial complex-1 (MC-1) activity, which is the first component of the mitochondrial re-spiratory electron transport chain. Recently, Ohba et al. reported that [18F]-BCPP-BF, which was used as a PET probe for MC-1 like18F-BMS, detected liver dysfunction in an acetaminophen-treated rat hepatic injury model [17]. These findings suggest that 18F-BMS might also have the potential to detect mitochondrial dysfunction as a cause of NAFLD. In our previous study,99mTc-MIBI could detect the mitochondrial membrane dysfunction in 2 weeks in MCD diet-fed mice. In addition, significant loss of body weight was observed in 3 weeks in MCD diet-fed mice.
In the present study, we evaluated the ability of 18 F-BMS to act as a PET ligand for the detection of hepatic MC-1 activity using mice fed a MCD diet to clarify the mitochondrial dysfunction in the early phase of NAFLD.
Methods
Animals and experimental design
Male C57BL/6J mice, aged 8 weeks old, were purchased from CLEA Japan (Shizuoka, Japan). The mice were studied after 1 or 2 weeks on a MCD diet (Dyets, Bethle-hem, PA, USA) or a normal diet (control group). They were allowed free access to chow and tap water and were housed in a temperature-controlled room main-tained on a 12-h light/dark cycle with lights on at 8:00 am. The experimental protocols were reviewed and
approved by the Institutional Animal Care and Use Committee of Shionogi Research Laboratories and Osaka University Graduate School of Medicine.
Radiopharmaceutical preparation
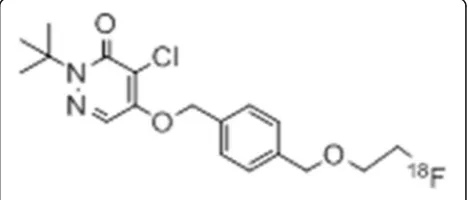
The chemical structure of 18F-BMS is shown in Fig. 1. 18
F-BMS was synthesized as reported previously [18]. Briefly, after the solvent of the 22–30 GBq18F-F−eluate was evaporated under a stream of nitrogen, approxi-mately 5.0 mg of tosylate precursor dissolved in anhyd-rous acetonitrile was added. After 20 min incubation at 110 °C and then cooling to room temperature, the reac-tion mixture was injected onto a semi-preparative HPLC column (COSMOSIL 5C18 MS-II 10 × 250 mm Nacalai Tesque Kyoto, Japan), mobile phase 30 mM ammonium acetate and acetonitrile (3:2), and flow rate 5.0 mL/min for purification. The desired radioactive fraction was col-lected in a round-bottom flask, and the solvent was re-moved in vacuo and the residue was dissolved in 1.5 mL of saline:EtOH:Tween80 (4:0.3:0.05) solution. The radio-chemical yield was 20–30% (non-decay-corrected). Radiochemical purity and specific activity were 98.7% ± 1.2% and 162.9 ± 57.8 GBq/μmol, respectively, with a radiosynthesis and purification time of 60 min.
PET scan
PET scan and X-ray CT imaging were performed with a Pre-Clinical Imaging System Triumph LbPET12/CT (TriFoil Imaging Inc., Chatsworth, CA, USA). Control mice, rotenone-injected mice, and mice fed a MCD diet for 1 and 2 weeks were anesthetized with 2% isoflurane. In the group of rotenone, control mice were injected with rotenone (1 mg/kg, i.p.) 20 min before18F-BMS in-jection. Six to seven mice per group were used for PET imaging. Under isoflurane anesthesia, a venous catheter was introduced through the tail vein and used for the administration of 18F-BMS. Approximately 10–20 MBq 18
F-BMS was continuously injected (0.2 mL/30 s) into the tail vein. PET scans were started immediately after 18
F-BMS injection was started. Dynamic data acquisition was performed for 60 min. After the PET scans, CT scans were performed to acquire anatomical information and to obtain the data for attenuation collection of PET
images. The CT images were reconstructed using the fil-tered back-projection method (512 slices), and acquired PET images were reconstructed by the 3D-MLEM method with CT-based attenuation collection. Dynamic images (6 × 10 s, 4 × 1 min, 11 × 5 min) for time activity curve (TAC) as well as summation images (30–60 min) were reconstructed. CT and PET images were
automatically fused by AMIDE 0.9.2 software. Two regions-of-interest (ROI) were put on the liver tissue, ex-cluding the portal area. Liver uptake of radioactivity was decay-corrected to the injection time and was expressed as the standardized uptake value (SUV), where SUV = tissue radioactivity concentration (MBq/cm3)/injected radioactivity (MBq) × body weight (g). After the PET/CT scan, each mouse was euthanized and the liver collected. Livers were immediately frozen on dry ice and stored at
−80 °C until the MC-1 complex activity measurement or processed for histology.
Measurement of hepatic MC-1 activity
Hepatic MC-1 activity was measured on liver homoge-nates using the Complex 1 Enzyme Activity Dipstick Assay Kit (#MS130; MitoSciences, Eugene, OR, USA). Briefly, MC-1 was immunocaptured and immunopreci-pitated in active form on the dipstick. Then, the dipstick was immersed in MC-1 activity buffer solution contain-ing NADH as a substrate and nitrotetrazolium blue as the electron acceptor. Immunocaptured MC-1 oxidized
Table 1Plasma parameters in mice fed control or methionine-and choline-deficient (MCD) diet for 1 methionine-and 2 weeks
Parameter Control MCD 1 week MCD 2 weeks
TC (mg/dL) 91.1 ± 2.60 66.5** ± 3.85 52.3** ± 2.23
TG (mg/dL) 99.9 ± 15.6 31.6** ± 2.67 7.43** ± 1.71
AST (IU/L) 59.4 ± 18.6 367** ± 45.9 393** ± 108
ALT (IU/L) 25.1 ± 7.16 405** ± 67.1 256** ± 83.0
HDLC (mg/dL) 50.6 ± 1.61 36.1** ± 3.59 27.9** ± 2.08
Data are expressed as the mean ± SEM of six mice per group. Statistical differences were assessed using Dunnett’s test
TCtotal cholesterol,TGtriglyceride,ASTaspartate transaminase,ALTalanine aminotransferase,HDLChigh-density lipoprotein cholesterol
**p< 0.01 compared with the control mice
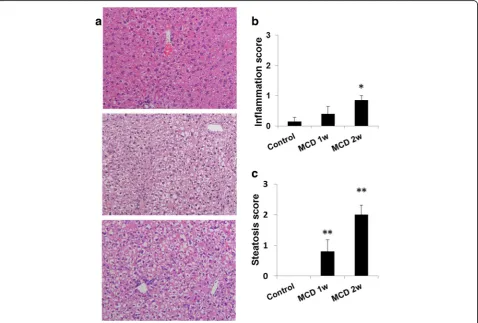
Fig. 2Hepatic histopathology in mice fed a normal or methionine- and choline-deficient (MCD) diet for 1 or 2 weeks.aRepresentative photomicrographs of the liver. Histopathological scores ranged from 0 to 4 (normal 0, minimal 1, mild 2, moderate 3, marked 4). Upper, control diet;
NADH and the resulting H+ reduced nitrotetrazolium blue to form a blue-purple precipitate. The signal inten-sity of this precipitate corresponded to the level of MC-1 enzyme activity in the sample. The total protein con-centration of the liver homogenate samples were measured using a Protein Assay Kit (Bio-Rad, Hercules, CA, USA).
Blood biochemistry and histopathology
Mice were euthanized by exsanguination under isoflur-ane isoflur-anesthesia. Plasma was collected and assayed for the content of alanine aminotransferase (ALT), aspartate aminotransferase (AST), triglyceride (TG), total choles-terol (TC), and high-density lipoprotein cholescholes-terol (HDLC). The right hepatic lobes were fixed in 10% for-malin and sectioned, and the 4μm sections were stained with hematoxylin and eosin (H&E). Steatosis and inflam-mation in the liver were comprehensively assessed by two pathologists based on severity and size of the lesion. Histopathological scores ranged from 0 to 4 (normal 0, minimal 1, mild 2, moderate 3, marked 4).
Statistical analysis
Quantitative data are expressed as the means ± SEM. Means were compared using Dunnett’s test. p values < 0.05 were considered to indicate statistically significant differences. The Pearson product-moment correlation coefficient was used to evaluate the relationship between SUV of 18F-BMS in the liver and the hepatic MC-1 activity.
Results
Physiological characteristics and hepatic pathology Plasma ALT and AST levels were significantly elevated after 1 and 2 weeks of the MCD diet as compared with those of the control mice (p< 0.05) (Table 1). In mice fed the MCD diet for 1 week, weak steatosis, but no in-flammation, was observed in the liver. In mice fed a MCD diet for 2 weeks, mild steatosis and minimal in-flammation were observed (Fig. 2, Table 1).
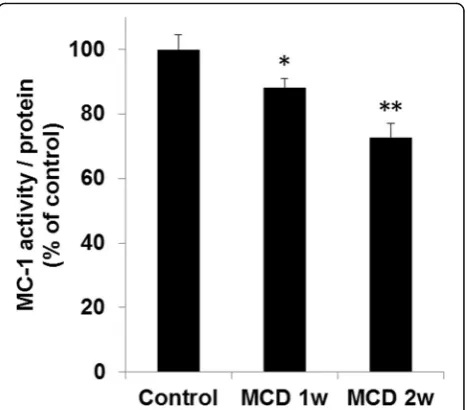
Mitochondrial complex 1 activity
Hepatic MC-1 activity was evaluated after PET imaging. MC-1 activity was decreased by 12% (p< 0.05) in mice fed a MCD diet for 1 week and by 27% (p< 0.01) in mice fed a MCD diet for 2 weeks compared with the control group (Fig. 3).
PET scans 18
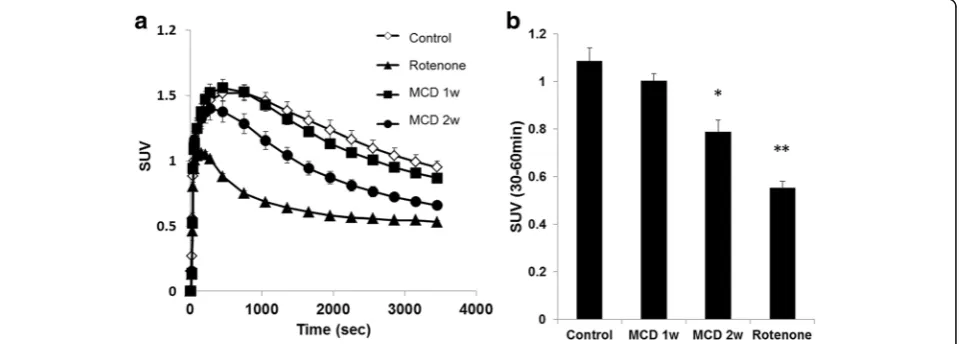
F-BMS PET scans were performed on control mice, rotenone-injected mice, and mice fed a MCD diet. Typical summed axial slice PET images and time activity curves (TACs) of the liver are shown in Figs. 4 and 5a. 18
F-BMS was taken up rapidly by the liver and slowly
washed out (Fig. 5a). SUV at 30–60 min revealed that 18
F-BMS uptake was 50% lower in rotenone-injected mice than control mice (1.09 vs 0.55, p< 0.01) (Fig. 5b). As shown in Fig. 5, a prolonged MCD diet accelerated 18
F-BMS clearance from the liver. In mice fed a MCD diet for 1 week, uptake of 18F-BMS was slightly de-creased, but there was no significant difference com-pared with control mice (1.09 vs 1.00, p> 0.05) (Fig. 5). In contrast,18F-BMS uptake of mice fed a MCD diet for 2 weeks was decreased by 27% as compared with control mice (1.09 vs 0.79,p< 0.05).
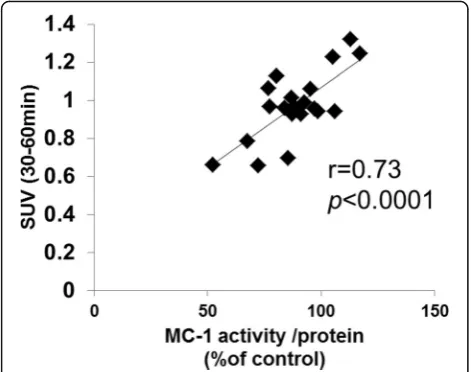
Correlation analysis between 18F-BMS uptake and MC-1 activity indicated a positive correlation (r= 0.73,
p< 0.0001) (Fig. 6).
Discussion
In the present study,18F-BMS was used to evaluate hep-atic MC-1 activity in mice fed MCD diet as a model of NAFLD.18F-BMS has been investigated as a PET myo-cardial perfusion imaging agent for both clinical and non-clinical use [19, 20].18F-BMS was reported to bind tightly to cellular MC-1, which is the first component of the four electron transport complexes in the inner mito-chondrial membrane [16]. 18F-BMS is selectively taken up into the heart because of the high density of mito-chondria in the cardiac muscle. There are some reports that uptake of MC-1 probes, including 18F-BMS, was inhibited by pre-injection of rotenone, a MC-1 inhibitor not only in the heart but also in the brain [21, 22]. In the present study, hepatic uptake of 18F-BMS was also reduced by pre-injection of rotenone, indicating that
18
F-BMS is bound to MC-1 in the liver. Furthermore, the most interesting finding of the present study was that hepatic MC-1 activity was correlated with hepatic 18
F-BMS uptake. Thus, these results indicate that hep-atic uptake of 18F-BMS also depends on MC-1 activity. In the present study, a MC-1 immunocaptured dipstick assay kit, which measured MC-1-specific NADH oxidase activity was used. This method has been used in several tissues, including mouse liver, and was previously used to detect a tetracycline-induced decrease in hepatic MC-1 activity [23]. Notably, MC-MC-1 activity was also signifi-cantly decreased at 2 weeks in mice fed a MCD diet. In a rat study, 11 weeks of a MCD diet decreased MC-1 ac-tivity over 70% [24]. It was also reported that a pro-longed MCD diet progressed NAFLD pathology [24, 25]. In our previous study, NAFLD severity increased with duration of MCD diet [25]. Although after 2 weeks of the MCD diet no fibrosis was observed, 4 weeks of a MCD diet induced weak fibrosis and liver fibrosis was clearly observed at 6 weeks [25]. In the present study, 1 and 2 weeks of a MCD diet revealed weak or mild
steatosis and weak inflammation in mice. Therefore, up to 2 weeks of a MCD diet represents a model for early-stage NAFLD. Multiple studies support the observation that mitochondrial dysfunction is involved in the devel-opment of NASH [8, 26, 27]. Mitochondria generate ROS which damage the mitochondrial respiratory com-plex, decrease mitochondrial membrane potential, and cause ATP depletion [27]. In the setting of NAFLD, there are reports regarding mitochondrial respiratory chain enzymes in NASH patients. Perez et al. reported a lower activity of the five mitochondrial respiratory complexes in patients with NASH [28]. Thus, our study indicated that 18F-BMS might be useful as a high-resolution imaging method for the diagnosis of patients with NAFLD.
In an in vivo microscopic study, blood perfusion of the liver of mice fed MCD diet for 3 and 5 weeks was de-creased by 13 and 19% respectively [29]. There was no study to evaluate blood perfusion of the liver of mice fed a MCD diet for 1 or 2 weeks. In our previous dynamic enhanced MRI study, Tmax and T1/2 after injection of
Fig. 4Representative PET/CT fusion images in the livers of mice fed a control or methionine- and choline-deficient (MCD) diet. Inhibition studies were performed by pre-injection of rotenone (1 mg/kg) into control mice 20 min before18F-BMS infusion
Fig. 5Hepatic radioactivity after18F-BMS injection in mice fed a control or methionine- and choline-deficient (MCD) diet. Rotenone (1 mg/kg, i.p.)
were injected into control mice 20 min before18F-BMS injection.aTime-activity curve of18F-BMS in control mice, MCD diet mice, and rotenone
gadolinium-ethoxybenzyl-diethylenetriamine penta-acetic acid (Gd-EOB-DTPA) were not changed at MCD diet for 2 weeks fed mice and were prolonged at MCD diet for 6 weeks fed mice [25]. Therefore, in the evalu-ation of18F-BMS uptake, there may be little influence of hepatic blood flow. Further study will be needed to clar-ify the effect of blood flow on 18F-BMS uptake in the liver of MCD mice. Thus, the decrease of18F-BMS hep-atic uptake might be due to the decrease of MC-1 activ-ity rather than the hepatic perfusion in mice fed a MCD diet for 2 weeks. In our previous study, hepatic clearance of99mTc-MIBI was changed in mice fed with MCD diet for 2 weeks. These changes have indicated that hepatic mitochondrial membrane potential was decreased at 2 weeks after MCD diet. Thus, non-invasive mitochon-drial function imaging such as18F-BMS and99mTc-MIBI might be useful for NAFLD evaluation.
Conclusions
Hepatic uptake of 18F-BMS was decreased early in mice fed a MCD diet and correlated with hepatic MC-1 activ-ity. This study indicated that 18F-BMS PET imaging might be useful for evaluating mitochondrial dysfunction in the early phase of NAFLD in patients.
Acknowledgements
We thank Simon Teteris, PhD, from the Edanz Group
(www.edanzediting.com/ac), for editing the English text of a draft of this manuscript.
Authors’contributions
TR participated in the design of the study, performed PET, MC-1 measure-ment, and drafted the manuscript. SM and MI performed the PET experi-ments. HI performed the radiosynthesis. YK performed the histological study. KA participated in the study coordination and in the design of the study and drafted the manuscript. All authors read and approved the final manuscript.
Ethics approval
The experimental protocols were reviewed and approved by the Institutional Animal Care and Use Committee of Shionogi Research Laboratories and Osaka University Graduate School of Medicine.
Competing interests
The authors declare that they have no competing interest.
Publisher’s Note
Springer Nature remains neutral with regard to jurisdictional claims in published maps and institutional affiliations.
Author details
1Translational Research Unit, Biomarker R&D Department, Shionogi Co., Ltd,
3-1-1, Futaba-cho, Toyonaka, Osaka 561-0825, Japan.2Department of Applied
Chemistry & Analysis, Research Laboratory for Development, Shionogi & Co., Ltd, Osaka, Japan.3Department of Drug Safety Evaluation, Research
Laboratory for Development, Shionogi Co., Ltd, Osaka, Japan.4Molecular
Imaging in Medicine, Osaka University Graduate School of Medicine, Osaka, Japan.
Received: 4 September 2017 Accepted: 21 November 2017
References
1. Bhala N, Angulo P, van der Poorten D, Lee E, Hui JM, Saracco G, et al. The natural history of nonalcoholic fatty liver disease with advanced fibrosis or cirrhosis: an international collaborative study. Hepatology. 2011;54(4):1208–16.
2. Angulo P. Medical progress: nonalcoholic fatty liver disease. N Engl J Med. 2002;346:1221–31.
3. Day CP, James OF. Hepatic steatosis: innocent bystander or guilty party? Hepatology. 1998;27(6):1463–6.
4. Fukunishi S, Nishio H, Fukuda A, Takeshita A, Hanafusa T, Higuchi K, et al. Development of fibrosis in nonalcoholic steatosis through combination of a synthetic diet rich in disaccharide and low-dose lipopolysaccharides in the livers of Zucker (fa/fa) rats. J Clin Biochem Nutr. 2009;45:322–8.
5. Pessayre D, Fromenty B. NASH: a mitochondrial disease. J Hepatol. 2005;42:928–40.
6. Gao D, Wei C, Chen L, Huang J, Yang S, Diehl AM. Oxidative DNA damage and DNA repair enzyme expression are inversely related in murine models of fatty liver disease. Am J Physiol Gastrointest Liver Physiol. 2004;287: G1070–7.
7. Caldwell SH, Swerdlow RH, Khan EM, Iezzoni JC, Hespenheide EE, Parks JK, et al. Mitochondrial abnormalities in non-alcoholic steatohepatitis. J Hepatol. 1999;31:430–4.
8. Cortez-Pinto H, Chatham J, Chacko VP, Arnold C, Rashid A, Diehl AM. Alterations in liver ATP homeostasis in human nonalcoholic steatohepatitis: a pilot study. JAMA. 1999;282:1659–64.
9. Teodoro JS, Rolo AP, Duarte FV, Simoes AM, Palmeira CM. Differential alterations in mitochondrial function induced by a choline-deficient diet: understanding fatty liver disease progression. Mitochondrion. 2008; 8(5-6):367–76.
10. Jones AG, Abrams MJ, Davison A, Brodack JW, Toothaker AK, Adelstein SJ, et al. Biological studies of a new class of technetium complexes: the hexakis(alkylisonitrile)technetium(I) cations. Int J Nucl Med Biol. 1984;11: 225–34.
11. Strauss HW. MIBI and mitochondria. JACC. 2013;61(19):2018–9. 12. Rokugawa T, Uehara T, Higaki U, Matsushima S, Obata A, Arano Y, et al.
Potential of99mTc-MIBI SPECT imaging for evaluating non-alcoholic
steatohepatitis induced by methionine choline-deficient diet in mice. EJNMMI Res. 2014;4:57.
13. Masuda K, Ono M, Fukumoto M, Hirose A, Munekage K, Ochi T, et al. Usefulness of Technetium-99 m-2-methoxy-isobutyl-isonitrile liver scintigraphy for evaluating disease activity of non-alcoholic fatty liver disease. Hepatol Res. 2012;42:273–9.
14. Schwaiger M. Myocardial perfusion imaging with PET. J Nucl Med. 1994; 35(4):693–8.
15. Yalamanchili P, Wexler E, Hayes M, Yu M, Bozek J, Kagan M, et al. Mechanism of uptake and retention of F-18 BMS-747158-02 in Fig. 6Correlation between hepatic18F-BMS uptake and
mitochondrial complex 1 (MC-1) activity in mice fed control and MCD diet. Correlation analysis using the Pearson
cardiomyocytes: a novel PET myocardial imaging agent. J Nucl Cardiol. 2007;14(6):782–8.
16. Huisman MC, Higuchi T, Reder S, Nekolla SG, Poethko T, Wester HJ, et al. Initial characterization of an18F-labeled myocardial perfusion tracer. J Nucl Med. 2008;49(4):630–6.
17. Ohba H, Kanazawa M, Kaikushu T, Tsukada H. Effect of acetaminophen on mitochondrial complex 1 activity in the rat liver and kidney: a PET study with18F-BCPP-BF. EJNMMI Res. 2016;6:82.
18. Mou T, Zhao Z, Fang W, Peng C, Guo F, Liu B, et al. Synthesis and preliminary evaluation of18F-labeled pyridaben analogues for myocardial
perfusion imaging with PET. J Nucl Med. 2012;53(3):472–9. 19. Sherif HM, Saraste A, Weidl E, Weber AW, Higuchi T, Reder S, et al.
Evaluation of a novel18F-labeled positron-emission tomography perfusion
tracer for the assessment myocardial infarct size in rats. Circ Cardiovasc Imaging. 2009;2:77–84.
20. Maddahi J, Czernin J, Lazewatsky J, Huang SC, Dahlbom M, Schelbert H, et al. Phase I, first-in-human study of BMS747158, a novel18F-labeled tracer
for myocardial perfusion PET: dosimetry, biodistribution, safety, and imaging characteristics after a single injection at rest. J Nucl Med. 2011;52(9):1490–8. 21. Fukumoto D, Nishiyama S, Harada N, Yamamoto S, Tsukada H. Detection of
ischemic neuronal damage with [18F]BMS-747158-02, a mitochondrial
complex-1 positron emission tomography ligand: small animal PET study in rat brain. Synapse. 2012;66:909–17.
22. Tsukada H, Nishiyama S, Fukumoto D, Kanzawa M, Harada N. Novel PET probes18F-BCPP-EF and18F-BCPP-BF for mitochondrial complex 1: a PET
study in comparison with18F-BMS-747158-02 in rat brain. J Nucl Med. 2015;
55:473–80.
23. Beutner G, Eliseev RA, Porter GA. Initiation of electron transport chain activity in the embryonic heart coincides with the activation of
mitochondrial complex 1 and the formation of supercomplexes. PLoS One. 2014;9(11):e113330.
24. Serviddio G, Bellanti F, Tamborra R, Rollo T, Romano AD, Giudetti AM, et al. Alterations of hepatic ATP homeostasis and respiratory chain during development of non-alcoholic steatohepatitis in a rodent model. Eur J Clin Investig. 2008;38(4):245–52.
25. Yamada T, Obata A, Kashiwagi Y, Rokugawa T, Matsushima S, Hamada T, et al. Gd-EOB-DTPA-enhanced-MR imaging in the inflammation stage of nonalcoholic steatohepatitis (NASH) in mice. Magn Reson Imag. 2016; 34:724–9.
26. Serviddio G, Saster J, Bellanti F, Vina J, Vendemial G, Altomare E. Mitochondrial involvement in non-alcoholic steatohepatitis. Mol Asp Med. 2008;29:22–35.
27. Begriche K, Igoudjil A, Pessayre D, Fromentry B. Mitochondrial dysfunction in NASH: cause. Consequences and possible means to prevent it. Mitochondrion. 2006;6:1–28.
28. Perez-Carreras M, Del HP, Martin MA, Rubio JC, Martin A, Gastellano G, et al. Defective hepatic mitochondrial respiratory chain in patients with nonalcoholic steatohepatitis. Hepatology. 2003;38(4):999–1007. 29. Mc Cuskey RS, Ito Y, Robertson GR, Mc Cuskey MK, Perry M, Farrell GC.