R E S E A R C H
Open Access
Calling, texting, and moving:
multidimensional interactions of mobile
phone users
Matteo Zignani
*, Christian Quadri, Sabrina Gaito and Gian Paolo Rossi
*Correspondence: [email protected] Department of Computer Science, University of Milan, Via Comelico 39/41, Milan, Italy
Abstract
The communication networks obtained by using mobile phone datasets have drawn increasing attention in recent years. Studies have led to important advances in understanding the behavior of mobile users although they have just considered text message (short message service (SMS)), call data, and spatial proximity, separately. However, there is a growing awareness that human sociality is expressed
simultaneously on multiple layers, each corresponding to a specific way an individual has to communicate. In fact, besides the common real life encounters, a mobile phone user has at least two further communication media to exploit, SMSs and voice calls. This is advocating a multidimensional approach if we are seeking a compound description of the human mobile social behavior.
In this context, we perform the first study of the multiplex mobile network, gathered from the records of both call and text message activities, along with relevant
geographical information, of millions of users of a large mobile phone operator over a period of 12 weeks. By computing a set of complex network metrics, at different scales, onto the three single layers given by calls, SMSs and spatial proximity, and their extensions onto a three-level network, we provide a comprehensive study of the global multi-layered network which arises from both the overall on-the-phone
communications performed by mobile users and their spatial propinquity.
Keywords: Multiplex network; Mobile phone graph; Social network analysis; Co-location graph; Voice call; Text message; Communication network
Introduction
In recent years, we witnessed the growing awareness of the fact that human communi-cations and social interactions are built on a stratified structure [1]. Today, a variety of techno-communication channels—including online social networks, mobile phone calls, short message services (SMSs), and e-mails—provides an intricate bundle of interac-tions that is overlaid on real life relainterac-tionships enabled by individuals’ spatial proximity. Among all, communication networks constructed on top of mobile phone interactions have attracted increasing research activities in recent years, becoming a relevant topic in the computational social science [2]. Results have led to important advances in under-standing the communication behaviors of mobile users [3, 4] at different scales. For instance, the structural properties of the mobile phone graphs have been investigated
by Nanavati et al. [5] and by Onnela et al. [3], whose studies represent the first attempt to analyze large social networks as they emerge from mobile communications. On the other side, a great effort has been devoted to study the local properties of mobile phone graphs. Many researchers proposed measures to characterize the properties of the links: the burstiness level [6, 7] and the link persistence [4] are often used to describe link dynamics, whereas the link overlap [3] captures the role of the link with respect to (w.r.t.) dense/sparse structures. Nonetheless, most of these studies limit their analysis to one or two ways of communication, while an all-around vision is still missing. Mainly, studies consider the set of voice call data, while, for instance, text messages (either instant mes-sages or SMSs) have been considered rarely and separately from phone calls [5, 8], when analyzing human communications and spatial proximity.
Mobile phone data also provide information about users’ mobility, leading to stud-ies which combine human movement and communication patterns. A few of them have stressed the interplay between users who call each other and their geographical proxim-ity. For instance, the analysis of Phithakkitnukoon et al. [9] reveals that most of the places visited by a person are close to their friends’ positions, while Calabrese et al. [10] and Wang et al. [11] show that the frequency of encounters between users is highly correlated with their frequency of calls. The above works mainly focus on link and geographical proximity; however, more complex structures like communities have been related to the geographic position. At a country level, Caughlin et al. [12] studied a Dominican Repub-lic mobile phone communication network to determine whether the geographic context can explain the community membership, while Expert et al. [13] have been able to divide the Flemish and the French communities by adapting the modularity function to deal with spatial networks. Finally, Onnela et al. [14] have shown that small social groups are geographically very tight but become much more clumped when the group size exceeds about 30 members.
In this paper, we take the first step in the direction of a multiple layer approach by per-forming a combined analysis of the networks obtained from SMSs, voice phone calls, and spatial proximity at a metropolitan scale. This study is based on the multiplex network gathered from a large anonymized dataset of call detail records (CDRs) containing voice call and SMS activities and related spatial information of nearly one million mobile sub-scribers over a period lasting 12 weeks in 2012. Data have been structured like a network of three networks [15] and formally described by a directed multigraph. By comput-ing a set of complex network metrics, at different scales, onto the three scomput-ingle networks and their extensions onto the multiplex network [16], we contribute to some findings on human behavior in the different dimensions captured by mobile phone data.
set of metrics for multiplex networks [17]. We show that interactions by mobile phone are much more reciprocal and thus social [18] than what could be speculated if only calls were considered. Nevertheless, reciprocity is much lower than observed in online social networks and in the Web. As third contribution, we add a third layer given by the spatial proximity, obtaining a denser graph than on-phone communication graphs and we find that people communicating by phone are more likely to be in spatial proximity w.r.t. indi-viduals who do not interact through any mobile medium. In particular, interactions by SMSs are more predictive of spatial proximity than calls. However, a correlation analysis between the degree of co-location (proximity) and the strength of the communications between co-located pairs let emerge a novel result: in a metropolitan area like Milan, peo-ple who are strongly spatially close do not need to frequently communicate, as observed in other studies [10, 11]. At most, the frequency of communications increases when peo-ple not frequently share some locations. Fourth, we study the correlation between the different centralities of the mobile phone users in each layer. The results confirm that the network which merges on-the-phone communications and spatial proximity is made by loosely coupled layers in terms of degree and strength. Finally, we investigate the impact of multiplexity also at mesoscopic scale by performing a community detection analysis on each layer and on the multiplex networks. It comes out that communities at differ-ent layers do not match. Among them, the SMS communities are more represdiffer-entative of groups of people sharing the same interest than the call ones, being call-based communi-ties weaker. This finding also explains why we observed that the communicommuni-ties extracted from the multiplex network are mainly pivoted on SMS communities. In general, SMSs are used by pairs and groups of people with closer relationships that lead them also to meet.
The paper is organized as follows: in the “Dataset” section, we describe the mobile phone dataset; in the “Network definitions” section, we introduce the notation and the definitions to cope with multidimensionality; in the “Networks characterization” section, we microscopically and macroscopically characterize each network separately in terms of node sets, connected pair sets, degree distribution, multireciprocity, and connected components; then, we measure the interplay among the different layers by correlating node centralities and the weights associated to the links. Finally, in the “Community” section, we analyze the overlapping between the communities extracted from the different networks we take into account.
Dataset
This paper is based on a large anonymized dataset of call detail records (CDRs) con-cerning voice calls and short text messages (SMS) of about one million subscribers of an international mobile operator in the metropolitan area of Milan and collected from March 26 to May 31, 2012. The dataset contains an overall amount of more than 63 million phone-call records and 20 million SMS records.
Unlike [19], where we took into account the CDR information about call and SMS inter-actions only, here, we also add the spatio-temporal proximity dimension induced by the human mobility. To include the spatio-temporal information, each entry of the CDR is described by the 5-pletCDR = s,r,tstart,d,loc, wheres andr, respectively, represent
the sender and the receiver of the call/sms,tstartis the initial time of the activity (when
is attached to. We consider the cell towerlocas a proxy for the physical position of the users.1SMS duration is zero, while nearly 40 % of calls have duration equal to 0. Besides missed or unanswered calls, such a large amount of rings is reckoning with a common practice in Italy to use rings for meaning ‘call me back soon” or “I have just arrived”, for instance, to get synchronized at a meeting. Due to the difficulty in detecting 0-duration calls which express significant interactions, we remove these records from the dataset. Furthermore, according to the literature on mobile phone cleansing [2, 6, 18], we filtered out calls involving other mobile operators to mitigate the bias between operators. More-over, the positions of the users not supplied by the mobile operator are incomplete as well as the evaluation of the interplay between mobility and the communication activities.
On the basis of the CDR dataset, we construct two preliminary on-phone communi-cation networks, one for each channel, that are then processed to extract only relevant interactions. To the purpose, in the call graph, we consider the pairs of users whose sum of the call durations exceeds the minute and whose total number of interactions is greater than three. This way, we discard pairs with on average one interaction per month [18] and who exchange a small quantity of information. For the same reasons, in the SMS graph, the only relevant pairs are those with a total number of interactions greater than three. After the data cleansing, the analysis is performed on a whole population of about 420,000 people generating almost seven millions calls, 317,000 h of conversations, and four mil-lions SMSs. Furthermore, as shown in the “Networks characterization” section, we obtain maximal degrees similar to reciprocated networks, keeping at the same the directionality of the links.
Previous data are exploited to evaluate and study human interactions facilitated by mobile phones and implicitly to measure the topological closeness of the mobile phone users in a techno-communication dimension. Meanwhile, mobility data allows us to cap-ture some degree of closeness between two individuals in a different dimension: the physical space. The degree of physical proximity that can be extracted from a mobile phone dataset does not equal to measure face-to-face contacts nor to quantify physical interactions. However, the higher spatial granularity of cellular towers in a metropolitan area2, w.r.t. other mobile phone datasets [9, 11, 14, 20], allows us to obtain more precise results and levels of proximity closer to physical interactions.
To obtain a reasonable value which expresses the closeness of a pair of users in the physical space, we leverage theco-location rate (CoL)as defined in [11]. Givenn(u), the set of CDR tuples such thatuis equal to the senders, we defineCoLas:
CoL(u,v)=
i∈n(u)
j∈n(v)(T− |tstart(i)−tstart(j)|)σ(loc(i),loc(j))
i∈n(u)
j∈n(v)(T− |tstart(i)−tstart(j)|)
(1)
Network definitions
Interactions among individuals take place through a variety of communication chan-nels and can be described by as much different networks, thus leading to a multiplex graph. Although our dataset provides information about only three levels, in this section, we introduce a general definition of edge-labeled multigraph which covers any multi-layered setting. To represent the directional nature of the communications, we consider only directed networks without any labels on vertices. The same holds for the physical proximity graph, since it is possible to represent an undirected graph as a digraph.
Definition 1.An edge-labeled directed multigraph is a tupleD= (V,E,D,l)where V is the set of vertices, E⊆ V×V ×D, with D, the set of dimensions or layers, is the set of labeled directed edges, and l: E→S is a mapping assigning an element s∈S to an edge (u,v,d)∈E.
Likewise, the single layer case, we can extract from a directed multigraph its undirected graph by removing the direction in each layerd and by introducing a function which merges the labels of the edges whenever a link is bidirectional.
Given an edge-labeled directed multigraph, we may need to extract only a specific layer or consider them separately. This occurs, for instance, when comparing the properties of different networks or evaluating the importance of a vertex in a specific layer. To this purpose, we provide the definition ofd-network layer.
Definition 2.Given an edge-labeled directed multigraphD = (V,E,D,l)and d ∈ D, we define the d-network layer Ddas the graph Dd=(Vd,Ed)where Ed= {(u,v)∈V×V|
(u,v,d)∈E} and Vd = {u,v∈V|(u,v)∈Ed}. A similar definition holds for undirected multigraphs.
The multigraph and the network layer definitions model multi-layered settings. To adapt these definitions to the three-layer case given by the voice call, the SMS, and the co-location layers, we setD = {c,s,loc}, wherec,s, andloc, respectively stand for call, SMS, and co-location. In particular, we denoteDcascall graphandDsasSMS graph. The
co-location network, instead, is described by the undirected graphGlocwhose nodes are
contained inVloc=Vc∪Vsand an edge(u,v)exists ifCoL(u,v) >0.
We finally define a mapping functionlwhich enables the modeling of the strength of the on-phone interactions and the level of co-location.lis defined as follows:
Definition 3.Given an ordered pair< fc(u,v),δ(u,v) >∈ R2 , fs(u,v) ∈ R, and CoL(u,v)∈[ 0, 1],
l(u,v,d)=
⎧ ⎪ ⎨ ⎪ ⎩
<fc(u,v),δ(u,v) > d=c
fs(u,v) d=s
CoL(u,v) d=loc
Although the previous mapping definition captures both duration and frequency, in the following, we mainly consider frequency only. This way, weight variables on the different communication dimensions, call and SMS, are comparable. To summarize the objects we are dealing with, in the following sections, besidesDc,Ds, andGloc, we take into account
two edge-labeled directed multigraphDcsandDcsloc. The former models the overall
on-phone interactions since it includes the call and the SMS layers. The latter represents the overall multiplex network captured by the mobile phone dataset sinceDcsis merged with
the co-location network.
Networks characterization
Before dealing with many layers simultaneously, we analyze each property in each dimen-sion, separately. This approach is intended to highlight the importance of all dimensions in describing the human behavior in a mobile phone dataset. In this section, we charac-terize mobile users in terms of communication media usage and physical presence in the city of Milan by measuring how the three networks overlap. That allows us to say which interactions between SMS or call are more predictive of the spatial proximity. The anal-ysis of the layers overlapping stresses the importance of a multilayer approach since we observe that if we focus our attention just on a single dimension, we lose a few interac-tions. These findings also impact on the degree centrality. We ask whether active users, for example hard texters, are as active in the other communication layer or whether users with a high degree of proximity with many people are equally important into the techno-communication dimension, and we find that the layers are loosely coupled. Finally, we find that at the macroscopical level, the networks are similar despite their microscopical differences.
Networks size and order
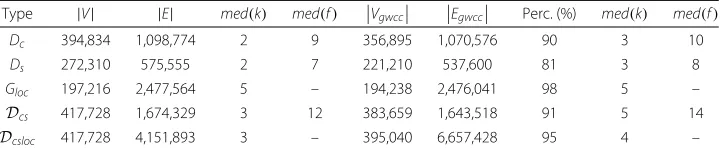
In Table 1, we report the basic properties ofDc,Ds,Gloc,Dcs, andDcsloc. The order and the
size of the SMS and the call graphs indicate that the on-phone communication layers are very sparse. As for the co-location network, it is completely different from the previous graphs since nodes are less, but the number of links is much higher, i.e., the co-location network is denser, and many nodes are not physically co-located, as it will be discussed afterwards.
To compare our results with the literature on phone calls, we also report the order and the size of the giant weakly connected components. Generally, the percentages of nodes in the giant components are comparable with other mobile phone graphs [5], and the SMS
Table 1Basic properties of theDc,Ds,Gloc,Dcs,Dcsloc, and of their giant weakly connected components.VgwccandEgwccrepresent the number of nodes and edges of the giant weakly connected component (gwcc), respectively.med(k)indicates the median degree, andmed(f) denotes the median strength. The columnPerc.reports the ratio between the number of nodes in the giant component and in the whole network
Type |V| |E| med(k) med(f) Vgwcc Egwcc Perc. (%) med(k) med(f)
Dc 394,834 1,098,774 2 9 356,895 1,070,576 90 3 10
Ds 272,310 575,555 2 7 221,210 537,600 81 3 8
Gloc 197,216 2,477,564 5 – 194,238 2,476,041 98 5 –
Dcs 417,728 1,674,329 3 12 383,659 1,643,518 91 5 14
graph is less connected w.r.t. the call graph. Observing the overall number of nodes (first column in Table 1), the multilayer graphDcsincludes more users w.r.t. the single layers.
For instance, the social network built on voice calls loses about 5 % of users in the mobile network up to 7 % of nodes when considering the giant component. The phenomenon is further amplified if we considerDcsloc. Here, the loss in the voice call graph is 9 %, and
the introduction of the spatio-temporal proximity links increases the number of nodes weakly connected (more 3 % of nodes w.r.tDcs).
Node sets
The analysis of the node set inDs,Dc, andGloc, respectively, allows us to highlight the
users’ habits in terms of usage and preference of the communication media. Do all users adopt both media or someone prefers to communicate by call or SMS only?
The number of nodes in the different networks in Table 1 suggests thatVcandVsdo
not perfectly overlap, nor one is included in the other, rather they partially overlap. In fact, we find that 35 % of active users adopt only the call as interaction media, while the exclusive use of text messages involves 5 % of active users. In general, we observe that many users perceive the two communication media as different. About 40 % of active users prefers only an exclusive communication medium (call or SMS), while the remaining ones prefer integrating the peculiarities of the two communication channels. In fact, calls are more instinctive and similar to face-to-face conversations, whereas text messages are more intimate and allow a greater level of reflection [1].
We extend the overlapping evaluation to the set of people who are co-located (Vloc).Vloc
represents a proper subset of the mobile phone users by construction (see the “Network definitions” section) and contains 47 % of mobile phone users. The remaining 53 %, who interact through the cellular network infrastructure in Milan, do not live mostly in the city or are passing by. Consequently, we refine the above analysis on the exclusive usage of the communication media by focusing only on the users who share locations in Milan. In this case, 40 % of the users share with at least another user a different location in Milan and use both SMSs and calls, whereas 0.6 and 6 % adopt exclusively SMSs or voice calls, respectively.
Link sets
About the analysis of the link sets, in the following, we consider the connected pairs, i.e., (u,v)such that at least a link betweenuandvorvanduexists. By abusing of notation, we denote asEc,Es, andElocthe set of the connected pairs in each layer, respectively. In this
case, we do not take into account the direction of the links because we focus only on the interplay between the spatio-temporal proximity and the communication media adopted to interact.
The first quantity we investigate is the number of connected pairs in the techno-communication directed multigraphDcsthat happen to be co-located, i.e.,|(Ec∪Es)∩Eloc|
Table 2Overlapping among different connected pair sets. The subsets are disjoint to make their combinations additive
(Ec∩Eloc∩Es)=I (Ec∩Es)\I Ec\(Es∪Eloc) Es\(Ec∪Eloc)
|E| 110557 553621 162458 131665
% 3 16 4 3
Ec∪Es∪Eloc (Es∩Eloc)\I Eloc\(Ec∪Es) (Ec∩Eloc)\I
|E| 3325308 8485 2331671 26851
% 100 0.2 70 0.8
occur4. Consequently, people communicating by phone are more likely to be in spatial proximity w.r.t. individuals who do not interact through any mobile channel.
Since the multigraphDcsloctakes into account both SMSs and calls, we can estimate, for
each given pair of interacting users, whether the probability of being in proximity given a SMS communication is greater than the same probability given an interaction mediated by a call. We find that when interactions occur via SMS, this probability equals 0.285, and it is greater than the probability obtained when voice calls are used (0.16)6, i.e., the interactions via SMS are more predictive of a possible spatio-temporal proximity w.r.t. voice calls.
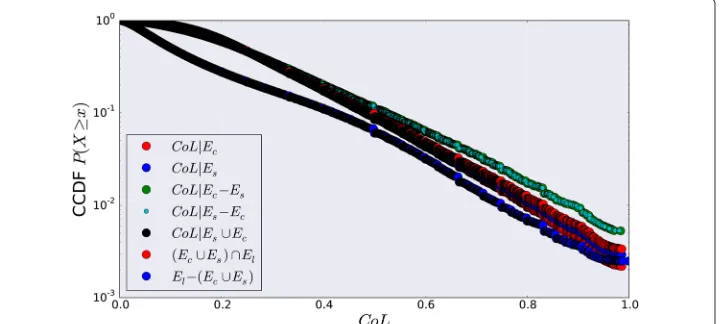
To go further in the analysis, we introduce the weights associated to the different types of link with the purpose of verifying whether interacting pairs happen to be more likely in proximity than pairs that do not communicate but have a positive co-location rate. First, we investigate the distribution of the co-location rateCoLof the connected pairs which belong toEloc∩(Ec∪Es) and compare it with the same distribution computed on the
co-located pairs that do not communicate. The results, reported in Fig. 1, do not show significant differences in the distributions. However, the latter is slightly above the for-mer, i.e., spatially close people that also use media to communicate are characterized by a proximity index higher than people that do not interact through mobile phone. We also investigate the probability that pairs, simultaneously sharing the same location, commu-nicate by using a given medium (call or SMS separately). To this aim, in Fig. 2, we compare different subsets of the union of the connected pair sets: pairs connected by calls, by
Fig. 2Proximity given the communication medium. CCDF ofCoLinEs∩Eloc,Ec∩Eloc,(Ec\Es)∩Eloc, (Es\Ec)∩Eloc, and(Ec∪Es)∩Eloc
SMSs, by calls or SMSs exclusively, and by calls or SMSs (Ec∪Es). We note that the
distri-butions are not different. That suggests proximity strength does not rely on the channel people are using to communicate and interact.
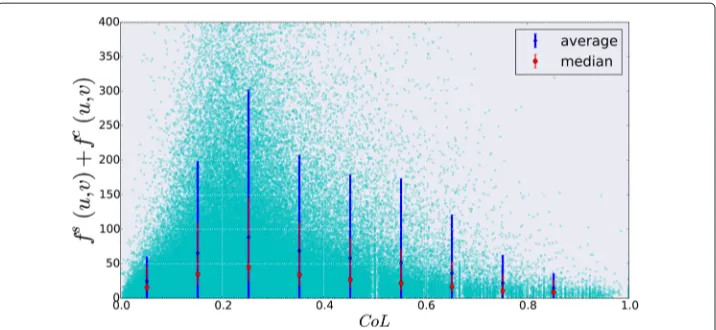
Some recent studies have found a positive correlation among spatio-temporal prox-imity, the presence of links in the related communication networks and their strengths; so people in proximity are more likely to be connected in the social network and to have intense direct interactions [10, 11]. We observe that both studies rely on mobile phone datasets covering wide geographical areas and consequently are characterized by a coarse spatial granularity. As a consequence, we wonder if the above results could be confirmed by our dataset or if the size of the region and the spatial granularity influence the outcomes. To replicate and compare the results, we apply the same methodology in [11], i.e., we study the correlation betweenCoLand the strength of the on-phone com-munication links. In Fig. 3, we show the average and median values of the link weights (frequency of the interactions) as a function of the co-location rate. The trend is com-pletely different from the aforementioned results. We observe that fromCoL = 0.2, the link strength decreases whileCoLis increasing. That implies people who are very close in the spatio-temporal dimension do not frequently interact, while people who are some-time co-located communicate more frequently. This phenomenon could be explained in the light of the limited geographical area under study. In a city, people sharing simul-taneously many places do not need a mobile phone to communicate since they exploit face-to-face interactions. Otherwise, people who are scarcely in proximity complement the face-to-face interactions with the mobile phone communications. We argue that, in a city area, mobile phones perform their original purpose, i.e., make the communication between distant people easier.
Reciprocity and multireciprocity
Fig. 3Correlation betweenCoLandfc+fs.Blue barsandpointsrepresent the average strengths and their standard deviation, whilered barsandpointsindicate the medians and the 0.25/0.75 quantiles.Cyan points represent the original sample
Among the two possible definitions of mutuality, we consider the dyad census adopt-ing the approach presented in Wassermann and Faust [21]. As requested by the census approach, in Fig. 4, we enumerate all the ways a pair of nodes has to establish a relation-ship and then we gather them into equivalence classes which express similar behaviors. According to Fig. 4, class A includes links definitely not reciprocal, neither on single lay-ers nor on the multiplex network. Class B reflay-ers to links which are reciprocal in one layer only. Class C refers to the true multidimensional reciprocity where links in the opposite directions belong to different layers. Note that classes B and C reckon with the impor-tance of considering both the two communication media when the overall reciprocity on mobile phone has to be evaluated. Finally, class D contains very social edges as reciprocity
exists in both layers. Note that the extension to more dimensions is easily achieved by defining appropriate equivalence classes. In Fig. 4, we report the percentage of connected pairs which belong to the different reciprocity classes. We observe a high number of non-reciprocated pairs accounting for more than 60 %. As for classes B, C, and D, the overall value of 0.34 is far from the reciprocity value that characterizes online social networks, rather it is more similar to values observed in the Web graph. The dyad census allows us to compute the reciprocity of each network layer, as class B contains reciprocated edges in a single layer. We find the reciprocity of the call graph to be 0.28, while the SMS graph has reciprocity 0.4. If we assume that reciprocity is a measure of the social importance of a tie, these values indicate that there is a greater fraction of social edges in SMS graph than in call graphs. Moreover, the resulting reciprocity is lower than in online social networks and in the Web, where it came out to be around 0.7.
We find that connected pairs are poorly reciprocal, mainly due to the low reciprocity of the call graph even if SMSs, as communication channel, are more suitable for bidirec-tional relationships. Moreover, only 9 % of pairs take advantage of the multidimensionality offered by the phone media to maintain relationships. As a matter of fact, the reciprocity typical of class C is negligible.
Degree distribution
In this section, we examine the macroscopic structure of the mobile phone network by considering the degree (k) and the strength (s) distributions. Degree and strength distri-butions give information about the level of interaction of a mobile user on the basis of the number of people contacting him/her, the number of people s/he contacts, and how often. As we are dealing with directed networks, besides the degree and strength distri-butions, we also analyze the in-degree (k−), the out-degree (k+), the in-strength (s−), and the out-strength (s+) distributions, wheres−ands+are obtained adopting as weight the frequency of the interactionf.(u,v). As for the multidigraphD, we define the degree of a node askD(u)= |D+(u)∪D−(u)|, whereD+(u)andD−(u)represent the out-going and in-going neighborhood onD, respectively. An analogous definition holds for the strength distribution. These two variables account for the overall on-phone communication activ-ity of a user whereaskDcslocsums up phone communications and potential interactions in
the physical space.
Fig. 5Degree and strength distributions. The panels inside (a) and (c) report the degree and the strength distributions, respectively
distributions of the multigraphsDcsandDcsloc. In Fig. 5a, b, we observe that the
proba-bility of connecting (or being connected) with more thankpeople inDcsis ever greater
than in the single layers. This way, the multiplex mobile network captures much more relationships than when considering only a single communication channel. For instance, the number of relationships captured by the multigraph is on average almost twice as much a single layer. This observation is further stressed if we take into account the degree distribution inDcsloc. As reported in Fig. 5a, the introduction of the co-location network
increases the number of neighbors of a node. Specifically, the co-location impacts on the tail of the distribution, i.e., the probability of having hundreds of neighbors is much more higher when we add the information about spatio-temporal proximity w.r.t. the on-phone interactions only.
Analogous observations hold for the strength distributions reported in Fig. 5c, d. Here, the values of the shape parameter are comparable within the same layer, so in- and out-strength distributions are similar. Also, out-strength values almost double when considering SMS and call, thus reinforcing that the multidimensional view on mobile phone datasets is mandatory to really understand the communication attitudes of phone users.
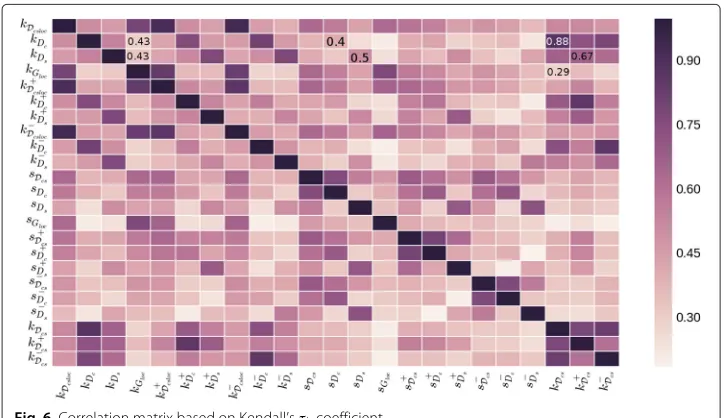
Degree and strength correlations across dimensions
analysis on the different pairwise quantities. As a rank correlation method, we compute the Kendall’s rank correlation coefficientτb7on the ranking induced by the degrees and
the strengths. In Fig. 6, we visualize the rank correlation matrix, where each row (column) corresponds to a centrality measure computed on the relative network.
Before comparing the interplay among the different layers, we analyze the correlation between the degree and the strength in each single layer. In fact, by correlating the degree and the strength, we can say if users who communicate or is contacted by many people adopt heavily and frequently their mobile device. As for the call graphDc, we observe
in Fig. 6 a positive correlation between the degree kDc and the strengthsDc. However,
τb = 0.4 indicates that it is not always true that a high number of called people
cor-responds to a proportional call activity, i.e., some individuals communicate with a lot of people but not so frequently. The same observation holds for the SMS graph, where τb(kDs,sDs)=0.5. Otherwise as regards the combined usage of the communication media
(Dcs), by comparingτb(kDcs,kDs)andτb(kDcs,kDc), we find that the addition of the calling
activity to the texting layer could change the importance of the users inDs, i.e., mobile
phone users with a high rank in the SMS graph could drop off their ranking if one also adopt the call activity to measure the users’ importance.
As for the correlation between the call/SMS layers and the co-location network, results in Fig. 6 confirm the loosely coupled interplay observed in the connected pair analy-sis. Here, we compare the degree distribution inGloc that captures how many potential
face-to-face interactions a user could have and the degree distributions in the call and SMS graphs, respectively. Also, in this case, the degree inGlocis poorly correlated with
the centrality in the call or in the SMS networks. That means mobile phone users who are spatially close to many individuals but communicate with few people exist. The same observation is still true whereas we consider the global propensity to communicate expressed byDcs. In this case, we measureτb(kDcs,kGloc)=0.29.
In general, we find that the activity and the popularity is not straightforwardly main-tained across the on-phone communications and the physical space; so, the different dimensions are poorly coupled in terms of degree and strength.
Neighborhood overlapping
Regarding the comparison of the voice call and text message networks, the previous results show that there is not a perfect overlapping between people calling and messaging and highlight the importance of treating multidimensionality to better describe the social relationships. However, the overlapping of the node setsVcandVsis a general and sharp
characteristic, which does not account for the different behavior of nodes. For instance, a user who mainly calls and sporadically texts belongs toVc∩Vs, even if she/he mainly
is a caller. The same observation applies to the degree distribution onDcs, where we lose
which, among the layers, mostly contributes to the expansion of the node’s neighborhood. To obtain further insights about nodes overlapping and neighborhood distribution across different dimensions, we now adopt a user-centric view by focusing on the evalua-tion of the in/out-neighborhood overlapping of a nodeu. To the purpose, we complement the Jaccard index of the neighbors set by defining theexclusivityφ of a layerdi for a
nodeu. This measure takes into account the different set of the out-going (in-going) neighbors on the two dimensions as follows:
φ(.)
{d1,d2}(u)= (.)
d1(u)−
(.)
d2(u) (.)
d1(u)∪
(.)
d2(u)
, (2)
where+d(u) = {v|(u,v,d)∈E},−d(u)= {v|(v,u,d)∈E}, andd+/− = d+(u)∪−d(u) are, respectively, the out-going, the in-going, and the general neighborhood of the nodeu on the dimensiond. For instance, a user who adopts only calls to maintain social relation-ships with most of her/his contacts will have aφ{(c+,s)}(u)close to 1. By adopting exclusivity, a mobile phone user is characterized by the call and text message exclusivity values and by the Jaccard indexJthat captures the intersection between call and SMS neighbors.
In Fig. 7, we report the distributions of the different indexes computed on nodes with degree (in-degree, out-degree) greater than 10, while the in-set figure shows the distribu-tions on all nodes. Comparing the call exclusivity in both figures, we observe that many nodes with degree less than 10 exclusively adopt voice calls. In fact, the probability of observing an exclusive caller is about 0.3 in the in-set figure, while is close to 0 when nodes are filtered. Further, the Jaccard index distribution (dashed line) in Fig. 7 shows that users who communicate with more than 50 % of their neighbors are about 25 % of the population, while people are more likely to engage in relationships via calls than via text messages. In fact, the distributions ofφ{(c+,s)}(u)andφ{(−c,s)}(u)show that about 20 % of users almost exclusively call their friends and contacts. Text messages, on the other hand, are less widespread as the main medium to exclusively relate with most of their contacts.
Connected components
In this section, we exploit reachability analysis to examine the macroscopic shape of our networks with the aim of evaluating their structural similarity and comparing them with other mobile phone networks or with other networks, such as, for instance, the Web graph.
Fig. 7Jaccard coefficient and exclusivity
elements. The order of theDcs’s giant component w.r.tDc’s one highlights the role of SMS
links. Through these links, the number of reachable nodes increases 9 % w.r.t nodes only reachable by calls. Moreover, SMS users (users who exclusively use SMS) aggregate other minor connected components of the call graph into the giant component. This suggests that in spreading and diffusing information, the mobile operator and third parties clients should take into account both communication channels to reach more phone users.
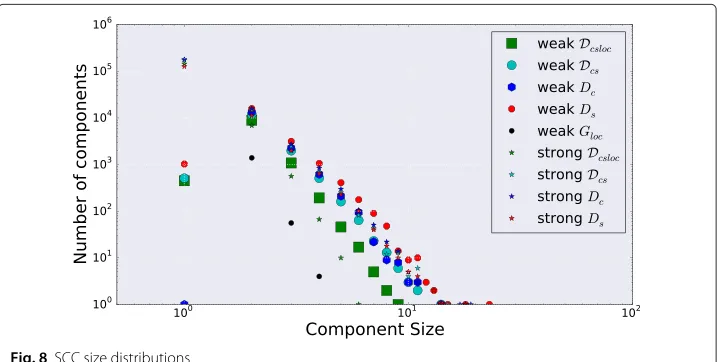
The link direction allows us to extract strongly connected components (SCC). Figure 8 shows the distribution of the SCCs size. Both strongly and the weakly connected com-ponents exhibit a heavy-tail distribution, and this behavior applies to both mono- and bi-dimensional networks. The considered networks are similar in terms of size distri-bution, and the obtained results are in line with those of the Web graph and of other online social networks. Shortest path and reachability analysis allows the identification of a giant strongly connected component and of the regions connected to it. This way, we can compare the macroscopic structure in terms of the Bow-tie model. The Bow-tie
model, introduced by Broder et al. [25], is characterized by a giant SCC, an IN region con-taining components from which SCC can be reached, and an OUT region reachable from the SCC. We assign each node to the proper region and compute the relative sizes of the regions. Results, shown in Table 3, indicate that the three networks are structurally sim-ilar, as about 40 % of users belongs to the SCC, 6 % forms the IN region, and 20 % are in the OUT region. Moreover the reported percentages confirm the macroscopic structural difference of the telecom graphs w.r.t. the WWW graph observed in [5] in terms of the Bow-tie model.
Community
We have shown that the three considered layers are macroscopically similar, but nodes, links, and consequently ego-networks are very different when considering call or SMS on their own. We now wonder what happens at the intermediate level where people aggregate in communities. Do SMS and call communities match? Otherwise, are multidi-mensional communities8pivoted on SMS or call communities? What are the interplays between SMS, call, and multidimensional communities with the co-location communi-ties? To answer these questions, we first detect communities onto the networks by means of three different detection algorithms. Then, we introduce a covering approach along with a few metrics to measure the degree of similarity between communities. Finally, we apply them both to compare SMS, call, and co-location communities and to deepen the structure of the multidimensional communities.
Community detection methods
The cluster analysis described in this section relies on the following community detec-tion algorithms: the well known Louvain method (LM) [26] and label propagadetec-tion (LP), a very powerful yet simple algorithm [27]. Besides, as LP might happen to move a label towards nodes far from the origin, thus leading to a very poor community structure, we also perform label propagation with hop attenuation (LPHA) [28] that overcomes this drawback.
Label propagation (LP) [27]: The algorithm requires that each nodev∈Vdetermines its community by choosing the most frequent label shared by its neighbors. Initially, every node belongs to a different community. After some iterations, groups of nodes quickly reach a consensus on their label and they begin to contend those nodes that lay between groups. Here, we use the asynchronous update version, since it solves some problem of label fluctuations in particular graph structures. We choose LP due to its scalability since it has a linear time complexity and, unlike many others algorithms, it is parameter free.
Label propagation with hop attenuation (LPHA): LP is a very fast, scalable, and per-forming algorithm; however, in some contexts, a label can get to nodes of the network very far from the original one, thus leading to a very poor community structure. To curb this problem, Leung et al. [28] proposed some improvements and adjustments to the original
Table 3Portion of nodes in the different elements of the bow-tie model
Type IN SCC OUT Tendrils Tubes
D 6.1 48.1 22.0 13.5 0.6
Dcall 7.0 42.4 21.9 16.3 0.7
algorithm. We introduce in our LP implementation the hop attenuation improvement. The idea is to assign atime to livescore to labels in order to prevent them from reaching too far nodes.
Every node updates its label choosing the one with maximum score shared by its neighbors. When the label is chosen, the hop score is updated subtracting aδ∈(0, 1):
si(Lu)=
max
u∈(u)(Lu)
si(Lu) −δ
whereLuis the nodeulabel,su(L) ∈[ 0, 1] is the score of labelL, and(u)is the set of
neighbors for nodeu.
Louvain: The Louvain method (LM) was introduced by Blondel et al. [26] and is one of the most popular greedy algorithms formodularityoptimization. The method is very fast and can produce very high-quality communities. The algorithm is iterative. Each itera-tion consists of two steps. In the first one, every node is initially set to a new community. Then, for every nodeiand its neighborsj, the algorithm calculates the gain in modularity movingifrom its community toj’s community. The nodeiis then moved to the commu-nity with maximum gain. If there is no positive gain, it remains in its commucommu-nity. The first phase finishes when there are no more movements. The second step is to group together all the nodes in the same community in a macro node. A new graph is built, in which macro nodes are linked by an edge if there is an edge between two nodes belonging to the two different macro nodes. After the new graph is built, a new iteration starts and a new phase one is initiated.
We run the three community detection algorithms on the weighted undirected net-worksGc,Gs,Gloc, andGcs. To estimate the weight of the undirected link, we sum the
strengths of the directed links connecting the pair. Figure 9 shows the size distribution of the communities detected by LM, LP, and LPHA. Louvain and LP detect a giant com-munity, while LPHA splits it into smaller ones. The community size distributions of LP and LPHA are power-law, as found in other networks. Label propagation algorithms find small-medium size communities, while Louvain favors small and medium-large com-munities. The above results motivate the choice of three different community detection
algorithms. An outcome that holds for three different partitions is more independent from the chosen community detection method.
Communities match method
Although people aggregate in communities in both call and SMS layers, not necessary those communities coincide across the layers. As a consequence, we aim to investigate the degree of matching of the communities detected on the four networks. The evaluation of the overlapping between communities has some common aspects with standard point measures of cluster similarity [29]. The latter relies on finding the best matching between communities, while we are interested in evaluating the degree of their overlapping, and they assume the same node set, while we need to evaluate partitions on different sets as described in the “Networks characterization” section.
This way, we adopt a covering-like approach similar to the one used in [30]. Given a partitionPi onViand a communityci ∈ Pi, we compute how it is covered by the
com-munities of another partitionPjonVj. We consider the maximal covering, i.e., the set of
communities performing the maximum coverage ofci:
MT(ci,Pj)=argmaxX⊆Pj,∀cj∈X,ci∩cj=∅
cj∈X
|ci∩cj| (3)
In Fig. 10, we report the meaningful covering cases. The communityci can be partially
tiled or covered by one or more communitiescjs of the other partitionPj, as in Fig. 10a.
Otherwise,cican be totally covered by one or more communities as in Fig. 10b. As for
total covering, we separately analyze some specific cases: (a) the perfect matching indi-cating communities that coincide, (b) communities which are properly subsets, and (c) communities that are covered by multiple communities of the other layer.
The partial covering by many sets includes different situations where the degree of the overlapping and the importance of the covering vary. For instance, many communities could marginally overlap to a single community, resulting in a low overlapping level or the region outside the covered community (yellow area in Fig. 10b) changes, indicating a more or less strong similarity betweenci andMT. We use three metrics to evaluate the
degree and the goodness of the covering, besides the population percentages of the classes described above:
• The cardinality ofMT(ci,Pj), denoted asν. Communities with a highνact as bridges
across the communities in the other layer.
• The coverage ratio CR as the fraction of nodes ofcicovered byMT, i.e.,
Xj∈MT|Xj∩ci|/|ci|. The closer to 1 the coverage ratio, the greater the accuracy of
the covering. This quantity is meaningful for the partial overlapping case.
• The coverage precisionCP defines asXj∈MT|Xj∩ci|/|Xi∈MTXi|. It accounts for
that portion of nodes which are outside the covered set. Values ofCP close to 1
indicate thatMT almost coincides withciin the total covering case or is almost a
proper subset ofciin the partial overlapping.
Communities across call, SMS, and co-location
First, we examine the communities overlapping focusing and comparing the call and the SMS layers, separately. Although, at macroscopic level, the size distributions of the communities detected by the three algorithms exhibit some differences, results about community matching are very similar. Thus, we will show results on the partitions9of the call layer,Pcall, the SMS layer,Psms, the co-location layer,Ploc, and the multidimensional
graph,P, induced by the communities detected by LPHA, only.
We ask whether people form similar groups despite the communication channel they adopt or vice versa different media capture different groups. Furthermore, we wonder which communication layer is more representative of the groups given by the spatial prox-imity. The first difference emerges just examining the probability distribution function of the community size in Fig. 9. SMS communities are generally smaller than call commu-nities, independently of the detection algorithm. These outcomes support the idea that SMS is the communication channel usually adopted by groups to build and maintain close social relationships or by socially anxious people [1].
More insightful results have been obtained by analyzing how the communities of the two layers overlap. In the comparison, we only consider the communities with size greater or equal to 10. As for communities equality, they are never identical and only a few are proper subset. Whereas the lack of identical communities could be expected due to the diversity of the node sets, the scarcity of proper subsets suggests that communities express different groups in the two layers. The almost inclusion of the SMS node set into the call set rebounds on the number of totally covered SMS communities. In fact, we find that most of the SMS communities are totally covered by 7.5 call communities on aver-age or they are partially covered with a high coveraver-age ratio, but the coveraver-age precision is very low (0.8 quantile equals to 0.05 ). This indicates that neither the union of some call communities can precisely express a single SMS community. A similar behavior concerns the covering of the call communities with the SMS ones. In this case, SMS communi-ties are a little more precise in the covering, but they only partially overlap with the call communities.
The analysis of the call/SMS overlapping highlights that these communication channels are used by different groups to establish interactions and relationships. Communities dic-tated by voice call are totally different from SMS communities, nor a community in a layer captures a specific subset in a community on the other layer.
discussion about the multidimensional case to the next section. As for the SMS commu-nities, we observe that a single co-location community is covered by many SMS groups. This phenomenon is even more pronounced if we observe call communities as shown in Fig. 11a. These high cardinality values could not necessarily imply that the call and SMS networks are completely different from the co-location at a mesoscopic scale. Indeed, we could have big location communities containing many small SMS or call groups. That is not our case, as reported in Fig. 11b, c. In fact, despite the high coverage ratio of calls, the coverage precision is very low for both layers. That means call and SMS communities are entirely different from the co-location communities. These results are quite expected, especially in light of the lack of an increasing relation betweenCoLand the strength of the communications.
Multidimensional communities
As the two layers of the networks have completely different structures with respect to communities, we ask ourselves the following question: Is the multidimensional network related to the single layers? And is it driven by SMS or call communities? The commu-nity detection in multidimensional networks is still an open issue [31]. Here, we follow the approach presented in [32]. We proceed to extract multidimensional communities by introducing a mapping which transformsGcsinto a monodimensional weighted
net-workW. Precisely, we assign as weight of an undirected link inW the total number of interactions (SMSs and calls) between the connected users.
First, we look at how call and SMS communities cover multidimensional commu-nities. Specifically, we evaluate how multidimensional groups aggregate or split layer communities, and we implicitly highlight the value of including different dimensions.
As highlighted by Fig. 12a, call communities perform a higher coverage of a multidi-mensional community than SMS, but many of them are needed as given by the covering set cardinality in Fig. 12b and with a smaller coverage precision (see Fig. 12c). Note that, as the call graph is greater than the SMS one, a great number of call links exist also in the multidimensional communities. This way, the multidimensional communities can be covered by using a large number of call communities, but the goodness of the covering is less than that performed by SMS communities, the latter being more precise and with a better matching. These results suggest that call communities are split into different multi-dimensional communities as a consequence of the introduction of the SMS weights. The same holds for SMS communities but the phenomenon is less evident.
In order to get an insight into the mechanism underlying the structure of multidi-mensional communities and understanding whether they are driven by SMS or call communities, we perform the opposite covering procedure, i.e., we tile the call and SMS communities with the multidimensional ones. The analysis of the covering explicitly shows how the communities are broken and split by the multidimensional partitioning. As for SMS, the distributions ofν,CR, andCPreported in Fig. 13a–c remark that SMS communities are split into fewer multidimensional communities than call ones. More-over, the partial covering is more coating and precise in the SMS layer than in the call layer. So, call communities are less similar and influent to the multidimensional one w.r.t. SMS communities.
Fig. 13 Dcscovering on call/SMS/co-location. Cumulative distribution functions of the cardinality of the covering set (a), the coverage ratio (b), and the coverage precision (c) indexes. Partially covered communities only were considered
All these results lead to conclude that multidimensional communities are pivoted by SMS communities which are merged in greater multidimensional communities by means of call links, whereas SMS links bring portions of call communities into different multidimensional communities.
For further information in Fig. 13, we report the overlapping results between the multidimensional and the co-location communities. However, the same observations in the previous analysis are still true and mainly highlight the weak interplay between co-location and on-phone interaction communities.
Conclusion
represent an advance in the computational social science to offer a more complete vision of user’s interactions.
Interactions and communications have many connections and relations with how people move and visit common locations. In fact, we confirm that people interact-ing by mobile devices are more likely to be in spatial proximity w.r.t. individuals who do not interact through any mobile medium. In particular, interactions by SMSs are more predictive of spatial proximity than calls. This result could be applied to solutions for the next-location prediction problem which include features from the communication layer.
The joint study of mobility and communication networks has also highlighted that their interplay depends on the spatial granularity of the mobility traces and on the covered area. In a metropolitan area, people sharing simultaneously many places do not need to communicate since they exploit the co-presence. Otherwise, people who are scarcely in proximity complement the face-to-face interactions with the mobile phone communications. The last finding is in contrast with the results in [10] and [11] so we are going to analyze the same dependency by coarsening the spatial granularity.
Finally, we highlighted how the diversity of the layers impacts on the mesoscopic structure given by the communities which form and emerge due to the call and SMS inter-actions and the spatial closeness of the users. Specifically, we observe that communities at different layers either do not match or they barely preserve from a layer to another. The above results further highlight that at a metropolitan scale, the interplay between co-location and communication is not well defined. However, the chance to associate a spatio-temporal information to SMS and call communities may offer many applications. Besides locating in the urban space to the communication communities when possi-ble, it may be applied to improve home-work locations according to the communication patterns or to filter out “non-social” interactions.
Endnotes
1For the purpose of ensuring customer anonymity, each subscriber is identified by a
surrogate key.
2In our metropolitan environment, the average radius of a cellular cell is about 45 m.
3|(E
c∪Es)∩Eloc|/|Ec∪Es| 42|E
loc\(Ec∪Es)|/(|Vc∪Vs|(|Vc∪Vs| −1)−2|Ec∪Es|)=2×10⁻⁵ 5|E
s∩Eloc|/|Es| 6|E
c∩Eloc|/|Ec| 7τ
btakes into account ties.
8By multidimensional communities, we mean the communities computed ontoD cs 9The above algorithms extract not-overlapped communities.
Competing interests
The authors declare that they have no competing interests.
Authors’ contributions
MZ and SG conceived and executed the research; MZ and CQ analyzed the empirical data. GPR conceived and participated in the design and the coordination of the study. MZ, SG, and GPR wrote the paper. All authors read and approved the final manuscript.
References
1. Reid, D, Reid, FM: Mobile World. In: Hamill, L, Lasen, A, Diaper, D (eds.) Computer Supported Cooperative Work, pp. 105–118. Springer, London, (2005)
2. Blondel, VD, Decuyper, A, Krings, G: A survey of results on mobile phone datasets analysis (2015). arXiv preprint arXiv:1502.03406
3. Onnela, J-P, Saramäki, J, Hyvönen, J, Szabó, G, Lazer, D, Kaski, K, Kertész, J, Barabási, A-L: Structure and tie strengths in mobile communication networks. Proc. Nat. Acad. Sci.104(18), 7332–7336 (2007)
4. Hidalgo, CA, Rodriguez-Sickert, C: The dynamics of a mobile phone network. Physica A: Stat. Mech. Appl. 387(12), 3017–3024 (2008)
5. Nanavati, AA, Singh, R, Chakraborty, D, Dasgupta, K, Mukherjea, S, Das, G, Gurumurthy, S, Joshi, A: Analyzing the structure and evolution of massive telecom graphs. Knowl. Data Eng. IEEE Trans.20(5), 703–718 (2008) 6. Karsai, M, Kaski, K, Barabási, A-L, Kertész, J: Universal features of correlated bursty behaviour. Scientific Reports.
2, 397 (2012)
7. Quadri, C, Zignani, M, Capra, L, Gaito, S, Rossi, GP: Multidimensional human dynamics in mobile phone communications. PloS One.9(7), 103183 (2014)
8. Ling, R, Bertel, TF, Sundsøy, PR: The socio-demographics of texting: an analysis of traffic data. New Media Soc. 14(2), 281–298 (2012)
9. Phithakkitnukoon, S, Smoreda, Z, Olivier, P: Socio-geography of human mobility: a study using longitudinal mobile phone data. PloS One.7(6), 39253 (2012)
10. Calabrese, F, Smoreda, Z, Blondel, VD, Ratti, C: Interplay between telecommunications and face-to-face interactions: a study using mobile phone data. PloS One.6(7), 20814 (2011)
11. Wang, D, Pedreschi, D, Song, C, Giannotti, F, Barabasi, A-L: Human mobility, social ties, and link prediction. In: Proceedings of the 17th ACM SIGKDD international conference on knowledge discovery and data mining. KDD ’11. New York, NY, (2011)
12. Caughlin, TT, Ruktanonchai, N, Acevedo, MA, Lopiano, KK, Prosper, O, Eagle, N, Tatem, AJ: Place-based attributes predict community membership in a mobile phone communication network. PloS One.8(2), 56057 (2013) 13. Expert, P, Evans, TS, Blondel, VD, Lambiotte, R: Uncovering space-independent communities in spatial networks.
Proc. Nat. Acad. Sci.108(19), 7663–7668 (2011)
14. Onnela, J-P, Arbesman, S, González, MC, Barabási, A-L, Christakis, NA: Geographic constraints on social network groups. PLoS ONE.6(4), e16939 (2011)
15. D’Agostino, G, Scala, A: Networks of Networks: The last frontier of complexity. Understanding complex systems. Springer (2014). doi:10.1007/978-3-319-03518-5
16. Berlingerio, M, Coscia, M, Giannotti, F, Monreale, A, Pedreschi, D: Multidimensional networks: foundations of structural analysis. World Wide Web.16, 1–27 (2012)
17. De Domenico, M, Solé-Ribalta, A, Cozzo, E, Kivelä, M, Moreno, Y, Porter, MA, Gómez, S, Arenas, A: Mathematical formulation of multilayer networks. Phys. Rev. X.3, 041022 (2013)
18. Lambiotte, R, Blondel, VD, de Kerchove, C, Huens, E, Prieur, C, Smoreda, Z, Van Dooren, P: Geographical dispersal of mobile communication networks. Physica A: Stat. Mech. Appl.387(21), 5317–5325 (2008)
19. Zignani, M, Quadri, C, Bernadinello, S, Gaito, S, Rossi, GP: Calling and texting: social interactions in a multidimensional telecom graph. In: Proceedings of the complex networks 2014 workshop on complex networks and their applications. Complex Networks ’14. IEEE, Marrakech, (2014)
20. Gonzalez, MC, Hidalgo, CA, Barabasi, A-L: Understanding individual human mobility patterns. Nature.453, 779-782 (2008)
21. Wasserman, S, Faust, K: Social network analysis: methods and applications. Cambridge University Press (1994) 22. Clauset, A, Shalizi, CR, Newman, MEJ: Power-law distributions in empirical data. SIAM Review.51(4) (2009).
arxiv.org/pdf/0706.1062
23. Mislove, A, Marcon, M, Gummadi, KP, Druschel, P, Bhattacharjee, B: Measurement and analysis of online social networks. In: Proceedings of the 7th ACM SIGCOMM conference on Internet measurement, pp. 29–42. ACM, (2007). conferences.sigcomm.org/imc/2007/papers/imc170.pdf
24. Boccaletti, S, Bianconi, G, Criado, R, del Genio, CI, Gómez-Gardeñes, J, Romance, M, Sendiña-Nadal, I, Wang, Z, Zanin, M: The structure and dynamics of multilayer networks. Phys. Rep.544(1), 1–122 (2014)
25. Broder, A, Kumar, R, Maghoul, F, Raghavan, P, Rajagopalan, S, Stata, R, Tomkins, A, Wiener, J: Graph structure in the web. Comput. Netw.33(1), 309–320 (2000)
26. Blondel, VD, Guillaume, J-L, Lambiotte, R, Lefebvre, E: Fast unfolding of communities in large networks. J. Stat. Mech. Theory Exp.10, p10008 (2008)
27. Raghavan, UN, Albert, R, Kumara, S: Near linear time algorithm to detect community structures in large-scale networks. Phys. Rev. E.76(3), 036106 (2007)
28. Leung, I. XY, Hui, P, Liò, P, Crowcroft, J: Towards real-time community detection in large networks. Phys. Rev. E. 79, 066107 (2009)
29. Meil˘a, M: Comparing clusterings—an information-based distance. J. Multivariate Anal.98(5), 873–895 (2007) 30. Tibély, G, Kovanen, L, Karsai, M, Kaski, K, Kertész, J, Saramäki, J: Communities and beyond: mesoscopic analysis of a
large social network with complementary methods. Phys. Rev. E.83(5), 056125 (2011)
31. Mucha, PJ, Richardson, T, Macon, K, Porter, MA, Onnela, J-P: Community structure in time-dependent, multiscale, and multiplex networks. Science.328(5980), 876–878 (2010)