P R O T O C O L
Open Access
Food groups and risk of chronic disease: a
protocol for a systematic review and
network meta-analysis of cohort studies
Lukas Schwingshackl
1*, Anna Chaimani
2, Angela Bechthold
3, Khalid Iqbal
1, Marta Stelmach-Mardas
1,4,
Georg Hoffmann
5, Carolina Schwedhelm
1, Sabrina Schlesinger
6and Heiner Boeing
1Abstract
Background:There is a lack of systematic and comprehensive evaluations whether food intakes lower or increase risk of chronic diseases. In this network meta-analysis of prospective cohort studies, we aim to evaluate the effects of different foods on risk of chronic diseases.
Methods/design:We will search PubMed and EMBASE. This will be supplemented by a hand search and author
contacts. Citations, abstracts, and relevant papers will be screened for eligibility by two reviewers independently. Prospective cohort studies will be included if they meet the following criteria: (1) evaluate the association of single food or food groups with all-cause mortality, cardiovascular diseases (incidence and mortality), cancer (incidence and mortality) or risk of type 2 diabetes. The following food groups will be evaluated: whole grains, refined grains, vegetables, fruits, nuts, legumes, eggs, dairy products, fish, red meat, processed meat and sugar-sweetened
beverages; (2) include participants≥18 years of age; and (3) study population were free of outcome(s) of interest at the onset of the study. To assess study quality, we will extract the following characteristics: study size, duration of follow-up, dietary assessment method, assessment of outcome and adjustment factors. If the identified studies appear sufficiently similar within and across the different comparisons between pairs of food groups, we will estimate summary-relative effects using random effects network meta-analysis. Subgroup and meta-regression analyses will be performed stratified by different follow-up cut-points, geographical region and sex.
Discussion:This is a presentation of the study protocol only. Results and conclusions are pending completion of this study. Our systematic review will be of great value to national and international authorities for evidence-based nutritional recommendation/guidelines, regarding the implementation of food-based dietary guidelines for prevention of chronic diseases. Moreover, our results can be implemented to develop new diet quality indices/scores.
Systematic review registration:PROSPERO CRD42016037069
Keywords:Food, Diet, Network meta-analysis, Chronic disease
Background
Globally in 2013, the total number of deaths across all age groups rose to approximately 55 million. Seventy percent of these deaths were caused by non-communicable dis-eases, with cardiovascular or circulatory diseases being responsible for 32 % of the fatalities (15 % by ischemic
heart disease, 12 % by stroke and approximately 3 % by type 2 diabetes) followed by cancer mortality with 15 % [1].
In nutrition research, randomized controlled trials often address short-term interventions (evaluating many dietary hypotheses) in high risk groups with intermediate outcomes. There are only a few long-term intervention studies in nutrition research and all of them evaluating many dietary hypotheses in one trial [2–4]. Therefore, in nutrition research, well-designed prospective cohort studies are the main source of evidence to address decade long exposures populations with hard clinical endpoints * Correspondence:[email protected]
1German Institute of Human Nutrition Potsdam-Rehbruecke (DIfE),
Arthur-Scheunert-Allee 114-116, 14558 Nuthetal, Germany Full list of author information is available at the end of the article
[5]. Large prospective cohort studies have shown that 60–75 % of coronary and 36 % of cancer incidents can be explained by lifestyle factors such as unhealthy diets, overweight, obesity, physical inactivity, smoking and excessive alcohol intake [6]. According to the Global Burden of Disease Group in 2012, unhealthy diet is the leading risk factor for death and disability [7]. A high intake of alcohol, red meat, processed meat, sugar-sweetened beverages, collectively accounted for 10 % of global disability-adjusted life years in 2010 [7]. In addition, a diet low in fruits, vegetables, milk, nuts, seeds, seafood and whole grains might also contribute to risk of death and chronic diseases.
Previous pairwise meta-analyses of cohort studies showed that certain food groups such as whole grains, vegetables and fruits were associated with reduced risk of coronary heart disease, cancer, and type 2 diabetes [8–10], whereas red meat or sugar-sweetened beverages were associated with increased risk [8–10]. To the best of our knowledge, no systematic review and meta-analysis has compared simultaneously the effects of multiple dietary factors on all-cause mortality, cardiovascular disease, cancer disease and risk of type 2 diabetes. One important question that remains to be answered is which foods are associated with the most pronounced risk reduction.
Therefore our objective is to compare the impact of different foods on the risk of all-cause mortality, cardio-vascular disease, cancer and type 2 diabetes using pro-spective cohort studies. We also aim to obtain a useful relative ranking of the different foods with respect to the prevention of chronic disease.
Methods and design
The review was registered in PROSPERO International Prospective Register of Systematic Reviews (http://www.crd. york.ac.uk/PROSPERO/display_record.asp?ID=CRD4201 6037069, identifier CRD42016037069). The present system-atic review protocol was planned, conducted, and reported in adherence to standards of quality for reporting system-atic review and network meta-analysis protocols [11–14] (Additional file 1).
Eligibility criteria
Studies will be included in the meta-analysis if they meet all of the following criteria.
Types of studies
Only studies with a prospective cohort design (including prospective cohort studies, nested case-control studies, randomized controlled trials, case-cohort studies) that are peer-reviewed and available in full-text will be eligible for the present systematic review.
Types of participants
Participants aged 18 or older will be eligible. Prospective studies based on children, adolescent or pregnant women will be excluded. The sample included in final analysis had to be free of the outcome(s) (cardiovascular disease and/or, cancer, and/or type 2 diabetes) of interest at the onset of the study.
Exposure
The impact of the following twelve food groups will be evaluated: whole grains/cereals, refined grains/cereals, vegetables, fruits, nuts, legumes, eggs, dairy products (milk, cheese, yogurt), fish, red meat, processed meat and sugar-sweetened beverages. The focus will be on these 12 food groups since most diet quality indices/score were based on these [15–17].
The assessment of dietary intake is based on multidi-mensional exposures and in free-living populations these measurements are often not accurate. The most com-monly used techniques for assessing food and drink con-sumption are food frequency questionnaires, dietary record, dietary history, or 24-h recall. We will include any definition of high (e.g. third tertile, or consumers) vs. low/ reference (i.e. first tertile, or non-consumers) intake cat-egories and we intend to account for the possible impact of the different definitions in additional analyses (see the Exploration of heterogeneity and inconsistencysection).
The use of cohort studies in this systematic review makes the evaluation of transitivity challenging since the idea of ‘joint randomizability’ is not plausible in this setting [18]. However, we will assess whether transitivity is likely to hold prior to the data synthesis following the strategy described in the section Assessment of the tran-sitivity assumption.
Geometry of the network
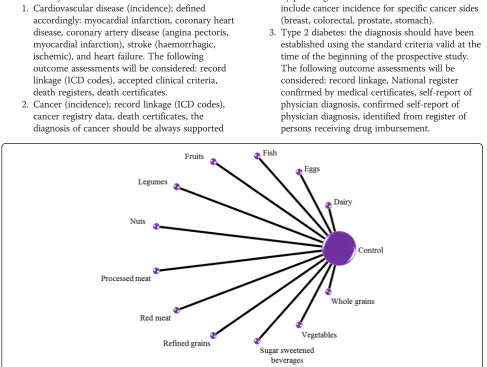
We do not expect to identify studies directly comparing two or more different food groups. Nevertheless, if such studies that meet the eligibility criteria will be identified, we will include them in the network. Figure 1 shows the network of all possible pairwise comparisons between the eligible dietary factors, and Fig. 2 shows a ‘star net-work’ between the different dietary factors and control; we expect that the structure of our final network will be close to Fig. 2.
Outcome measures
We will consider the following outcomes:
Primary outcome
Secondary outcomes
1. Cardiovascular disease (incidence); defined accordingly: myocardial infarction, coronary heart disease, coronary artery disease (angina pectoris, myocardial infarction), stroke (haemorrhagic, ischemic), and heart failure. The following outcome assessments will be considered: record linkage (ICD codes), accepted clinical criteria, death registers, death certificates.
2. Cancer (incidence); record linkage (ICD codes), cancer registry data, death certificates, the diagnosis of cancer should be always supported
by pathological examination of tissues. We will include cancer incidence for specific cancer sides (breast, colorectal, prostate, stomach).
3. Type 2 diabetes: the diagnosis should have been established using the standard criteria valid at the time of the beginning of the prospective study. The following outcome assessments will be considered: record linkage, National register confirmed by medical certificates, self-report of physician diagnosis, confirmed self-report of physician diagnosis, identified from register of persons receiving drug imbursement.
Fig. 2Star network of the comparisons between every eligible dietary factor and control
Search strategy
The search strategy was developed by LS, SS and HB, and will be performed by LS, AB, MSM and KI, and dif-ferences resolved by discussion with a third reviewer (HB). We will conduct searches in PubMed (from 1966) and EMBASE (from 1980). We will search for articles of original research by using the following search terms:
#1 food and beverages [MeSH Terms]
#2 food*[tiab] OR whole grain*[tiab] OR refined grain*[tiab] OR cereal*[tiab] OR pasta*[tiab] OR rice*[tiab] OR potato*[tiab] OR vegetable*[tiab] OR fruit*[tiab] OR nut*[tiab] OR legume*[tiab] OR bean*[tiab] OR egg*[tiab] OR dairy[tiab] OR dairies[tiab] OR milk[tiab] OR yogurt[tiab] OR cheese[tiab] OR fish[tiab] OR seafood[tiab] OR meat[tiab] OR processed meat[tiab] OR sugar sweetened beverage*[tiab]
#3 mortality OR incidence OR cardiovascular OR coronary OR stroke OR cancer OR neoplasm OR neoplastic disease OR diabetes OR vascular OR myocardial infarction
#4 prospective OR follow-up OR cohort OR longitudinal
#5 (#1 OR #2) AND #3 AND #4
Moreover, the reference lists from the retrieved arti-cles; systematic reviews and meta-analyses will be checked to search for further relevant studies (umbrella review of systematic review and meta-analyses). There will be no restrictions on language or publication year. Studies published in languages other than English will be translated by international scientists in our institute.
Study selection process
Two reviewers will independently screen titles and abstracts of all the retrieved bibliographic records. Full texts of all potentially eligible records passing the title and abstract screening level will be retrieved and exam-ined independently by two reviewers (for each database) with the abovementioned eligibility criteria/exclusion criteria [19, 20]. Disagreements will be resolved by consensus or adjudication of another reviewer. A flow diagram will outline the study selection process and rea-sons for exclusions (full-text). When a study was pub-lished in duplicate, we will include the version containing the most comprehensive information (latest information in the case of follow-up studies).
Data extraction
After determination of the study selection, two reviewers will extract independently the following characteristics: the first author’s last name, year of publication, study origin, cohort name, sample size, number of cases, age
at entry, sex, study length (follow-up in years), outcome, outcome assessment, assessment of diet, quantity of diet, risk estimate (most adjusted measures) (hazard ratios (HR), risk ratios (RR) or odds ratios (OR) with their corresponding 95 % confidence intervals (CIs)) and ad-justment factors using our own checklist (piloting of the tool based on three studies will be performed).
When a study provides several risk estimates, the multivariate adjusted model will be chosen. If only sep-arate risk estimates for male and female participants will be available in one study, data will be pooled and treated as one study.
Risk of bias assessment
To assess the risk of bias of the cohort studies, we will as-sess ascertainment of exposure (e.g. validated, calibrated FFQ, 24 h recall/diet history/diet records for multiple days will be judged as low risk of bias; whereas un-validated FFQ, single 24 h recall/diet records/diet history will be judged as high risk of bias studies), assessment of outcome (e.g. record linkage according ICD codes, accepted clinical criteria, independent or blind assessment will be judged as low risk of bias; whereas self-reported not validated assessment will be judged as high risk of bias studies), ad-equacy of follow-up depending on the outcome (e.g. strati-fied by the median duration of follow-up: e.g. ≥10 years for CVD will be judged as low risk of bias; whereas <10 years for CVD will be judged as high risk of bias), and adjusted basic model and outcome relevant adjustments (e.g. adjustment for the most important factors: sex, age, education, smoking and physical activity, BMI will be judged as low risk of bias studies; whereas low number of adjustments will be judged as high risk of bias), based on our own developed tool [21]. Studies will be classified as being at low risk of bias in general only if none of the domains established a high risk of bias, and at moderate overall risk of bias if they were at high risk for one domain only. In all other cases, studies were classified as being overall at high risk of bias.
Dealing with missing data
We will try to obtain relevant missing data from authors of the included cohort studies (by e-mail). If we will not be able to obtain the missing data we will exclude the cohort from the network meta-analysis (NMA). We do not expect high missing data rate, since this phenomenon is not common in meta-analysis of observational studies [15, 18, 22].
Evaluation of synthesis assumptions and statistical analysis
Description of the available data
and some important variables (e.g. age, length of follow-up, outcome relevant baseline risk factors, etc.) for each pairwise comparison. We will present the available direct comparisons between different food groups and control using a network diagram for each outcome [23]. The size of the nodes will be proportional to the sample size/ number of cases exposed to each dietary factor and the thickness of the lines proportional to the inverse vari-ance of the respective direct relative effects. We will also use the contribution matrix to identify the direct com-parisons with greater influence in the network relative effects [23, 24].
Standard pairwise meta-analyses
We will perform three types of analysis:
1. High vs. low intake meta-analyses: summary risk will be estimated for high versus low intake of single food or food groups and risk of chronic diseases by applying random effect models.
2. Dose-response meta-analyses: we will investigate the association between intake of dietary factors as a continuous variable and risk of chronic diseases, by performing a dose-response meta-analysis as described by Orsini et al. and Greenland and Longnecker [25,26]. This method requires for at least three exposure categories: the quantified exposure value and the RRs with the respective 95 % CI, as well as the number of cases and person-years. If studies did not report on distribution of person-years in single categories, but provided information on number of cases and total person-years/ or number of total participants plus follow-up period, we will estimate the missing information as previously described [27,28].
3. Non-linear dose-response relation: in addition, we will explore whether there is indication for a non-linear dose-response relation between dietary factors and chronic diseases. We will perform cubic spline regression models and evaluate non-linearity by using a likelihood ratio test [29].
To explore heterogeneity between studies, we will use the Q test and theI2 statistic (with a value of I2>50 % considered to represent potentially important heterogen-eity [30]). In addition, to identify potential sources of heterogeneity, we will stratify the meta-analysis by sub-groups (age, length of follow-up, dietary assessment method) and use meta-regression analysis.
Assessment of the transitivity assumption
Transitivity is the fundamental assumption of indirect comparisons and network meta-analysis, and its violation
threatens the validity of the findings obtained from a network of studies. Our inference about the plausibility of transitivity will be based on the following criteria:
We will assess the similarity and comparability of each dietary factor as well as for the control/ reference groups when they appear in different studies. For example, we will assess whether discrepancies in amount of intake or definition of exposure of the same foods across studies are likely to render some nodes in the network intransitive.
We will assess whether the potential effect modifiers (see theData Extractionsection) are similarly distributed across the available direct comparisons in the network.
Network meta-analysis
If the identified studies appear to be sufficiently similar with respect to the effect modifiers and transitivity is likely be plausible, we will perform a random effects network meta-analysis for each outcome to estimate all possible pairwise relative effects and obtain a clinically meaningful relative ranking of the different food groups. We will use contrast-level data (HRs, RRs or ORs separ-ately) as we do not expect arm-level data to be available. We will account for the correlation in studies with mul-tiple dietary groups when the required data are available to obtain the covariance of the effect sizes from such studies. If we will not be able to obtain these covari-ances, we will treat the effect sizes from these studies as independent and we will assume different correlation values in a sensitivity analysis. We will present summary HRs, RRs or ORs in a league table. We will also estimate the relative ranking of the different food groups for each outcome using the distribution of the ranking probabil-ities and the surface under the cumulative ranking curves (SUCRA) [31]. For each outcome, we will assume a common network-specific heterogeneity parameter and we will estimate the predictive intervals to assess how much this heterogeneity affects the relative effects with respect to the additional uncertainty anticipated in future studies [32].
Assessment of inconsistency
network. For this purpose, we will use the design-by-treatment interaction model and theI2 statistic [36, 37].
Exploration of heterogeneity and inconsistency
In the presence of important heterogeneity and/or incon-sistency, we will explore the possible sources. If sufficient data will be available, we will run network meta-regression analyses to account for differences by duration of follow-up of the studies, sex, dietary assessment method, level of physical activity, body mass index, smoking status and outcome relevant baseline risk factors (e.g. blood pressure, dyslipidemia).
Small-study effects and publication bias
We will use the comparison-adjusted funnel plot [23] to assess the presence of small-study effects in the network and contour-enhanced funnel plots [38] to investigate whether funnel plot asymmetry is likely to be explained by publication bias. We will also run network meta-regression models that account for differences in the rela-tive effects between smaller and larger studies [39].
Sensitivity analyses
We will assess the sensitivity of results for the primary outcome by analysing only studies considered being at low risk of bias.
Implementation and software
We will fit all analyses described in a frequentist frame-work using Stata [40] (network package [41]), and we will produce presentation tools with thenetwork graphs package [42].
Quality of the evidence
We will first use our recently developed NutriGrade-tool to evaluate and judge the meta-evidence for pairwise comparisons, which has been especially developed for nutrition research to address specific requirements for this research field [21]. Then, to infer about the quality of evidence from the network meta-analysis will com-bine our judgment about the direct comparisons with their contributions in the estimation within the network as described in Salanti et al. [33].
Discussion
This systematic review and network meta-analysis will be the first to summarize and compare the effects of dif-ferent foods or food groups on all-cause mortality, car-diovascular disease, type 2 diabetes and cancer, using both direct and indirect evidence. This analysis will show which foods or food groups, if any, might be the most promising in the prevention of chronic diseases. Our systematic review will be of great value to national
and international authorities for evidence-based nutri-tional recommendation/guidelines, regarding the pre-vention of chronic diseases. Moreover, our results can be implemented to develop new diet quality indices/ scores.
Additional file
Additional file 1:PRISMA-P checklist. (DOC 82 kb)
Acknowledgements
Not applicable.
Funding
No funding to declare.
Availability data and materials
Not applicable.
Authors’contributions
LS, AC, SS, KI, GH, HB and MSM contributed to the conception and design of the systematic review and meta-analysis. LS, AC, AB, SS, KI, GH, CS, MSM and HB will be involved in the acquisition and analysis of the data. LS, AC, AB, KI, GH, CS, MSM and HB will interpret the results. LS, AC, AB, SS, KI, GH, CS, MSM and HB drafted this protocol. All authors provided critical revisions of the protocol and approved submission of the final manuscript.
Authors’information
Not applicable.
Competing interests
The authors declare that they have no competing interests.
Consent for publication
Not applicable.
Ethics approval and consent to participate
Not applicable
Author details
1
German Institute of Human Nutrition Potsdam-Rehbruecke (DIfE), Arthur-Scheunert-Allee 114-116, 14558 Nuthetal, Germany.2Department of
Hygiene and Epidemiology University of Ioannina School of Medicine, Medical School Campus, University of Ioannina, Ioannina 45110, Greece.
3
German Nutrition Society, Godesberger Allee 18, 53175 Bonn, Germany.
4Department of Pediatric Gastroenterology and Metabolic Diseases, Poznan
University of Medical Sciences, Szpitalna 27/33, 60-537 Poznan, Poland.
5Department of Nutritional Sciences, University of Vienna, Althanstraße 14,
UZA II, 1090 Vienna, Austria.6Department of Epidemiology and Biostatistics, School of Public Health, Imperial College London, St. Mary’s Campus, Norfolk Place, Paddington, London W2 1PG, UK.
Received: 6 April 2016 Accepted: 18 July 2016
References
1. GBD 2013 Mortality and Causes of Death Collaborators. Global, regional, and national age-sex specific all-cause and cause-specific mortality for 240 causes of death, 1990–2013: a systematic analysis for the Global Burden of Disease Study 2013. Lancet. 2015;385(9963):117–171.
2. Howard BV, Manson JE, Stefanick ML, Beresford SA, Frank G, Jones B, Rodabough RJ, Snetselaar L, Thomson C, Tinker L, et al. Low-fat dietary pattern and weight change over 7 years: the Women’s Health Initiative Dietary Modification Trial. JAMA. 2006;295(1):39–49.
4. de Lorgeril M, Renaud S, Mamelle N, Salen P, Martin JL, Monjaud I, Guidollet J, Touboul P, Delaye J. Mediterranean alpha-linolenic acid-rich diet in secondary prevention of coronary heart disease. Lancet. 1994;343(8911):1454–9.
5. Satija A, Yu E, Willett WC, Hu FB. Understanding nutritional epidemiology and its role in policy. Adv Nutr. 2015;6(1):5–18.
6. Ford ES, Bergmann MM, Kroger J, Schienkiewitz A, Weikert C, Boeing H. Healthy living is the best revenge: findings from the European Prospective Investigation into Cancer and Nutrition-Potsdam study. Arch Intern Med. 2009;169(15):1355–62.
7. Lim SS, Vos T, Flaxman AD, Danaei G, Shibuya K, Adair-Rohani H, Amann M, Anderson HR, Andrews KG, Aryee M, et al. A comparative risk assessment of burden of disease and injury attributable to 67 risk factors and risk factor clusters in 21 regions, 1990-2010: a systematic analysis for the Global Burden of Disease Study 2010. Lancet. 2012;380(9859):2224–60. 8. Mente A, de Koning L, Shannon HS, Anand SS. A systematic review of the
evidence supporting a causal link between dietary factors and coronary heart disease. Arch Intern Med. 2009;169(7):659–69.
9. Anand SS, Hawkes C, de Souza RJ, Mente A, Dehghan M, Nugent R, Zulyniak MA, Weis T, Bernstein AM, Krauss RM, et al. Food consumption and its impact on cardiovascular disease: importance of solutions focused on the globalized food system: a report from the workshop convened by the world heart federation. J Am Coll Cardiol. 2015;66(14):1590–614.
10. Fardet A, Boirie Y. Associations between food and beverage groups and major diet-related chronic diseases: an exhaustive review of pooled/ meta-analyses and systematic reviews. Nutr Rev. 2014;72(12):741–62. 11. Moher D, Shamseer L, Clarke M, Ghersi D, Liberati A, Petticrew M, Shekelle P,
Stewart LA, Group P-P. Preferred reporting items for systematic review and meta-analysis protocols (PRISMA-P) 2015 statement. Syst Rev. 2015;4(1):1. 12. Shamseer L, Moher D, Clarke M, Ghersi D, Liberati AD, Petticrew M, Shekelle
P, Stewart LA, the P-PG. Preferred reporting items for systematic review and meta-analysis protocols (PRISMA-P) 2015: elaboration and explanation. BMJ. 2015;349:g7647.
13. Hutton B, Salanti G, Caldwell DM, Chaimani A, Schmid CH, Cameron C, Ioannidis JP, Straus S, Thorlund K, Jansen JP, et al. The PRISMA extension statement for reporting of systematic reviews incorporating network meta-analyses of health care interventions: checklist and explanations. Ann Intern Med. 2015;162(11):777–84.
14. Chaimani A, Salanti G. Available from: http://methods.cochrane.org/cmi/ comparing-multiple-interventions-cochrane-reviews (accessed: 20.01.2016). 15. Schwingshackl L, Hoffmann G. Adherence to Mediterranean diet and risk of
cancer: an updated systematic review and meta-analysis of observational studies. Cancer Med. 2015;4(12):1933–1947.
16. Schwingshackl L, Hoffmann G. Diet quality as assessed by the healthy eating index, the alternate healthy eating index, the dietary approaches to stop hypertension score, and health outcomes: a systematic review and meta-analysis of cohort studies. J Acad Nutr Diet. 2015;115(5):780–800. e785. 17. Schwingshackl L, Missbach B, Konig J, Hoffmann G. Adherence to a
Mediterranean diet and risk of diabetes: a systematic review and meta-analysis. Public Health Nutr. 2015;18(7):1292–9.
18. Schwingshackl L, Hoffmann G. Adherence to Mediterranean diet and risk of cancer: a systematic review and meta-analysis of observational studies. Int J Cancer. 2014;135(8):1884–97.
19. Liberati A, Altman DG, Tetzlaff J, Mulrow C, Gotzsche PC, Ioannidis JP, Clarke M, Devereaux PJ, Kleijnen J, Moher D. The PRISMA statement for reporting systematic reviews and meta-analyses of studies that evaluate healthcare interventions: explanation and elaboration. BMJ. 2009;339:b2700.
20. Moher D, Liberati A, Tetzlaff J, Altman DG. Preferred reporting items for systematic reviews and meta-analyses: the PRISMA statement. PLoS Med. 2009;6(7):e1000097.
21. Schwingshackl L, Knüppel S, Schwedhelm C, Hoffmann G, Missbach B, Stelmach-Mardas M, Dietrich S, Eichelmann F, Kontopanteils E, Iqbal K, et al. NutriGrade: a scoring system to assess and judge the meta-evidence of randomized controlled trials and cohort studies in nutrition research. Adv Nutr. 2016.
22. Schwingshackl L, Hoffmann G, Kalle-Uhlmann T, Arregui M, Buijsse B, Boeing H. Fruit and vegetable consumption and changes in anthropometric variables in adult populations: a systematic review and meta-analysis of prospective cohort studies. PLoS One. 2015;10(10):e0140846.
23. Chaimani A, Higgins JP, Mavridis D, Spyridonos P, Salanti G. Graphical tools for network meta-analysis in STATA. PLoS One. 2013;8(10):e76654. 24. Krahn U, Binder H, Konig J. A graphical tool for locating inconsistency in
network meta-analyses. BMC Med Res Methodol. 2013;13:35. 25. Greenland S, Longnecker MP. Methods for trend estimation from
summarized dose-response data, with applications to meta-analysis. Am J Epidemiol. 1992;135(11):1301–9.
26. Orsini N, Bellocco R, Greenland S. Generalized least squares for trend estimation of summarized dose-response data. Stata J. 2006;6(1):40–57. 27. Chene G, Thompson SG. Methods for summarizing the risk associations of
quantitative variables in epidemiologic studies in a consistent form. Am J Epidemiol. 1996;144(6):610–21.
28. Aune D, Greenwood DC, Chan DS, Vieira R, Vieira AR, Navarro Rosenblatt DA, Cade JE, Burley VJ, Norat T. Body mass index, abdominal fatness and pancreatic cancer risk: a systematic review and non-linear dose-response meta-analysis of prospective studies. Ann Oncol. 2012;23(4):843–52. 29. Durrleman S, Simon R. Flexible regression models with cubic splines.
Stat Med. 1989;8(5):551–61.
30. Higgins JP, Thompson SG. Quantifying heterogeneity in a meta-analysis. Stat Med. 2002;21(11):1539–58.
31. Salanti G, Ades AE, Ioannidis JP. Graphical methods and numerical summaries for presenting results from multiple-treatment meta-analysis: an overview and tutorial. J Clin Epidemiol. 2011;64(2):163–71.
32. Riley RD, Higgins JP, Deeks JJ. Interpretation of random effects meta-analyses. BMJ. 2011;342:d549.
33. Salanti G, Del Giovane C, Chaimani A, Caldwell DM, Higgins JP.
Evaluating the quality of evidence from a network meta-analysis. PLoS One. 2014;9(7):e99682.
34. Bucher HC, Guyatt GH, Griffith LE, Walter SD. The results of direct and indirect treatment comparisons in meta-analysis of randomized controlled trials. J Clin Epidemiol. 1997;50(6):683–91.
35. Dias S, Welton NJ, Caldwell DM, Ades AE. Checking consistency in mixed treatment comparison meta-analysis. Stat Med. 2010;29(7-8):932–44. 36. Higgins JP, Jackson D, Barrett JK, Lu G, Ades AE, White IR. Consistency and
inconsistency in network meta-analysis: concepts and models for multi-arm studies. Res Synth Methods. 2012;3(2):98–110.
37. Jackson D, Barrett JK, Rice S, White IR, Higgins JP. A design-by-treatment interaction model for network meta-analysis with random inconsistency effects. Stat Med. 2014;33(21):3639–54.
38. Peters JL, Sutton AJ, Jones DR, Abrams KR, Rushton L. Contour-enhanced meta-analysis funnel plots help distinguish publication bias from other causes of asymmetry. J Clin Epidemiol. 2008;61(10):991–6.
39. Chaimani A, Salanti G. Using network meta-analysis to evaluate the existence of small-study effects in a network of interventions. Res Synth Methods. 2012;3(2):161–76.
40. StataCorp. Stata Statistical Software: Release 14. College Station: StataCorp LP; 2015.
41. White IR. Network meta-analysis. Stata J. 2015;15(4):951–985. 42. Chaimani, Salanti. Visualizing assumptions and results in network
meta-analysis: the network graphs package. Stata J. 2015;15(4):905-950.
• We accept pre-submission inquiries
• Our selector tool helps you to find the most relevant journal • We provide round the clock customer support
• Convenient online submission • Thorough peer review
• Inclusion in PubMed and all major indexing services • Maximum visibility for your research
Submit your manuscript at www.biomedcentral.com/submit