© 2016 Sanaul Mustafa and V. Kusum Devi. This is an open access article distributed under the terms of the Creative Commons Attribution License -NonCommercial-ShareAlikeUnported License (http://creativecommons.org/licenses/by-nc-sa/3.0/).
Journal of Applied Pharmaceutical Science Vol. 6 (08), pp. 057-066, August, 2016 Available online at http://www.japsonline.com
DOI: 10.7324/JAPS.2016.60809 ISSN 2231-3354
Liquid Chromatographic Assay for the Analysis of Kanamycin
sulphate nanoparticles in Rat after intramuscular administration:
Application to a Pharmacokinetic Study
Sanaul Mustafa, V. Kusum Devi
*Pharmaceutics Division, Faculty of Pharmacy, Al-Ameen College of Pharmacy, Bangalore 560027, Karnataka, India.
ARTICLE INFO ABSTRACT
Article history: Received on: 15/05/2016 Revised on: 04/06/2016 Accepted on: 19/06/2016 Available online: 30/08/2016
A rapid reversed-phase high performance liquid chromatography (RP-HPLC) method was developed for the determination of Kanamycin sulphate (KS) in PLGA nanoparticle formulation. A new formulation of KS loaded PLGA nanoparticles (NPs) was prepared by double (multiple) emulsion process in our laboratory. The desired chromatographic separation was achieved on a Phenomenex C18column under isocratic conditions using UV
detection at 205 nm. The optimized mobile phase consisted of a mixture of 0.1 M disodium tetraborate (pH 9.0) and water (25:75, v/v) supplemented with 0.5 g/L sodium octanesulphonate at a flow rate of 1 mL/min. The linear regression analysis for the calibration curves showed a good linear correlation over the concentration range of 120-840µg/ml, with correlation coefficients of (r2 0.9997). The system was found to construct sharp peaks for KS and IS with retention times of 4.08 and 5.49 min, respectively. Transmission electron microscopy studies on MFX NPs demonstrated particle size < 100 nm. An average encapsulation efficiency of 74.34% was obtained for NPs. In vitro studies showed zero-order release and about 95% drug being released within 12 days in PBS (pH 7.4). In conclusion, the proposed optimized method was successfully applied for the determination of in vitro and in vivo release studies of KS NPs.
Key words:
High-performance liquid chromatography, Kanamycin sulphate, Nanoparticles, Transmission electron microscopy, Pharmacokinetic study.
INTRODUCTION
KS is an aminoglycoside antibiotic which is produced by fermentation of Streptomyces kanamyceticus and is used as sulphate salt (Ogawa et al., 1959; Rothrock et al., 2010). KS is used as a second-line drug for the treatment of Multi drug resistance tuberculosis (MDR-TB) (Rybak et al., 2007). KS has a very short plasma half-life (2.5 h). In adults, KS recommended therapeutic dose is 15 mg/kg/day in equally divided intervals (Mustafa et al., 2015). KS is used in high concentrations to reach the therapeutic levels in plasma and tissue, which results in serious ototoxicity/nephrotoxicity, and acquisition of KS resistance-TB (Doluisio et al., 1973; Jain et al., 2012; Selimoglu
et al., 2003). Till date, KS has been formulated as transdermal patch (Lopez-Cervantes et al., 2009), Freeze dried microparticles
* Corresponding Author Email: [email protected]
for inhalation (Jae-Young et al., 2010), and gold nanoparticles (Kyung-Mi et al., 2011).In order to fully characterize KS formulations or delivery systems such as polymeric NPs, suitable and validated quantification methods are required to assess critical pharmaceutical characterization such as drug content, encapsulation efficiency, in vitro drug release, and in vivo
absorption studies.
A literature survey reveals several analytical methods are available for the determination of KSin bulk drug,
Analysis of KS by CE in drug substances and serum has also been attempted (Kaale et al., 2001; Kaale et al., 2003; Holzgrabe et al., 2008), but selectivity and precision are rather poor compared to LC. Detection systems based on conductivity (Claes et al., 1973), colorimetry after derivatization with ninhydrin (Inouye et al., 1964), UV spectrophotometry after precolumn or precapillary derivatization (Longa et al., 2003; Gambardella et al., 1985; Kaale et al., 2001),and UV detection after in capillary derivatization have been described (Kaale et al., 2003; Holzgrabe
et al., 2008).
These derivatization methods have proved to be tedious, time consuming and not always free of toxic side effects. They also may lead to reaction incompleteness and to formation of
reaction by-products which will lead to difficulties in quantitation. For the sake of simplicity, low cost and correct
quantitation, direct detection methods are preferred. A validated
RPHPLC method for the estimation of KS was not appropriate for detection of low KS concentration. In this method,
the retention time was more than 6.341 min (Blanchaert et al., 2013).
A response surface methodology (RSM) approach was used to identify the optimum conditions for analysis during method development (Singh et al., 2012; Negi et al., 2015). Equation (1) represents a linear second-order model that describes a twisted plane with curvature, arising from the quadratic terms as follows:
y = b0+ bx1 + bx2 + b12x1x2 + b11x1 2
+ b22x2 2
(1)
Where is the experimental response to be optimized, b0is a
constant term and b1-b5are coefficients of the linear terms,x1,
x2represent the main effect, x1 2
,x2 2
are the quadratic effect, and x1x2are the interaction effect. Data were analyzed by nonlinear
estimation using Design Expert software 7.0.
In order to fully characterize the KSNPs formulation, a suitable and validated method is required for a critical assessment of pharmaceutical parameters such as drug content, encapsulation efficiency, and in vitro and in vivo release performance. Literature review reveals that HPLC methods have been reported for the quantitation of KS and bioanalytical methods is also reported (Kaale et al., 2003; Blanchaert et al., 2013).To the best of our knowledge, the use of liquid chromatographic technique for the determination of KSNPs in vivo, after intramuscular administration in rat plasma has not been demonstrated.
The purpose of the present study was to develop and validate a simple and time-saving RP-HPLC method with UV detection for the determination of KS. The validated method was applied to quantify the content of KS incorporated into the PLGA NPs after preparation. This is the first comprehensive study to investigate the content in in vitro and in vivo release of KSNPs by using optimized HPLC method. The method was validated according to Food and Drug Administration (FDA) and International Conference on Harmonization (ICH) guidelines (FDA, Guidance for Industry 2001; ICH, Guidance for industry
2003) (FDA, Guidance for Industry 2001; ICH, Guidance for industry 2005). Tobramycin (50 µg/mL) was used as an internal standard (IS).
EXPERIMENTAL
Materials and Methods
KS and tobramycin (Figure 1 (b)) (99.8%w/w and 98.7%w/w, HPLC) were provided ex-gratis by M/S Karnataka antibiotics, Bangalore, India. HPLC grade disodium tetraborate and sodium octanesulphonate was purchased from SD Fine-Chem Limited (Mumbai, India). Poly (lactic-co-glycolic acid) in a 50: 50 molar ratio (M.W 14,500Da) was received as gift sample from M/s Boehringer Ingelheim Pharma GmbH & Co. KG, Germany. Cetrimide was purchased from M/s Sigma-Aldrich (Mumbai, India).
OH O O H2N
O O
NH2
HO
HO
H2N OH
OH
OH
OHO
NH2 S
O OH
HO
a
OH
O O
H2N NH2
O O
CH2OH
OH NH2
HO
NH2
HO
CH2NH2
b
Fig. 1: Chemical structure of Kanamycin sulphate (a) and tobramycin (b)
Instrumentation and Chromatographic Conditions
HPLC (Shimadzu, Kyoto, Japan) instrument was equipped with two LC-10 ATVP pumps, SPD-10AVP UV-vis detector, Rheodyne injector with a 50 µL loop. The column used for the analysis was a Phenomenex C18 (250mm × 4.6mm I.D., 5
µm) column, supported with a Security Guard cartridge Phenomenex (Torrance, USA), with 3.0mm internal diameter, in an oven at a temperature of 50∘C. Chromatographic analysis was conducted in isocratic mode. The detection was carried out at 205 nm. An injection volume of 20µL was used for all standards and samples.
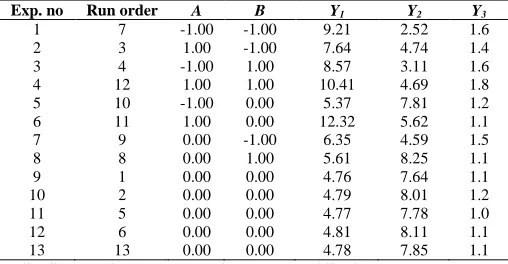
analysis time and maximize the peak resolution and optimal peak asymmetry of the developed method. Taguchi A orthogonal array design was employed in preliminary experiments to screen the most appropriate parameters. Furthermore, CCD was selected to determine the best experimental conditions in RP-HPLC. Thirteen experiments were conducted using the levels described in Table 1 and conditions described in Table 2. Minimum and maximum values for concentration of disodium tetraborate (A) were selected as 20% and 40%, respectively. Likewise, minimum and maximum contents of buffer pH (B) were fixed as 2.5 and 4.0, respectively. Retention times (Y1), peak resolution (Y2), and peak asymmetry
(Y3) were the responses for these studies.
Table 1: Independent variables, dependent variables, and levels of the face centered central composite design.
Factor Levels
Independent Symbol
(-1)
(0) (1)
Disodium tetraborate concentration (%) A 20 30 40
Mobile phase pH B 2.5 3.5 4.0
Dependent
Retention time Y1
Peak Resolution Y2
Peak Asymmetry Y3
Table 2: Experimental conditions according to the central composite design and observed response values.
Exp. no Run order A B Y1 Y2 Y3
1 7 -1.00 -1.00 9.21 2.52 1.6
2 3 1.00 -1.00 7.64 4.74 1.4
3 4 -1.00 1.00 8.57 3.11 1.6
4 12 1.00 1.00 10.41 4.69 1.8
5 10 -1.00 0.00 5.37 7.81 1.2
6 11 1.00 0.00 12.32 5.62 1.1
7 9 0.00 -1.00 6.35 4.59 1.5
8 8 0.00 1.00 5.61 8.25 1.1
9 1 0.00 0.00 4.76 7.64 1.1
10 2 0.00 0.00 4.79 8.01 1.2
11 5 0.00 0.00 4.77 7.78 1.0
12 6 0.00 0.00 4.81 8.11 1.1
13 13 0.00 0.00 4.78 7.85 1.1
A: disodium tetraborate concentration (%); B: mobile phase pH. Y1: retention times; Y2: peak resolution; Y3: peak asymmetry.
Preparation of Calibration Curve (CC) and Quality Control Samples (QC)
Eight-point calibration curve (CC) was prepared by serial dilution of KS stock solution (1mg/mL) in the range of 120, 240, 360, 480, 600,720 and 840µg/mL obtained by measuring the required amount of 1000 µg/mL working standard solution, mixing with a sufficient quantity of mobile phase, and making up to 10mL.
Calibration standards were prepared daily by spiking 0.1mL of blank plasma with 10 µL of the appropriate working solution resulting in concentrations of 120, 240, 360, 480, 600,720 and 840µg/mL. Stock solution (50µg/mL) of tobramycin (IS) in methanol was prepared and stored at -20∘C. The stock and standard solutions were prepared on a daily basis and stored in the dark at about 5∘C. All solutions were used on the day they were prepared.
For the determination of the limit of detection (LOD) and limit of quantitation (LOQ) of the method, six standard solutions, between 60 and 120µg/mL, were obtained from the 500µg/mL working solution. All stock solutions were stored at -20∘C and working solutions were freshly prepared each day.
Sample Preparation
To a 100µL of rat plasma, 10µL of IS and 150µL of KS were added and the mixture was incubated at 37∘C for 1 h. KS was then extracted using 100µL of acetonitrile (liquid-liquid extraction; LLE) followed by vortexing for 2min. After vortexing, the samples were subjected to centrifuge at 12,000 ×g for 15min. The supernatant was decanted into a China dish and evaporated to dryness at room temperature. Dry sample was reconstituted in the mobile phase and subjected to HPLC for analysis.
Method Validation
The parameters considered for the validation included selectivity and specificity, linearity, accuracy, precision, recovery, limits of detection and quantitation, system suitability, and stability.
System Suitability Tests
The system suitability parameters were determined by injecting six times the standard solution containing KS at concentration of 600 µg/mL. The capacity factor (K′), resolution (R), tailing factor (T), theoretical plate number (N), and resolution for the two drug peaks were the constraints tested on a combination solution containing 600 µg/mL of KS and 50 µg/mL of IS.
Limits of Detection and Quantification
The limits of detection and quantitation were determined from six standard solutions (60, 70, 80, 90, 100, and 120µg/mL). LOD and LOQ were calculated according to LOD = 3.3 /S and LOQ = 10 /S, where is the standard deviation of the response and S is the slope of the calibration curve.
Linearity
Calibration curves were constructed with eight standard solutions, containing the two compounds simultaneously, ranging from 120to 840µg/mL. Linearity was determined through the calculation of a regression line by the method of least squares, representing the peak areaas a function of the standard concentration.
Accuracy and Precision
lower limit of quantitation, where it should not exceed20% (Mostafavi et al., 2009). The accuracy was determined by measuring six replicates of the four quality controls and by calculating the percentage of bias for each compound according to the equation % accuracy = (observed concentration/nominal concentration) × 100.The mean value should be within 15% of the actual value, except at the LOQ, where it should not deviate by more than 20% (Xiong et al., 2009).
METHOD APPLICABILITY
Preparation of KS Loaded PLGA NPs
KSNPs were prepared by double (multiple) emulsion process employing Ultra Turrax IKAT25 digital high shear homogenizer. First, an appropriate amount of KS was dissolved in 30mL of aqueous phase and then this drug solution was added to organic phase (50mL) consisting of PLGA solution in dichloromethane with vigorous stirring to yield a water-in-oil emulsion. Next, the water-in-oil primary emulsion was added to 30mL of (0.3%) cetrimide aqueous solution using high shear homogenizer at 16,000 rpm for 30 min, to yield a water-in-oil-in-water (w/o/w) emulsion. The formed nanosuspension was centrifuged at 16,000 ×g for 1 h, at 4∘C. The NPs were then lyophilized and stored at 4°C until further analysis. Blank NPs were prepared following the above method without inclusion of KS.
Particle Size (Dnm), Polydispersity Index (PDI), and Zeta (ζ) Potential Measurements
The Dnm and PDI of the KSNPs were determined using Malvern Zetasizer NanoS90 (Malvern Instruments Ltd., Worcestershire, U.K) and the zeta potential was measured using Malvern Zetasizer Nano ZS (Malvern Instruments Ltd., Worcestershire, UK).Samples were diluted in Milli-Qwater before measurement.
Transmission electron microscopy
The morphology of the KS-loaded PLGA NPs was observed using transmission electron microscope (TEM) attached with a mega view II digital camera (H 7500, Hitachi, Tokyo, Japan). A drop of sample diluted with water was placed on a copper grid and the excess was drawn off with a filter paper. Samples were subsequently stained with 2% of uranyl acetate solution for 30 s. The image was magnified and focused on a layer of photographic film (Kim et al., 2015).
Determination of Encapsulation Efficiency
The encapsulation efficiency was determined by the separation of drug-loaded MPs from the aqueous medium containing non-associated KS by ultracentrifugation (REMI high speed, cooling centrifuge, REMI Corporation, India) at 15,000 × g for 30 min, at 4ºC. The un-encapsulated KS was determined using HPLC. The total drug content in the KS MPs was determined by dissolving the KS MPs in methanol to release trapped KS. The
resulting solution was analyzed using HPLC. The drug loading content was the ratio of incorporated drug to polymer (w/w).
In Vitro Drug Release Studies
Dissolution studies were carried out for all the formulations in hexaplicate. Dialysis membrane method was used to evaluate the in vitro release of KS-loaded PLGA MPs for up to 12 days. Six dialysis bags with the same size were prepared and soaked in purified water for 24 h to be ready for use. The bags were sealed closely by clamps after 1 ml of PBS solutions were dropped into each bag.
One millilitre of MPs suspension (corresponding to 100 mg of KS) was placed in a dialysis, which was tied and placed into 200 ml of PBS (0.1 M, pH 7.4), maintained at 37ºC with continuous magnetic stirring. At selected time intervals, aliquots were withdrawn from the release medium and replaced with the same amount of PBS and concentrations of the released drug were determined by the HPLC method. The absorbance was measured at 205 nm.
In Vivo Pharmacokinetic Studies in Rat
The pharmacokinetic studies were carried out in healthy male Wistar rats (250-300 g). The animals were acclimatized to laboratory conditions over the week before experiments and fed with standard rat diet, under controlled conditions of a 12:12 h light : dark cycle, with a temperature of 22 ± 3∘C and relative humidity of 50 ± 5% RH. The experimental protocol was approved by the Institutional Animal Ethical Committee (AACP/IAEC/Feb-2014-01).
Eighteen rats were randomly separated into three groups (six animals in each group). The grouping of animals was as follows:
Group I: control normal rats (received saline solution) Group II: administered with pure drug (as solution) (15mg/kg/rat) (Henley et al., 1996)
Group III: administered with KS NPs (as dispersion in 1mL of water) and then administered intramuscularly.
At regular time intervals 0, 0.25, 0.5, 1.5, 2, 3, 4, 6, 8, 12 and every 24 h, for 4 days, samples of blood were withdrawn (100µL) from the retro-orbital plexus by microcapillary technique under light ether anaesthesia into heparinized microcentrifuge tubes (50 units heparin/mL of blood). Plasma was separated by centrifugation at 12,000 ×g for 15 min and analyzed by the following method.
formulations was appraised by administering pure drug intramuscularly and measuring the blood levels at 0, 0.25, 0.5, 1.5, 2, 3, 4, 6, 8, 12 and 24h.
RESULTS AND DISCUSSION
Optimization of Separation
To decrease the number of experiments, a decrease in dimensions of independent variables was considered in a series of preliminary screening experiments. Optimization of the chromatographic method was achieved in three steps: a series of preliminary experiments followed by two sets of different experiments. The experimental designs were performed to achieve maximum resolution in short analysis time and optimal peak asymmetry.
Preliminary Studies
The preliminary experiments were executed to decide the essential analytical requirements of the method, such as the type of column, buffer, and pH range. A standard solution containing 120 µg/mL of KS was used during the initial experiments. In our preliminary study, performance of several kinds of columns (Hypersil C18 (200mm × 4.6 mm, 5 µm), Grace smart C18 (150mm
×4.6 mm, 5 µm), Waters Symmetry C18 (200mm × 4.6mm, 5 µm),
and Phenomenex C18 (250mm × 4.6mm, 5 µm) was checked by
running dissimilar mobile phases. The best peak asymmetry and peak resolution were obtained with Phenomenex C18. Therefore,
Phenomenex C18was selected as the analytical column. The
.
resolution of Phenomenex C18 was higher and showed much better
peak asymmetry than the other columns. Three different buffers, sodium sulfate, disodium tetraborate, and tetrahydrofuran, were used and it was found that disodium tetraborate improved the peak shape of KS and produced the best resolution.
Screening Based on a Taguchi Orthogonal Array Design Screening study was applied to choose momentous parameters on separation. Taguchi orthogonal array design permitted evaluation of whether variables have a considerable influence on the chosen response or not. The parameters considered in the Taguchi orthogonal array design were the disodium tetraborate percentage, mobile phase ratio and pH, injection volume, and flow rate. The distincted responses of the variables were the retention times, peak resolution, and peak asymmetry.
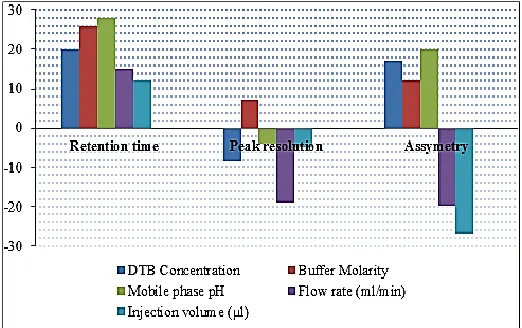
As can be seen in Figure 2, disodium tetraborate concentration, buffermolarity, flow rate, and injection volume had
a negative effect on peak resolution and peak asymmetry while all the above parameters had a positive effect on retention
time.
Disodium tetraborate concentration and mobile phase pH had significant effect on retention time and peak asymmetry and were selected for further optimization. Buffer molarity was, fixed to its maximum value (0.1M).The flowrate and injection volume were fixed to their optimum levels, which were 1 mL/min and 20
µL, respectively, to decrease analysis time and maximize resolution.
Fig. 2: Influence of selected parameters on the response magnitude.
Response Surfacing Based on 32Central Composite Design
The 2-factor-3-level CCD was employed to draw response surface graphs to determine the optimal conditions and to investigate parabolic interactions between parameters disodium tetraborate concentration and mobile phase pH). The variables with their relative experimental values are reported in Table 1. This design permitted the response surface to be modelled by fitting a second-order polynomial with the number of experiments equal to 2k+2k+1, where kis the number of variables, which composed a total of 13 experiments to be executed as per CCD design (Table 2).Experiments were executed according to the design listed in Table 2 and responses measured are given in the same table.
Three-dimensional surface plots are presented in Figure 3 and are extremely valuable for studying the interaction effects of the factors on the responses. The retention time for KS decreases as the disodium tetraborate (v/v)%, augmented from lower to intermediate level (Figure 3 (a)), when the buffer molarity was kept at constant 0.1 M and pH of mobile phase was at intermediate level. An augment in buffer molarity at constant pH and constant disodium tetraborate (v/v) % results in decrease in the retention time of KS. This effect is important when the buffer molarity is greater than 0.1 M. The effect of mobile phase pH on the retention time of KS was therefore investigated in a pH range from 2.5 to 4.0. Retention time was considered a more critical parameter in terms of analytical run time and sampling throughout analysis.
A classical second-degree model with a 3D experimental domain was hypothesized. The coefficients for the second order polynomial model were estimated by least squares regression. The equation for the Y1 (retention time) factor is shown in (4). The
regression coefficients calculated from CCD are given as follows:
Y1= 4.931 +1.203x1+0.231x2+3.538x1x2+0.6739x 2
1+0.852x 2
The optimized chromatographic conditions were then used for all future analytical studies. Peak symmetry was improved at intermediate level of mobile phase pH and disodium tetraborate concentration as shown in Figure 3 (b).
The result of Peak resolution is depicted in Figure 3 (c), designates that both disodium tetraborate concentration and mobile phase pH were one of the most important parameters that can be manipulated to optimize the separation and analysis of KS. In the mobile phase pH range investigated, the resolution of KS was improved as the pH was increased from lower to intermediate level. When using a disodium tetraborate concentration, mobile phase pH at intermediate level resulted in improved peak resolution is depicted in Figure 3 (c). As shown in Figure 3 (c), a decrease in resolution was observed as mobile phase of lower pH was used. When the disodium tetraborate concentration was at intermediate level peak resolution was improved.
The mathematical relationship in the form of polynomial equations for the measured responses Y2and Y3is given as follows:
2 = 8.082 + 0.268x1 + 0.700x2− 1.882x1x2− 2.177x 2
1− 0.160x 2
2, 3= 1.065 − 0.016x1+ 0.00x2+ 0.170x1x2+ 0.320x
2
1+ 0.100x 2
2. (5)
The model was authenticated by analysis of variance (ANOVA) employing Design Expert software version 8.0.1. The ANOVA tests demonstrated that the models materialized to be adequate, with significant lack of fit (P< 0.0001) and with a satisfactory coefficient of correlation (r).
Peak asymmetry achieved with the optimized
chromatographic conditions was 1.1 and was considered suitable
for this method. The final optimum conditions for
chromatographic separation were 0.1 M buffer molarity, pH 3.2, and disodium tetraborate concentration 25%. The optimized mobile phase consisted of a mixture of 0.1 M disodium tetraborate (pH 9.0) and water (25:75, v/v); at a flow rate of 1 mL/min.
METHOD VALIDATION
System Suitability Tests
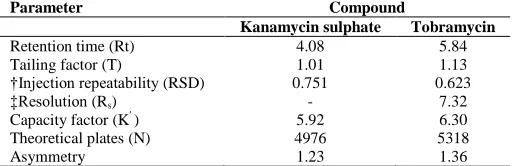
To assure the feasibility and adequacy of the proposed method for estimation of KS in routine pharmaceutical application and verify the resolution, column efficiency, and chromatographic repeatability, system suitability tests were performed (Table 3). The capacity factor (k′) was between 1 and 10, indicating good resolution with respect to the void volume. The RSD of peak areas of six consecutive injections was found to be less than 2%, thus
showing good injection repeatability and excellent
chromatographic and environmental conditions. The tailing factor (T) for the KS was found to be close to 1, reflecting good peak asymmetry. The resolution (Rs) between the peaks was greater
than 2, indicating good separation of the KS. The values for theoretical plate number (N) demonstrated good column efficiency. Resolution between KS and tobramycin was 7.32.
Table 3: System suitability parameters
Parameter Compound
Kanamycin sulphate Tobramycin
Retention time (Rt) 4.08 5.84
Tailing factor (T) 1.01 1.13
†Injection repeatability (RSD) 0.751 0.623
‡Resolution (Rs) - 7.32
Capacity factor (K′ ) 5.92 6.30
Theoretical plates (N) 4976 5318
Asymmetry 1.23 1.36
†RSD of peak areas of six consecutive injections at a concentration of 60 and 50 µg/ml of kanamycin sulphate and IS, respectively.
‡Resolution between kanamycin sulphate and IS.
The Limit of Detection (LOD) and Quantitation (LOQ) The estimated LOD and LOQ for KS were 60µg/mL and 120µg/mL, respectively.
A B C
Fig. 3: Three-dimensional graph showing (a) the effect of mobile phase and disodium tetraborate concentration (DTB) on retention time. (b) Three dimensional graph showing the effect of mobile phase (pH) and disodium tetraborate (DTB) concentration on peak resolution. (c) Three-dimensional graph showing the effect of mobile phase and disodium tetraborate (DTB) concentration on peak asymmetry.
Original Scale Retention Time
12.32
4.76
X1 = A: DTB Conc. X2 = B: pH
-1.00 0.00 1.00 -1.00 0.00 1.00 4 6 8 10 12 R e te n tio n T im e
A: DTB Conc. B: pH
Original Scale Peak Resolution
8.25
2.52
X1 = A: DTB Conc. X2 = B: pH
-1.00 0.00 1.00 -1.00 0.00 1.00 2 3.75 5.5 7.25 9 P e a k R e s o lu ti o n
A: DTB Conc. B: pH
Original Scale Peak Asymmetry
1.8
1
X1 = A: DTB Conc. X2 = B: pH
-1.00 0.00 1.00 -1.00 0.00 1.00 1 1.175 1.35 1.525 1.7 P e a k A sy m m e tr y
Linearity
Linearity was evaluated over the concentration range 120-840 µg/mL for KS, estimating the regression equation and the determination coefficients (R2) obtained from the least squares method. The coefficients of determination for the calibration curves were higher than 0.9996, which is generally considered as an acceptable fit of the data to the regression line and indicating good linearity over the concentration range proposed.
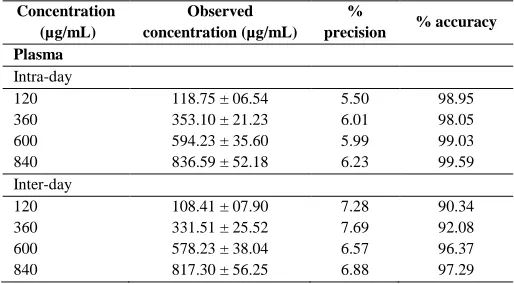
Table 4: Table 4: Intraday and interday precision and accuracy of kanamycin sulphate in rat plasma (n = 6).
Concentration (µg/mL)
Observed concentration (µg/mL)
%
precision % accuracy Plasma
Intra-day
120 118.75 ± 06.54 5.50 98.95
360 353.10 ± 21.23 6.01 98.05
600 594.23 ± 35.60 5.99 99.03
840 836.59 ± 52.18 6.23 99.59
Inter-day
120 108.41 ± 07.90 7.28 90.34
360 331.51 ± 25.52 7.69 92.08
600 578.23 ± 38.04 6.57 96.37
840 817.30 ± 56.25 6.88 97.29
Precision and Accuracy
Accuracy and precision for the quality controls in the intraday and inter-day run are shown in Table 4. All of the data fulfil the acceptance criteria. The intra- and inter-day RSD values did not exceed 5.0%. The intra- and inter-day values were found in the interval 3.0 to -5.0%. These data indicate that the developed method is accurate, reliable, and reproducible.
Specificity
Specificity is expressed as the capability of a method to distinguish the analyte from all potentially intrusive substances. The specificity of the method was scrutinized by blank plasma detection, peak purity, and spiking blank plasma with pure standard compounds. Blank rat plasma had no interference, when KS, and the IS were eluted. At optimized conditions, the separation of KS and tobramycin was completed within 7min (Figure 4 (a)).
Stability
Bench-top stability was investigated to ensure that KS was not degraded in plasma samples at room temperature. It was measured by divulging the QC samples to ambient laboratory conditions for 10 h. Freeze-thaw stability was measured over three cycles. The stability of reconstituted samples was assessed at ambient temperature for 24 h. The freezer storage stability of KS in rat plasma at -20∘C was evaluated at the beginning and one week later. All stability QC samples were analyzed in six replicates. The results indicated that KS had an acceptable stability under those conditions (Table 5).
Table 5: Stability of kanamycin sulphate in rat plasma (n = 6).
Sample condition
Spiked concentration
(µg/mL)
Mean determined concentration
(µg/mL)
Accuracy (%)
Bench-top stability♦
120 116.32 96.93
360 351.61 97.66
600 591.27 98.54
840 821.53 97.80
Freeze-thaw stability♣
120 118.86 99.05
360 358.11 99.47
600 592.32 98.72
840 834.61 99.35
One-week▲ stability
120 112.54 93.78
360 332.18 92.27
600 573.76 95.62
840 793.49 94.46
♦
Exposed at ambient temperature (25∘C) for 4 h. ♣
After three freeze-thaw cycles. ▲Stored at −16∘
C.
Method Applicability
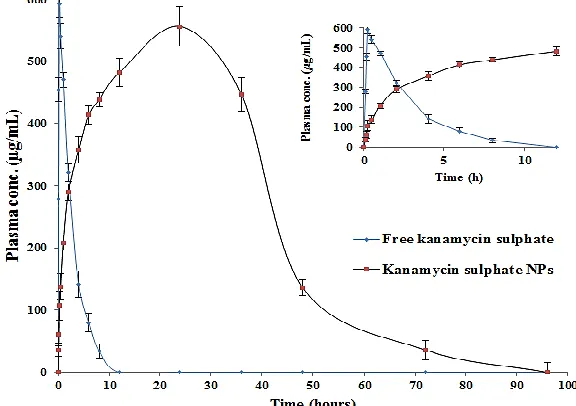
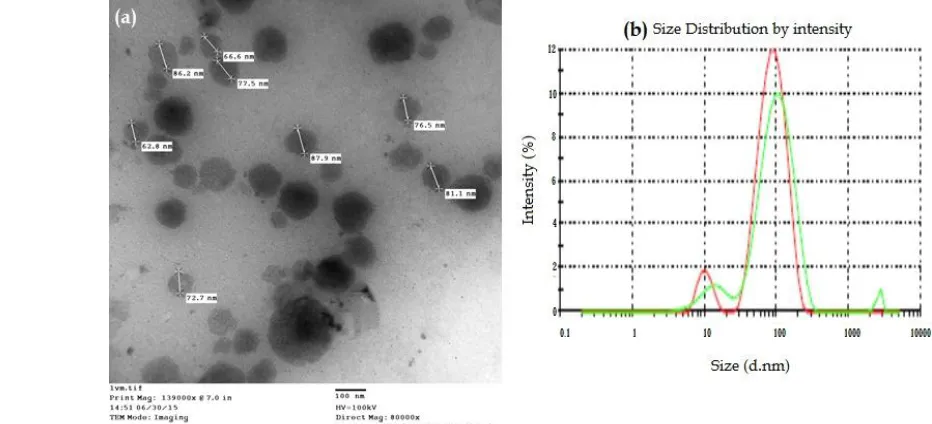
The method developed in this work was used to determine the content of KS in in vitro drug and in vivo release in free form and as NPs. The TEM image (Figure 6A) unambiguously reveals that most of the emulsion particles of KS NPs were below 100 nm in size and were spherical in shape. Figure 6B depicting the Dnm distribution distinctly reveals the particles size of the optimum formulation as 77.90 nm, polydispersity index (PDI) of 0.073, and zeta potential of -29mV. Percentage encapsulation efficiency (EE) and percentage drug loading for KS were found to be74.34% and 95.44%, respectively ( = 3), representing a high degree of EE of KS into PLGA NPs. KS has high solubility in water and it is necessary to prepare the NPs employing w/o/w emulsion technique, in order to augment the EE of this molecule. The in vitro drug release profile showed a 15% initial burst in the first day, followed by 80% cumulative drug release of KS after 12 days (Figure 4 (b)) in the PBS buffer at pH 7.4. Zero-order patterns were observed of optimized NPs formulation with R2values of 0.9904. The areas under the concentration versus time curves were 1727.56 µg/mL∗h and 22252.2 µg/mL∗h for free KS and KS NPs, respectively. Intramuscular administration of KS in the present study resulted in a sharp Cmax of 592.234µg/mL within 0.25 h after which the
plasma concentration declined rapidly, indicating a rapid absorption of KS, whereas a relatively slow increase and sustained plasma concentration of KS was observed for a longer time (3 days) after the administration of a single dose of KS NPs. Significantly ( < 0.05) Cmax of 556.364 µg/mL at 24h with KS still
A B
C D
Fig. 4: Optimized conditions: (a) chromatographic profile of the plasma spiked with kanamycin sulphate (840 µg/mL) in the presence of the I.S 50 µg/mL at pH value of 3.2 and identical compositions of mobile phase 0.1 M disodium tetraborate (pH 9.0) and water (25:85, v/v) supplemented with 0.5 g/L sodium octanesulphonate at a flow rate of 1 mL/min. (b)In vitro release profiles of kanamycin sulphate loaded PLGA (50 : 50) (M.W 14,500 da) nanoparticles with cetrimide as stabilizer in pH 7.4 phosphate buffer. Data points shown are mean ± standard deviation (n = 3). (c) Chromatogram of plasma sample collected from rats 0.25 h after intramuscular administration of free kanamycin sulphate. (d) Chromatogram of plasma sample collected from rats 24 h after receiving intramuscular administration of kanamycin sulphate NPs.
CONCLUSIONS
The novelty of the current work is the development of nanoparticle drug delivery system solely through the judicious selection of apt blend of PLGA and emulsifier and evaluate its in vitro release and in vivo absorption performance by systematically optimized HPLC method using Formulation by Design (FbD). Experimental designs have been employed during the development of the method to minimize retention time and maximize peak resolution and optimal peak asymmetry. The predicted values from the model equation were found to be in good agreement with observed values and to gain a better understanding of the two variables. Finally, the method was applied to investigate the content of KS in in vitro drug and in vivo release studies in free form and as NPs. Conclusively, the studies can be judiciously explored to develop suitable platform technology (ies) for development of effectual and cost-effectual optimized HPLC method to investigate the in vitro and in vivo release performance of nanoparticle drug delivery system of other aminoglycoside drugs.
Conflict of interest
The authors declare that there is no conflict of interests.
REFERENCES
Adams E., Dalle J., De-Bie E., et al., Analysis of kanamycin sulfate by liquid chromatography with pulsed electrochemical detection J. Chromatogr. B, 2001;752:173-77.
Blanchaert B., Jorge P.P., Jankovics P., et al., Assay of kanamycin by HPLC with Direct UV Detection. Chromatographia, 2013;DOI 10.1007/s10337-013-2440-8.
Claes P.J., Vanderhaeghe H.,Thin-layer chromatographic identification of aminoglycoside antibiotics. Antimicrob. Ag. Chemother, 1982;3:483-87.
Claes P.J., Vanderhaeghe H., Compernolle F., Isolation and Identification Of Minor Components Of Commercial KS. Antimicrob. agents chemother, 1973;13:560-63.
Doluisio J.T., Dittert L.W.,LaPiana J.C., Pharmacokinetics of kanamycin following intramuscular administration. J. Pharmacokinet. Biopharm, 1973;1:253-65
El-Attug M.N., Adams E., Hoogmartens J., et al., Capacitively coupled contactless conductivity detection as an alternative detection mode in CE for the analysis of kanamycin sulphate and its related substances. J. Sep. Sci, 2011;34:2448-54.
Flurer C.L., The analysis of aminoglycoside antibiotics by capillary electrophoresis. J. Pharm. Biomed. Anal, 1995;13:809-16.
FDA, Guidance for Industry: Bioanalytical Method Validation, US Department of Health and Human Services, Food and Drug Administration, Center for Drug Evaluation and Research and Center for Veterinary Medicine, 2001.
Gambardella P., Punziano R., Gionti M., et al. Quantitative determination and separation of analogues of aminoglycoside antibiotics
Fig. 6: (a) Transmissionelectron microscopy (TEM) image shows particle size of kanamycin loaded PLGA nanoparticles (KS NPs); (b) size distribution of KS NPs.
Table 6: Pharmacokinetic parameters of free kanamycin sulphate and kanamycin sulphate NPs at a dose of 15mg/kg/rat.
Pharmacokinetic parameters Free kanamycin sulphate Kanamycin sulphate NPs
Cmax (µg/mL) 592.234 ± 35.26 556.364 ± 35.84
tmax (h) 0.25 ± 0.011 24.0 ± 0.85
t1/2 (h) 1.89 ± 0.074 21.436 ± 0.25
AUC0–∞ (µg/mL∗h) 1727.56 ± 85.64 22252.2 ± 141.81
Ke (1/h) 0.365 ± 0.017 0.060 ± 0.028
MRT 2.84 ± 0.082 27.354 ± 1.19
by high-performance liquid chromatography. J. Chromatogr, 1985; 348: 229-40.
Holzgrabe U., Lang S.,Wienen F., Methods in Molecular Biology, Capillary Electrophoresis, 2008;384:735.
Henley C.M., Weatherly R.A., Ou C.N., et al. Pharmacokinetics of kanamycin in the developing rat. Hearing Research, 1996;99:85-90.
Inouye S., Ogawa H.,Separation and quantitative determination of amino sugar antibiotics and their degradation products by means of an improved method of chromatography on resin. J. Chromatogr, 1964;13:536-41.
ICH. Guidance for industry: validation of analytical procedures: methodology, Q2 (R1). In: Proceedings of the International Conference on Harmonisation of Technical Requirements for Registrations of Pharmaceuticals for Human Use (ICH), Geneva, Switzerland, November, 2005.
Jain A., Dixit P., Prasad R., Pre-XDR & XDR in MDR and Ofloxacin and kanamycin resistance in non-MDRMycobacterium tuberculosis isolates. Tuberculosis, 2012;92: 404-06.
Jae-Young H., Chi-Sung S., Seung Ju L., et al., Preparation of kanamycin powder by an optimized spray freeze-drying method. Powder Technology. 2010;199:159-64.
Kyung-Mi S., Minseon C., Hunho J., et al., Gold nanoparticle-based colorimetric detection of kanamycin using a DNA aptamer. Anal. Biochem, 2011; 415:175-81.
Kaale E., Van-Schepdael A., Roets E., et al., Development and validation of a simple capillary zone electrophoresis method for the analysis of kanamycin sulfate with UV detection after pre-capillary derivatization. J. Chromatogr. A, 2001; 924: 451-58.
Kaale E., Van-Schepdael A., Roets E., et al., Determination of kanamycin by electrophoretically mediated microanalysis with in-capillary derivatization and UV detection. Electrophoresis, 2003; 24: 1119-25.
Kim I.S., Lee S.K., Park Y.M., et al., Physicochemical characterization of poly (L-lactic acid) and poly (D, L-lactide-co-glycolide) nanoparticles with polyethylenimine as gene delivery carrier. Int. J. Pharm, 2015; 298: 255-62.
Lopez-Cervantes M., Escobar-Chavez J.J., Casas-Alancaster N., et al., Development and characterization of a transdermalpatch and an emulgel containing kanamycin intended to be used in the treatment of mycetoma caused byActinomadura madurae.Drug. Dev. Ind. Pharm, 2009;35:1511-21.
Longa Y.H., Hernandezb M., Kaalea E., et al., Determination of kanamycin in serum by solid-phase extraction, pre-capillary derivatization and capillary electrophoresis. J. Chromatogr. B, 2003;784:255-264.
Mustafa S., Pai R.S., Singh G., Devi V.K., Nanocarrier-based interventions for the management of MDR/XDR-TB. J. Drug Target, 2015;23:287-304.
Megoulas N.C., Koupparis M.A., Direct Determination of kanamycin in Raw Materials, Veterinary Formulation and Culture Media Using a Novel Liquid Chromatography - Evaporative Light Scattering Method. Analytica. Chimica. Acta, 2005;547:64-72.
Mostafavi A., Abedi G., Jamshidi A., et al., Development and validation of a HPLC method for the determination of buprenorphine hydrochloride, naloxone hydrochloride and noroxymorphone in a tablet formulation. Talanta, 2009; 77: 1415-19.
Negi P., Singh B., Sharma G., et al., Biocompatible lidocaine and prilocaine loaded-nanoemulsion system for enhanced percutaneous absorption: QbD-based optimisation, dermatokinetics and in vivo
evaluation. J. Microencapsu, 2015; DOI:
10.3109/02652048.2015.1046513.
Ogawa H., Ito T., Kondo S., et al., The Structure of an Antibiotic kanamycin. Bull Agr. Chern. Soc, 1959;23:289-310.
Rothrock J.W., Guegelman R.T., Wolf J.,Improved liquid chromatographic method with pulsed electrochemical detection for the analysis of kanamycin. J. Chromatogr.A, 2010;1217:3748-53.
Rybak L.P., Ramkumar V., kanamycin Ototoxicity. Kidney Int, 2007;72:931-35.
Selimoglu E., KalKSdelen S., Erdogan F. Comparative vestibule otoxicity of different aminoglycosides in the Guinea pigs. Yonsei. Med. J, 2003;44:517-22.
Stead D.A., Current methodologies for the analysis of aminoglycosides. J. Chromatogr. B. Biomed. Sci. Appl, 2000; 747:69-93.
Singh G., Pai R.S., Devi V.K., Optimization of pellets containing solid dispersion prepared by extrusion/spheronization using central composite design and desirability function. J. Young Pharm, 2012; 4:146-56.
Tsuji K., Robertson J.H. Chemical Derivatization in Gas Chromatography. Anal. Chem, 1970;42:1661.
Xiong Y., Xiao K.P., Rustum A.M., Development and validation of a stability-indicating RP-HPLC method to separate low levels of dexamethasone and other related compounds from betamethasone. J. Pharma. Biomed. Anal, 2009;49:646-54.
How to cite this article: