Serum/Plasma Proteome
An Investigation of Plasma Collection,
Stabilization, and Storage Procedures
for Proteomic Analysis of Clinical Samples
Jeffrey D. Hulmes,*
,1Deidra Bethea,
1Keith Ho,
1Shu-Pang Huang,
2Deborah L. Ricci,
3Gregory J. Opiteck
1Stanley A. Hefta
11Department of Clinical Discovery, Proteomics Unit, Pharmaceutical Research Institute,
Bristol-Myers Squibb Company, Princeton, NJ
2,*Department of Clinical Discovery, Biostatistics Unit, Pharmaceutical Research Institute,
Bristol-Myers Squibb Company, Princeton, NJ
3,*Department of Clinical Discovery, Pharmacology Unit, Pharmaceutical Research Institute,
Bristol-Myers Squibb Company, Princeton, NJ Copyright ©Humana Press Inc.
All rights of any nature whatsoever are reserved. ISSN 1542-6416/04/01:17–31/$25.00
*Author to whom all correspondence and reprint requests should be addressed: E-mail: [email protected]
Abstract
In order to evaluate the critical components of the process necessary to preserve clinical plasma samples collected at research sites for proteomic analysis, various collection and pre-servation protocols with controlled experi-mentation were evaluated. The presence of a protease inhibitor cocktail (PIC) included in the blood draw tube would stabilize the plasma proteins was hypothesized. To test this hypoth-esis, four plasma samples from each of 14 vol-unteers were collected. Samples were treated following a standard protocol that included PIC or were subjected to various processing treat-ments that included time, temperature, different anticoagulants, and the absence of PIC. Large format two dimensional-polyacrylamide gel
Clinical Proteomics _______________________________________________________________ Volume 1, 2004
Key Words: Proteomics; plasma collection; two-dimensional gel electrophoresis; sample stability; protease inhibitors; 2D-PAGE evaluation.
Introduction
Proteomic analysis is now being used exten-sively for the study of disease through the use of clinical samples such as tumor cell extracts, tissue samples, or body fluids (1). Many of these studies involve the search for biomark-ers in which certain proteins change in expres-sion with either a large increase or decrease as a result of disease (1–4). Two-dimensional gel electrophoresis (2-DE) remains the most widely used proteomic technique owing to the fact that it is currently the method that can separate and measure hundreds of proteins from a single biological sample simultane-ously (5,6). Analysis by 2D-PAGE has been used for proteomic studies of breast cancer (7–9), prostate cancer (10,11), hepatocellular carcinoma (12,13), renal cell carcinoma (14), rheumatoid arthritis (15,16), and hepatitis B infection (17). Many of these biomarker stud-ies utilized human blood serum or plasma samples. The plasma proteome is now being widely studied and will be a rich source of proteins for proteomic analysis for years to come (18).
The task of collecting large numbers of clini-cal plasma samples that best represent, and most accurately reflect, the plasma composition in vivo is of great importance. Given the large number of clinical trial sites around the world, it is important to standardize a procedure that will yield reliable samples for proteomic analy-sis. Clinical samples can be collected and
pro-cessed in any number of ways, but can also be “mishandled.” Plasma is often collected in a vacuum drawn blood tube that contains anti-coagulants and a gel-separating barrier (e.g. VACUTAINER PPT™, Becton Dickinson, Franklin Lakes, NJ). There is a great possibility of lab-to-lab variations in sample handling and processing and it would be easy to identify, for instance, biomarkers of proteolysis rather than markers of a particular disease. The stability of some analytes, viral load, and a few proteins from collected plasma samples have been stud-ied (19–22), but to our knowledge the condition or stability of the whole plasma proteome from clinical samples has not been methodically examined. To minimize the possibility of gen-erating “artifact” biomarkers, we have devel-oped a very precise protocol for the collection of plasma samples from clinical trials. This protocol includes the addition of a protease inhibitor cocktail (PIC) directly to plasma col-lection tubes prior to phlebotomy. Marshall et al. have recently shown that phenylmethyl-sulfonyl fluoride (PMSF) and ethylenediamine-tetraacetic acid (EDTA) effects the stability of serum samples as judged by matrix assisited laser desorption/ionization mass spectrometry (MALDI-MS) (23)while Olivieri et al. have pre-viously demonstrated protease inhibitors in red blood cell membrane lysates can have large effect on 2D-PAGE analysis (24). Here we pre-sent our findings of controlled treatments of plasma measured by proteomic analysis.
While it is logical that both a rigorous col-lection protocol and inclusion of PIC were nec-essary to obtain high quality plasma samples for proteomics analysis, neither had been thor-18 _______________________________________________________________________________ Hulmes et al.
We demonstrated that samples without PIC, from either heparin or ethylenediaminetetraacetic acid (EDTA) plasma tubes, gave results that varied significantly from the control samples. Also, even with PIC present in blood tubes, we found it was
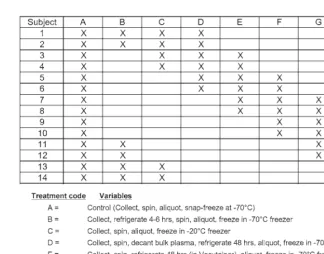
oughly evaluated for their ability to preserve proteins. We therefore designed a series of handling treatments, with conditions one might encounter in a clinical setting, to exam-ine their effects on protein stability and to detect differences from our standard protocol (Fig. 1). We wanted to verify that our method generated stable and high quality plasma sam-ples. The variables studied centered around the time and temperature of sample process-ing, the types of tubes used for sample collec-tion, and the presence or absence of PIC.
Proteomics is generally considered to be a global analysis of all proteins in a sample. In this study, we wanted to achieve the widest view of the plasma proteins to determine if differences were present as a result of alter-ations in the standard protocol. We chose to use 2D-PAGE on the plasma samples in this study. In order to limit the variables to mainly
the collection and storage differences, plasma samples were run with a minimum of sample preparation. Therefore, samples were not depleted of high abundance proteins (i.e., albumin and immunoglobulin) (25–27) , pre-fractionated, or run with narrow pI IPG strips (28–30). The goal was to run more that 50 samples by duplicate 2D-PAGE, measure a maximum number of spots for each gel and compare the control group to each of the other groups treated by the various collection and processing parameters. For this reason we chose silver staining of the gels rather than fluorescent staining, as the latter produced fewer overall spots, thus fewer data points to evaluate. Subsequently, the gels were analyzed using classical image analysis (31,32) , as well as a novel approach which we term Statistical 2D-PAGE Quality Scoring (SQS). The SQS method was a semi-quantitative means of
Fig. 1. Plasma samples collected and treated for study. A total of 56 samples were collected, 4 from each
volunteer, and samples were treated by 8 different handling variations as described (A–H). All the samples
Clinical Proteomics _______________________________________________________________ Volume 1, 2004 objectively differentiating between good and
bad quality gels. Different aspects and regions of the gels were scored. Finally, immunoassays for single proteins, were used as a verification method to test sample quality.
Materials and Methods
Experimental Design/Plasma Collection
Protocols
Four blood samples were drawn into tubes from 14 healthy volunteers for this study yielding a total of 56 separate blood samples for proteomic analysis (Fig. 1). One sample of blood from each patient was collected in a tube that was pre-loaded with PIC and han-dled in accordance with our standard collec-tion and processing protocol (control group A). For the control samples, plasma was col-lected in 8.0 mL lithium heparin plasma sepa-rating tubes (PST Vacutainer 367965, Becton Dickinson, Franklin Lakes, NJ) preloaded with 300 µL of PIC (stock: 2.2 mL of water added to P-2714: Sigma, St. Louis, MO). Each control tube therefore contained lithium heparin, EDTA, AEBSF, bestatin, E-64, leupeptin, and aprotinin. Following blood collection into a tube the following processing steps were con-ducted: (1) centrifuge at 2500gfor 15 min at 4°C within 15 min of the draw, (2) aliquot the plasma layer within 30 min of centrifugation in 1.0 mL volumes, (3) freeze the aliquots imme-diately using a dry ice/alcohol bath, and (4) place frozen aliquots in –70°C freezer for stor-age. The goal was to have each plasma sample reach solid state within 1 h of venipuncture.
The remaining three blood samples from each volunteer were drawn and each sub-jected to alternate handling and storage treat-ments that would reasonably be encountered at research sites participating in clinical trials. Each of the groups was a variation of the con-trol protocol and were labeled groups B through H (six samples per group). For
treat-ment groups A through F, PIC preloaded VACUTAINERS™ were used, as described in the previous section. In treatment group B, the blood was drawn and allowed to remain at 4°C for 5 h prior to the initiation of centrifu-gation. The remaining steps were performed as described for the control. Treatment group C varied from the control only by changing the freezing temperature to –20°C. In treat-ment group D, the plasma was decanted after centrifugation, refrigerated as a bulk aliquot at 4°C for 48 h before the generation of 1.0 mL aliquots subsequent freezing at –70°C. Treat-ment group E was processed by storing the centrifuged VACUTAINER™ at 4°C for 48 h before aliquotting into 1.0 mL volumes and freezing. Treatment group F was the result of snap freezing the decanted bulk plasma fol-lowing centrifugation, thawing after 48 h, aliquotting into 1.0 mL volumes, and re-freez-ing at –70°C. Treatment group G was collected into two EDTA tubes (VACUTAINER™, no. 362788, 5.0 mL, Becton Dickinson) without addition of PIC. Treatment group H excluded the PIC from the lithium heparin VACUTAIN-ERS™ used in treatment group A, but other-wise remained unchanged.
Randomization
Samples were randomized prior to the 2D-PAGE preparation step, the IEF procedure, and the second dimension run to allow for more robust statistical analysis. Multiple oper-ators were used for all steps of 2D-PAGE including staining and they were blinded to sample identification. Images for the SQS assessment were also randomized separately for each scorer.
Sample Analysis
Two-Dimensional Electrophoresis
and Gel Imaging
the Two-Dimensional Gel Electrophoresis Laboratory of Geneva, Switzerland (http://us. expasy.org/ch2d/service/) (33–35) with some modification as detailed below. Each sample was aliquotted in duplicate for two 2D-PAGE gels. Briefly, a 12.5 µL aliquot of plasma was mixed with 10 µL of a solution containing 10% SDS (Fisher Scientific, Fair Lawn, NJ) and 2.3% dithioerythritol (DTE) (Sigma, St. Louis, MO). The samples were heated to 95°C for 5 min, and subsequently diluted to 500 µL with solubilization buffer containing 8Murea (J.T. Baker, Phillipsburg, NJ), 4% Chaps (Cal-biochem, La Jolla, CA), 40 mM Tris (ICN Biomedicals, Aurora, OH), 65 mM DTE and trace Bromphenol blue (Sigma). Protein loads were based on the average plasma protein concentration of 80.0 ± 5.5 mg/mL from group A samples as measured by bicinchoninic acid (BCA) protein assay (cat. no. 23227; Pierce, Rockford, IL) (data not shown).
Isoelectric focusing was performed on 18 cm pH 3.0–10.0 NL IPG strips (Amersham, Piscat-away, NJ), which were rehydrated overnight in buffer consisting of 8Murea, 2% Chaps 18 mMDTE, 2% carrier ampholytes (Amersham) and bromphenol blue at room temperature. Sixty microliters of the prepared sample was placed into a cup loader at the anodic end of the IPG strip while at both electrodes, a paper wick immersed in a solution of 3.5% DTE was placed (26) . Each gel consisted of 120 µg ± 7% of plasma protein. Focusing was performed, 12 strips at a time, on a Protean IEF Cell (Bio-Rad, Hercules, CA) for a total of 75kVh.
The second dimension sodium dodecyl sul-fate-polyacrylamide gel electrophoresis (SDS-PAGE) was performed on 20 × 25 cm 9–16% gradient Tris gels (Omnimatrix, Yardley, PA). The gels were run 12 at a time (Dodeca, Bio-Rad) at 100 V for 16.5 hr, followed by fixation in 40% methanol, 10% acetic acid for 1 h at 25°C. The gels were silver stained by Silver Express staining kit (cat. no. LC6100,
Invitro-gen, Carlsbad, CA) as described by the manu-facturer.
A cooled charge coupled device (CCD) camera (Fluor-S, cat. no. 1707704; Bio-Rad) was used to digitize the gel images, using the same settings for all gels: f-stop = 5.6, expo-sure = 1.0 s, high resolution setting. Images were cropped to 757 by 978 pixels for unifor-mity and then were converted to TIFF files. These images were analyzed by Progenesis Discovery software (Version 2003.02; Nonlin-ear Dynamics, Durham, NC). The analysis experiment was set up for automated spot detection and matching, such that the gels from each treatment set were grouped together and an average gel image file created. The average gel from control group A was selected as the reference gel for the overall experiment with all 108 gel images. Spots were detected using the Progenesis algorithm and “Progenesis background” subtraction modes. The combined warping and matching setting was used for gel matching, as was the “cross-gel detection” which “uses matching information to make splitting more consistent within averaged gels.” Unmatched spots were added to the reference gel and spot numbers synchronized. The maximum “absence of spots” allowed per treatment group was set to three. Normalized spot volumes were obtained by normalizing to the total spot volume (total density of image) after using the Intelligent Noise Correction Algorithm (INCA) for analysis. No attempt was made to manu-ally correct mismatched spots so as to keep the objectivity of automated analysis.
Statistical 2D-PAGE Quality Scoring Analysis
Clinical Proteomics _______________________________________________________________ Volume 1, 2004 operators) to limit the subjectivity (bias). The
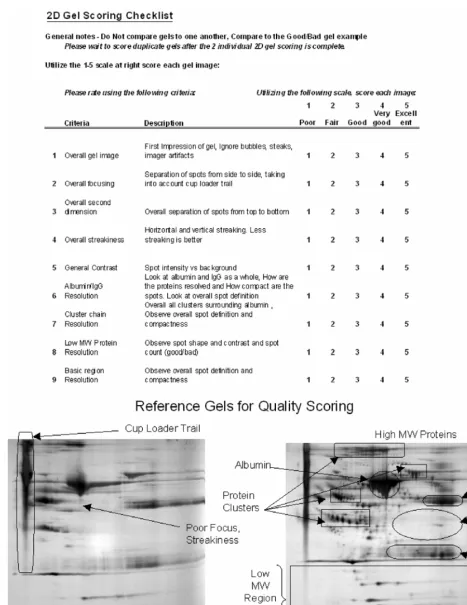
scoring scale was used to judge nine criteria: (1) overall gel image, (2) overall focusing, (3) overall second dimension quality, (4) overall streakiness, (5) general image contrast, (6) albumin/IgG resolution, (7) cluster chain res-olution, (8) low MW protein resres-olution, and (9) basic region resolution. The images were each scored against two reference gels, deemed to be of poor or excellent “quality.” Five scorers were asked to evaluate the random-ordered gel images in sets of 20–22 per scoring session. The scorers were blinded to operator and treatment information associ-ated with the images.
Protein Immunoassays
Enzyme immunoassay (EIA) kits were chosen based on commercial availability and applicability to plasma samples. Immunoassay kits for P-Cadherin (PCAD, cat. no. DPCD0), and human soluble Vascular Cell Adhesion Molecule-1 (sVCAM-1, cat. no. BBE3), were purchased from R & D Systems (Minneapolis, MN) and used according to the manufacturers instructions. EIAs were performed in 96-well plates for all 56 plasma samples in duplicate. Optical densities were determined by a plate reader (cat. no. 550, Bio-Rad). Concentrations of the proteins were calculated by executing a macro (XLFit, Excel, Microsoft, Redmond, WA) utilizing 4-parameter curve fits.
Statistical Analysis
Two-Dimensional Electrophoresis
Scatter-Plot Analysis
The spot volume data from matched aver-age gels were exported from Progenesis to Excel and scatter-plots were created using only spots matched by automated matching. The data was plotted on a log–log scale and linear regression analysis was done to produce a linear equation as well as the correlation coefficient (r2).
Statistical 2D-PAGE Quality Scoring Analysis
The scores from statistical 2D-PAGE quality scoring analysis (SQS) of gel images were compiled and analyzed by the cumula-tive logistic regression analysis (38) to obtain the odds ratios for image differences by treat-ment effect. This gives a prediction of the probability of one treatment group scoring higher than another. All the odds ratios were compared to treatment group A. The operator and scorer effect were taken into consideration and were adjusted in the analysis.
Protein Immunoassay Analysis
The analysis of variance (ANOVA) was applied to test for differences among the treat-ment groups for each of the proteins measured by immunoassay. Since four blood tubes were drawn from each individual, the baseline level for proteins may be different between individ-uals. The baseline biological variation was adjusted for evaluating the treatment effect in the analysis to prevent confounding (39).
Results
The plasma samples for this study were col-lected and processed according to the collec-tion protocol shown in Fig. 1. Each sample drawn yielded at least one 1.0 mL aliquot of plasma, with most yielding three aliquots. Immunoassays were performed on all 56 sam-ples and duplicate 2D-PAGE analysis was done on 54 samples for which there were ade-quate samples.
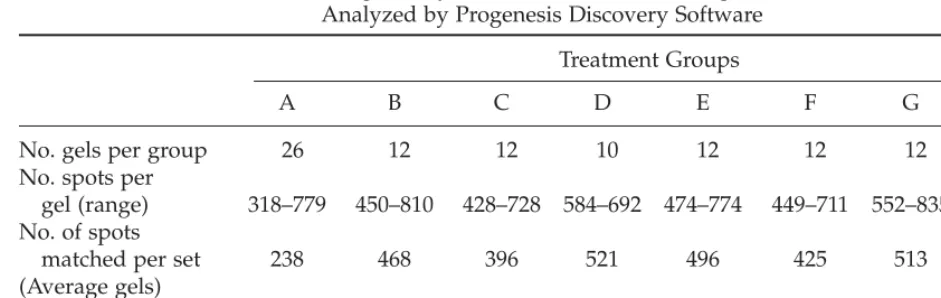
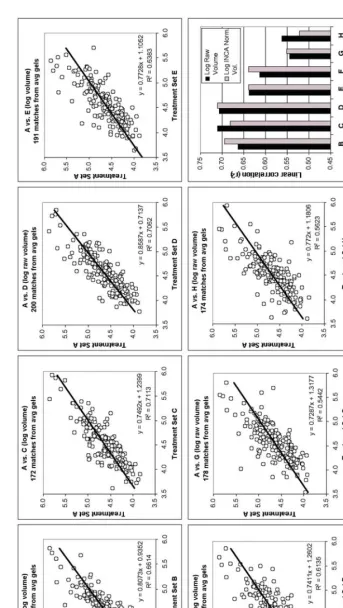
between 318 and 835 spots were found for each image. From the automated warping and matching analysis, 174 to 200 spots from the control group average gel were matched to each of the other treatment group’s average gel data. Figure 2 shows the scatter-plots for each of the comparisons (control group A vs groups B through H) using only the matched spot average volumes. Variation between groups was determined by linear regression analysis and was used as a measure of sample stability. The coefficient of determination (r2 value) from scatter-plots of raw spot volumes and INCA normalized volumes are also plot-ted in Fig. 2. The results suggest that treat-ment groups G and H, which were collected without PIC, are most different from the con-trol group. Groups E and F also show more scatter than the other groups when correlated to the control group. As we expected, the more harshly the samples are treated, or in the absence of PIC, the more scatter is seen in the spot volume comparisons.
We followed up the previous analysis with a second analysis of the gel images in order to get another perspective on the global differ-ences between treatment groups. A novel method was used to objectively score the
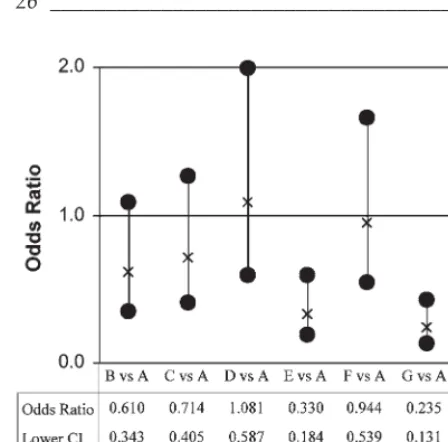
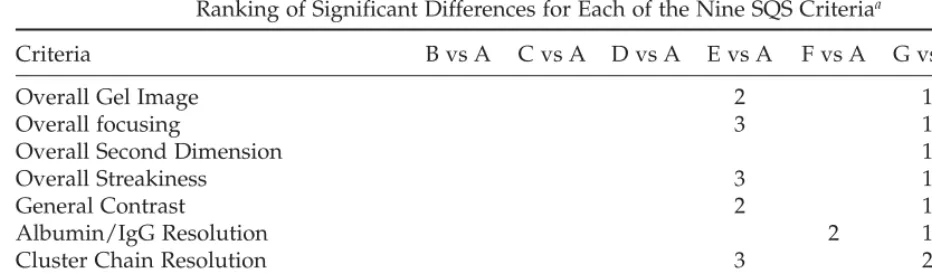
qual-ity of each gel image. Five analysts scored nine separate criteria, starting with overall gel image impression and working towards select portions of the gel (Fig. 3). The scores from the SQS process were compiled by treatment group. Each treatment group was compared to control group A. Significant odds ratios were detected from the cumulative logistic regres-sion. Odds ratios and their 95% confidence intervals for the “Overall Gel Image” are plot-ted in Fig. 4. For each scoring criteria, odds ratios were compiled and those with signifi-cant differences were ranked in order (Table 2). The results indicated that treatments E, G, and H repeatedly showed significant differ-ences from treatment A (Table 2). Even though group E samples contained PIC, the gel images from these samples ranked similarly to treatment group H samples that lacked PIC, thus leading us to conclude that it is very important to decant the plasma quickly after centrifugation. Four of the treatment groups studied (B–D, and F) showed little difference from the control group (A). These groups all contained PIC and were processed either within 6 h of the blood draw (treatments B and C) or the bulk plasma was removed from the collection tube (treatments D and F). In the
Table 1
2D-PAGE Image Analysis (Detection and Matching) for 108 Gels Analyzed by Progenesis Discovery Software
Treatment Groups
A B C D E F G H
No. gels per group 126 112 112 110 112 112 112 112 No. spots per
gel (range) 318–779 450–810 428–728 584–692 474–774 449–711 552–835 566–738 No. of spots
matched per set 238 468 396 521 496 425 513 460 (Average gels)
Fig.
2.
Scatter
-plot anal
ysis of matched a
verage spot v
o
lume data f
o
r each tr
eatment gr
oup compar
ed to contr
ol gr
oup
A.
Each compa
rison
was plotted on a log–log scale to cr
eate a scatter
-plot.
The linear r
egr
ession anal
ysis and coefficient of determination (
r
2) f
or each
compar-ison is sho
wn.
Data fr
om INC
A
normalized spot v
olume in ad
dition to ra
w spot v
olume (sho
wn) w
e
re
plotted and the
r
2values fr
om both
sets of scatter
-plots ar
e gra
phed in the lo
w
er right panel.
Clinical Proteomics _______________________________________________________________ Volume 1, 2004 latter two conditions the bulk plasma, now
containing PIC, appeared to show no differ-ences even though samples sat at 4°C for 48 h (treatment D) or were exposed to a freeze–thaw cycle (treatment F). These data suggest that plasma collected with PIC can withstand temporary storage at 4°C, tempo-rary storage of plasma at –20°C, or at least a single freeze–thaw cycle.
A series of immunoassays were performed on all 56 plasma samples to provide additional data to either support or refute our hypothe-sis. The assays were chosen because kits were commercially available and were applicable to plasma samples. Assays for Placental Cad-herin (PCAD) and soluble Vascular Adhesion Molecule-1 (sVCAM-1) detected differences between treatment groups when all samples were tested. The CVs for test plasma samples collected using our standard protocol yielded
CVs for intra-assay and inter-assay precision that were equivalent to those described by the manufacturer (1.4–1.9% and 4.9–5.9% respec-tively for PCAD and 4.3–5.9% and 8.5–10.2% respectively for sVCAM-1 [data not shown]). To limit variability, samples were thawed once, randomized and assayed in duplicate. The PCAD and sVCAM-1 immunoassay results with descriptive statistics (mean and standard error) for each treatment group are shown in Table 3. An analysis of variance (ANOVA) between control group A and each of the seven other treatment groups (B–H) were applied to the immunoassay results (Table 4). After adjusting for baseline varia-tion, significant differences among treatments were observed. As a result, both PCAD and sVCAM-1 were shown to be present at signif-icantly higher levels in the plasma in treat-ment groups G and H (no PIC) as compared with groups that were drawn with PIC pre-sent. These two proteins have been reported as potential biomarkers; PCAD has been implicated in invasive glandular lesions of the cervix and colon (40,41), whereas sVCAM-1 has been linked to the development of coro-nary artery disease and atherosclerosis (42,43).
Discussion
The overall goal of this work was to estab-lish that our existing sample handling proto-col, including the protease inhibitor cocktail, stabilized the proteins in plasma samples col-lected for proteomic analysis. To test this hypothesis, three different experimental anal-yses were used on a total of 56 human plasma samples collected from 14 separate donors. The samples were treated according to condi-tions specified in Fig. 1 in order to mimic con-ditions anticipated at clinical research sites. The analyses consisted of a classical spot anal-ysis of large format 2D gels, a novel scoring paradigm (SQS) for the same 2D gels, and immunoassays for individual proteins.
26 _______________________________________________________________________________ Hulmes et al.
The challenges of 2D-PAGE and image anal-ysis for clinical samples are many. 2D-PAGE is not a high-throughput method, and image analysis—spot detection and matching— remains less than perfect. Also, because of the wide dynamic range and presence of highly abundant proteins, plasma proteomics is a more difficult task than 2D-PAGE of bacterial extracts or even human cell extracts (18,28). The classical scatter-plot analyses, that were used to compare each treatment group to the control group (Fig. 2), represent a fairly crude analysis technique. The statistical certainty was less than ideal, though there was a definite trend for samples without PIC (G and H) to be different from the control. Treatments E and F, where the samples were treated more harshly, and possi-bly even B showed slightly more difference than the groups C and D. While this result with image analysis supported our hypothesis, rely-ing on the fit of a straight line to the matched spots seemed to be an inaccurate means of assessment. It was reassuring that groups G (EDTA only), and H (heparin only) showed the most differences from the control group, but it was still less than statistically rigorous.
Therefore, an alternative method for statis-tically assessing gel separation quality was developed, so as to find meaningful differ-ences among treatment sets. The idea was to use the expertise of experienced 2D-PAGE operators to grade the quality of the 2D-PAGE separations, and therefore of the plasma sam-ples themselves. The result, that of the score-sheet and randomization process described earlier (Fig. 3), were both surprisingly straight-forward and reassuringly simple. Unlike the results from automated spot matching and scatter-plot analysis, the differences scored between the control group (A) and treatment groups G and H were statistically significant (Table 2). The significant difference between treatment A and E (48 h refrigeration in col-lection tube after centrifugation), indicates that the plasma proteome was affected through prolonged contact with the cellular material. One theory is that proteolytic enzymes excreted from leukocytes diffused through the gel plug within the blood collection tube and overwhelmed the PIC, causing proteolysis of the plasma proteins. Therefore, our collection and processing protocols now ensure that the
Table 2
Ranking of Significant Differences for Each of the Nine SQS Criteriaa
Criteria B vs A C vs A D vs A E vs A F vs A G vs A H vs A
Overall Gel Image 2 1 3
Overall focusing 3 1 2
Overall Second Dimension 1
Overall Streakiness 3 1 2
General Contrast 2 1 3
Albumin/IgG Resolution 2 1
Cluster Chain Resolution 3 2 1
Low MW Protein Resolution 1 2 3
Basic Region resolution 2 1
aOdds ratios with 95% confidence interval, like that plotted in Fig. 4, yielded significant differences which are
ranked for each scoring criteria. Rank is solely based on the odds ratio estimate, not statistically tested.
Note: Groups E, G, and H consistently scored significantly different than A in most of the nine quality
Clinical Proteomics _______________________________________________________________ Volume 1, 2004 sample tubes are centrifuged and decanted
within 1 h of blood draw, and that this length of time must be closely monitored and recorded. This data implicates that biomarker “artifacts” may result from extended incubation of blood components without separation. The results of treatment groups G and H showed a benefit from the inclusion of the protease inhibitors other than just EDTA. A possible future experi-ment would be to test blood samples for pro-tease activity directly (for example, using Zymogram gels). Finally, the nonsignificance among groups A–D and possibly F, indicates that the presence of PIC allowed for less expe-ditious processing and/or less rigorous storage conditions.
Results from gels from samples without PIC (G and H), and the samples left in a VACU-TAINER™ for 48 h at 4°C (E), were clearly rec-ognized by the SQS analysis as being distinct from the other 2D-PAGE separations. To this end, the SQS process demonstrated its useful-ness. This methodology of scoring gel quality may be used for future clinical studies per-formed with 2D-PAGE analysis. It may also be possible to use SQS as a first pass test to deter-mine if there are statistical differences in two sets of gels from a proteomic project prior to the use of computed image analysis. The
results of SQS also proved to be readily man-ageable by statistical data analysis. A weighted score for each of the scoring criteria can be easily implemented to refine the SQS process to address more interesting questions.
Recognizing that the 2D-PAGE was a global approach, we searched for individual protein differences by spot volume analysis that would match the trends seen in the global analysis, however there was too much varia-tion in the data. By using immunoassays we did find two proteins that changed signifi-cantly by treatment. These assays proved to be a high-throughput means of testing all sam-28 _______________________________________________________________________________ Hulmes et al.
Table 3
Results of Immunoassays of Human Soluble Placental cCadherin (PCAD) and Human Soluble Vascular Adhesion Molecule-1 (sVCAM-1) for 56 Plasma Samples Collected for the Stability Studya
Treatment Groups
Protein Statistics A B C D E F G H
PCAD mean 9.203 9.451 9.022 10.088 9.645 9.030 11.094 11.494 SD 1.691 1.615 1.742 2.217 1.875 1.582 0.908 1.367 sVCAM mean 241.993 235.487 196.315 227.756 273.396 282.871 766.919 396.786 SD 99.457 89.596 92.618 85.906 133.166 89.381 239.811 109.271
aResults for mean concentration (ng/mL) with standard deviations (SD) for each treatment group are shown.
Table 4
ANOVA Analysis (pvalues) of EIA Concentration Values From Each Treatment Group
Compared to the Control Group
ples in a much shorter timeframe, and at significantly lower cost, than the 2D-PAGE method. The two proteins, PCAD and sVCAM-1, were known to be found in soluble and cell-bound forms, and we theorized that an increase in the soluble form in plasma would be because of proteolysis or cell lysis during collection and handling of the blood samples. The fact that both PCAD and sVCAM-1 were found at higher levels in treat-ment groups G and H vs the control group A indicates that both of these proteins are most likely cleaved by nonmetalloproteases and that the presence of the PIC substantially increases the stability of their membrane-bound forms. As surrogates for the rest of the plasma proteome, we infer that other proteins are certain to be similarly affected by the absence of protease inhibitors. The immunoas-say results corroborated the various 2D-PAGE gel analysis methods, in showing that treat-ment groups G (EDTA only) and H (no pro-tease inhibitors), the two groups without PIC, were again significantly different from the control group A. The increase in soluble PCAD or sVCAM-1 in these two groups sug-gests that they could serve as reporter proteins for proper collection or stability of plasma samples. They may be surrogate markers of plasma sample reliability.
Conclusions
As an overall assessment, each of the tech-niques and analysis methods showed remark-ably consistent results, that our standard collection protocol, including the protease inhibitor cocktail, provides for the most stable human plasma samples for proteomic analy-sis. There were indications that some of the strict aliquotting and time restraints could be relaxed, given the presence of the PIC, although there was clearly a need to separate
the cellular component of blood from the plasma as soon as possible, via centrifugation and decanting. Freeze–thaw cycles and tem-porary refrigeration both seemed to have little detrimental affect in the presence of PIC.
The goals of the experiments also drove the creation of the novel statistical scoring method (SQS). This method could be used in the future for the development of enhanced 2D-PAGE methods, both by vendors and end-users in clinical studies. It provides a robust means of differentiating subtleties in 2D-PAGE performance, and can be implemented with-out the need for extensive computational anal-ysis hardware or software. We recognize that there are many new mass spectrometry tech-nologies being used for proteomics analysis but 2D-PAGE analysis is still a common and important tool for plasma and serum pro-filing. Not surprisingly, immunoassays for specific proteins are a simple, fast, and inex-pensive way to validate sample stability or biomarker assessment, limited only by kit availability. Finally, if one adheres to our protocol for clinical plasma collection that includes protease inhibitors, even with the wide range of collection variability in research laboratories, there appears to be little need to worry about the integrity of the samples.
Acknowledgments
bio-Clinical Proteomics _______________________________________________________________ Volume 1, 2004 statistics. Finally, JDH thanks Patricia E. Hulmes
for her valuable advice on questionnaire scoring.
References
1. Hanash S. Disease proteomics. Nature 2003; 422:226–232.
2. Hanash SM. Biomedical applications of two-dimensional electrophoresis using immobilized pH gradients: current status. Electrophoresis 2000;21:1202–1209.
3. Chambers G, Lawrie L, Cash P, Murray GI. Proteomics: a new approach to the study of disease. J Pathol 2000;192:280–288.
4. Seliger B, Kellner R. Design of proteome-based studies in combination with serology for the identification of biomarkers and novel targets. Proteomics 2002;2:1641–1651.
5. Rabilloud T. Two-dimensional gel electro-phoresis in proteomics: old, old fashioned, but it still climbs up the mountains. Proteomics 2002;2:3–10.
6. Young DS, Tracy RP. Clinical applications of two-dimensional electrophoresis. J Chroma-togr A 1995; 698:163–179.
7. Le Naour F, Misek DE, Krause MC, et al. Pro-teomics-based identification of RS/DJ-1 as a novel circulating tumor antigen in breast cancer. Clin Cancer Res 2001;7:3328–3335. 8. Rui Z, Jian-Guo J, Yuan-Peng T, Hai P,
Bing-Gen R. Use of serological proteomic methods to find biomarkers associated with breast cancer. Proteomics 2003;3:433–439.
9. Zuo X, Hembach P, Echan L, Speicher DW. Enhanced analysis of human breast cancer proteomes using micro-scale solution isoelec-trofocusing combined with high resolution 1-D and 2-D gels. J Chromatogr B Analyt Technol Biomed Life Sci 2002;782:253–265. 10. Charrier JP, Tournel C, Michel S, et al.
Differential diagnosis of prostate cancer and benign prostate hyperplasia using two-dimensional electrophoresis. Electrophoresis 2001;22:1861–1866.
11. Charrier JP, Tournel C, Michel S, Dalbon P, Jolivet M. Two-dimensional electrophoresis of prostate-specific antigen in sera of men with prostate cancer or benign prostate hyperpla-sia. Electrophoresis 1999;20:1075–1081. 12. Poon TC, Johnson PJ. Proteome analysis and
its impact on the discovery of serological
tumor markers. Clin Chim Acta 2001;313: 231–239.
13. Steel LF, Shumpert D, Trotter M, et al. A strat-egy for the comparative analysis of serum proteomes for the discovery of biomarkers for hepatocellular carcinoma. Proteomics 2003;3: 601–609.
14. Kellner R, Lichtenfels R, Atkins D, et al. Tar-geting of tumor associated antigens in renal cell carcinoma using proteome-based analysis and their clinical significance. Proteomics 2002;2:1743–1751.
15. Sinz A, Bantscheff M, Mikkat S, et al. Mass spectrometric proteome analyses of synovial fluids and plasmas from patients suffering from rheumatoid arthritis and comparison to reactive arthritis or osteoarthritis. Electro-phoresis 2002;23:3445–3456.
16. Smith MA, Bains SK, Betts JC, Choy EH, Zan-ders ED. Use of two-dimensional gel elec-trophoresis to measure changes in synovial fluid proteins from patients with rheumatoid arthritis treated with antibody to CD4. Clin Diagn Lab Immunol 2001;8:105–111.
17. He QY, Lau GK, Zhou Y, et al. Serum bio-markers of hepatitis B virus infected liver inflammation: A proteomic study. Proteomics 2003;3:666–674.
18. Anderson NL, Anderson NG. The human plasma proteome: history, character, and diag-nostic prospects. Mol Cell Proteomics 2003; 2:50.
19. Boyanton BL, Jr., Blick KE. Stability studies of twenty-four analytes in human plasma and serum. Clin Chem 2002;48:2242–2247.
20. Flower L, Ahuja RH, Humphries SE, Mohamed-Ali V. Effects of sample handling on the stability of interleukin 6, tumour necro-sis factor-alpha and leptin. Cytokine 2000;12: 1712–1716.
21. Lewis MR, Callas PW, Jenny NS, Tracy RP. Longitudinal stability of coagulation, fibrinol-ysis, and inflammation factors in stored plasma samples. Thromb Haemost 2001;86: 1495–1500.
22. Holodniy M, Rainen L, Herman S, Yen-Lieberman B. Stability of plasma human immunodeficiency virus load in VACUTAINER PPT plasma preparation tubes during overnight shipment. J Clin Microbiol 2000;38:323–326. 23. Marshall J, Kupchak P, Zhu W, et al.
Process-ing of Serum Proteins Underlies the Mass
30 _______________________________________________________________________________ Hulmes et al.
Spectral Fingerprinting of Myocardial Infarc-tion. J Proteome Res. 2003;2:361–372.
24. Olivieri E, Herbert B, Righetti PG. The effect of protease inhibitors on the two-dimensional electrophoresis pattern of red blood cell mem-branes. Electrophoresis 2001;22:560–565. 25. Lollo BA, Harvey S, Liao J, et al. Improved
two-dimensional gel electrophoresis represen-tation of serum proteins by using ProtoClear. Electrophoresis 1999;20:854–859.
26. Wang YY, Cheng P, Chan DW. A simple affin-ity spin tube filter method for removing high-abundant common proteins or enriching low-abundant biomarkers for serum pro-teomic analysis. Propro-teomics 2003;3:243–248. 27. Rothemund DL, Locke VL, Liew A, Thomas
TM, Wasinger V, Rylatt DB. Depletion of the highly abundant protein albumin from human plasma using the Gradiflow. Proteomics 2003; 3:279–287.
28. Corthals GL, Wasinger VC, Hochstrasser DF, Sanchez JC. The dynamic range of protein expression: a challenge for proteomic research. Electrophoresis 2000;21:1104–1115.
29. Herbert B, Righetti PG. A turning point in proteome analysis: sample prefractionation via multicompartment electrolyzers with iso-electric membranes. Electrophoresis 2000;21: 3639–3648.
30. Zuo X, Echan L, Hembach P, et al. Towards global analysis of mammalian proteomes using sample prefractionation prior to narrow pH range two-dimensional gels and using one-dimensional gels for insoluble and large proteins. Electrophoresis 2001;22:1603–1615. 31. Collins PJ, Juhl C, Lognonne JL. Image
analy-sis of 2D gels: considerations and insights. Cell Mol Biol (Noisy-le-grand) 1994;40:77–83. 32. Nishihara JC, Champion KM. Quantitative
eval-uation of proteins in one- and two-dimensional
polyacrylamide gels using a fluorescent stain. Electrophoresis 2002;23:2203–2215.
33. Hughes GJ, Frutiger S, Paquet N, et al. Plasma protein map: an update by microsequencing. Electrophoresis 1992; 13:707–714.
34. Sanchez JC, Appel RD, Golaz O, et al. Inside SWISS-2DPAGE database. Electrophoresis 1995;16:1131–1151.
35. Hoogland C, Sanchez JC, Walther D, et al. Two-dimensional electrophoresis resources available from ExPASy. Electrophoresis 1999; 20:3568–3571.
36. Hoving S, Gerrits B, Voshol H, Muller D, Roberts RC, van Oostrum J. Preparative two-dimensional gel electrophoresis at alkaline pH using narrow range immobilized pH gradi-ents. Proteomics 2002;2:127–134.
37. Streiner DL. A checklist for evaluating the use-fulness of rating scales. Can J Psychiatry 1993; 38:140–148.
38. Agresti A. Analysis of Ordinal Categorical Data. New York: John Wiley & Sons, Inc.,1984. 39. Rhodes AE, Lin E, Streiner DL. Confronting the confounders: the meaning, detection, and treatment of confounders in research. Can J Psychiatry 1999;44:175–179.
40. Han AC, Edelson MI, Peralta Soler A, et al. Cadherin expression in glandular tumors of the cervix. Cancer 2000;89:2053–2058.
41. Muller N, Reinacher-Schick A, Baldus S, et al. Smad4 induces the tumor suppressor E-cadherin and P-cadherin in colon carcinoma cells. Oncogene 2002;21:6049–6058.
42. Blankenberg S, Rupprecht HJ, Bickel C, et al. Circulating cell adhesion molecules and death in patients with coronary artery disease. Cir-culation 2001;104:1336–1342.
43. Cybulsky MI, Iiyama K, Li H, et al. A major role for VCAM-1, but not ICAM-1, in early atherosclerosis. J Clin Invest 2001;107:1255–1262.
24
25
26
27
28
29
30
32
33
34
35
36
37
39
40
41