PhD Dissertation
International Doctorate School in Information and
Communication Technologies
DISI - University of Trento
T
HREE
C
ASE
S
TUDIES FOR
U
NDERSTANDING
,
M
EASURING AND
U
SING
A
C
OMPOUND
N
OTION OF
D
ATA
Q
UALITY
WITH
E
MPHASIS ON THE
D
ATA
S
TALENESS
D
IMENSION
Oleksiy Chayka
Advisor:
Prof. Paolo Bouquet
Abstract
By its nature, the term “data quality” with its generic meaning “fitness for use” has both
subjective and objective aspects. There are numerous methodologies and techniques to evaluate its
subjective parts and to measure its objective parts. However, none of them are uniform enough for
exploitation in diverse real-world applications. None of those, in fact, can be created as such, since data
quality penetrates too deep into business operations to prevent from finding “a silver bullet” for all of
them: it normally goes from representation of real world entities or their properties with data in an
information system, to data processing and delivering to consumers. In this work, we considered three
real world use cases which entirely or partially cover those areas of data quality scope.
In particular, we study the following problems: 1) how quality of data can be defined and
propagated to customers in a business intelligence application for quality-aware decision making; 2)
how data quality can be defined, measured and used in a web-based system operating with
semi-structured data from and designated to both humans and machines; 3) how a data-driven (vs.
system-driven) time-related data quality notion of staleness can be defined, efficiently measured and monitored
in a generic information system. Thus, we expand the corresponding state of the art with Application,
System and Dimension aspects of data quality.
In the Application context, we propose a quality-aware architecture for a typical business
intelligence application in a healthcare environment. We demonstrate potential quality issues
implications, including intra- and inter-dimensional quality dependencies, prone to data from early
processing stages up to the reporting level.
In the part dedicated to the System, we demonstrate an approach to understand, measure and
disseminate data quality measurement results in a context of a web based system called Entity Name
System (ENS).
On the Dimension side, we propose a definition of data staleness in accordance with key
time-related quality metrics requirements, relying on the corresponding similar notions elaborated by the
researchers before. We demonstrate an approach to measure data staleness by different statistical
methods, including exponential smoothing. In our experiments, we compare their space efficiency and
data update instants predictive accuracy using history of updates of sample representative articles from
Keywords
Acknowledgements
I would like to express my gratitude to all those people who made a significant
contribution, direct or indirect, to this work, and to my life.
In particular, I would like to thank:
Paolo Bouquet, my advisor, for elucidating the research path.
Themis Palpanas, Fabio Casati, Florian Daniel and
Cinzia Cappiello with whom I
started my research on the own “Journey to Data Quality”, and who gave me valuable feedbacks
on this way, directing my efforts, together with Bernd Heinrich and Mathias Klier who helped
me to connect the dots along data freshness and staleness dimensions.
Yevgeniy Bodyanskiy, Anatoliy Gvozdinskiy, Vadim Gubin and Aleksandr Vechur
for their guidance and help to go beyond.
John Mylopoulos and Gerhard Lakemeyer for steering towards and in research.
Dan Defend and Aparna Vani for their great directions, and not only. I learnt a lot from
you. Heiko Stoermer and other Okkam team members for their cooperative work on data
quality research and development part in the ENS.
Marina and
Andrey,
Ruslan,
Lena,
Sasha,
Kolya
and
Alexandra, together with
Andrey L., Dima P. and Vova K. for their supportive and pervasive friendship.
Natasha Bielova and Marco Biazzini, a special couple taking special place in our life.
Laura Maino and
Giuliano Zendri for showing me a side of Trentino not everybody
can experience.
Juan, Nghi, Ali, Ravi and all the guys who kept my mind open off the work and study,
especially while being on the field.
Y.V. Rybalko and
A.A. Popov who dedicated part of their life to support aspiration of
young people for knowledge.
Valentina Petrovna for inspiring bio-molecular associations.
Special gratitude I would like to express to my parents who gave me life, to my siblings
with whom I spent most of it, not forgetting Vitalik and my beautiful niece.
vii
Contents
Chapter 1. Introduction ... 1
1
Motivation and problems ... 1
2
Our proposition and outline of the thesis ... 2
2.1
Our contributions ... 3
Chapter 2. State of the Art ... 5
1
Data quality and quality dimensions ... 6
1.1
Consistency... 10
1.2
Time-related quality dimensions ... 10
2
Quality views and quality profiles ... 12
3
Data quality for business intelligence ... 13
4
Open issues... 14
Chapter 3. Data Quality in Business Intelligence Applications ... 15
1
Introduction ... 16
1.1
A quality-aware BI scenario ... 18
2
Data quality in business intelligence ... 19
2.1
A compound notion of data quality for BI ... 19
2.2
Data completeness in BI ... 20
2.3
Data consistency in BI ... 21
2.4
Data confidence in BI ... 22
2.5
Warehouse quality metadata... 22
3
From data quality to report quality... 23
4
User interaction with quality-aware reports ... 27
4.1
Interactive data visualization ... 27
4.2
User quality profiles in a BI architecture ... 28
5
Conclusions ... 30
Chapter 4. Data Quality Measurement for the Entity Name System ... 31
1
Overview of the Entity Name System ... 32
1.1
Overview of the ENS architecture ... 33
2
Data quality dimensions in the ENS ... 34
2.1
Consistency... 35
viii
2.3
Distinctiveness ... 38
2.4
Representational importance ... 39
2.5
Staleness ... 39
3
Measurement of data quality in the ENS ... 40
3.1
Consistency ... 42
3.1.1
Measurement of consistency ... 42
3.1.2
Usage of consistency measure ... 43
3.2
Popularity ... 43
3.2.1
Measurement of popularity ... 43
3.2.2
Usage of popularity measure ... 45
3.3
Distinctiveness ... 45
3.3.1
Measurement of distinctive uncertainty ... 46
3.3.2
Usage of a distinctiveness measure ... 47
3.4
Representational importance ... 48
3.4.1
Measurement of representational importance ... 48
3.4.2
Usage of representational importance measure ... 49
3.5
Staleness ... 50
3.5.1
Measurement of staleness ... 50
3.5.2
Usage of staleness measure ... 51
4
Conclusions ... 52
Chapter 5. Defining and Measuring Data-Driven Quality Dimension of Staleness ... 53
1
Introduction ... 54
2
Notion of data staleness ... 57
2.1
Definition of data staleness measure ... 57
3
Requirements for time-related quality metrics ... 58
3.1
Normalization ... 58
3.2
Interval scale ... 59
3.3
Interpretability ... 59
3.4
Aggregation ... 59
3.5
Adaptivity ... 60
3.6
Feasibility ... 60
4
Approaches to data staleness measurement ... 60
4.1
Enhanced averaging method ... 60
4.2
Shifting window ... 61
4.3
Exponential smoothing ... 63
5
Measurement triggers parametrical evaluation of the presented prediction methods ... 65
ix
6.1
Evaluation of algorithm with exact prediction ... 66
6.1.1
Types of prediction errors ... 66
6.1.2
Evaluative indicators for algorithms with exact prediction ... 67
6.2
Evaluation of algorithms with interval prediction ... 68
6.2.1
Evaluative indicators for algorithms with interval prediction ... 68
7
Experimental evaluation of the presented methods ... 68
7.1
Averaging method ... 71
7.2
Shifting window ... 71
7.3
Exponential smoothing ... 74
8
Experimental comparison of predictive accuracy of the presented methods ... 76
9
Conclusions ... 77
Chapter 6. Conclusions and Future Work ... 79
1
Conclusions ... 79
2
Future work ... 80
Bibliography ... 83
xi
List of Figures
Figure 1. Extraction from a list of quality dimensions identified by [9]. ... 6
Figure 2. Classification of proposals for quality dimensions, adapted from [15]. ... 8
Figure 3. Data quality dimension components. ... 9
Figure 4. The risk of low-quality data propagation in a healthcare BI. ... 16
Figure 5. Healthcare BI scenario. ... 17
Figure 6. Possible data quality problems in a healthcare environment. ... 19
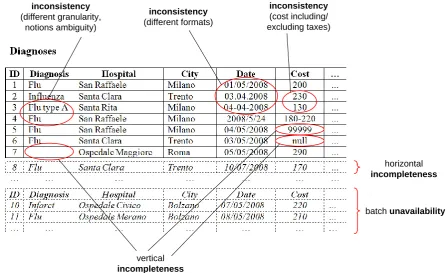
Figure 7. Completeness and consistency problems in the DW ... 21
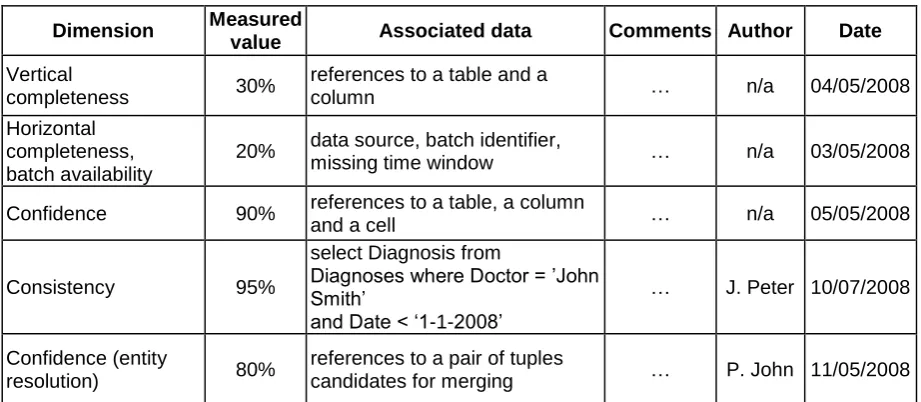
Figure 8. Example of the quality metadata association with raw and surrogate data in a DW. .... 23
Figure 9. Effects of data completeness and consistency on report quality ... 24
Figure 10. Mapping of raw data quality properties into report quality properties. ... 25
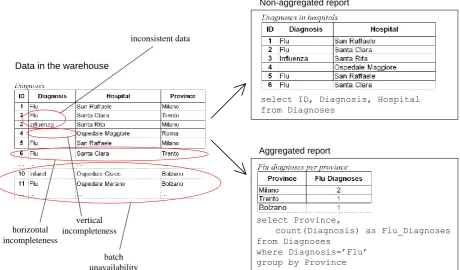
Figure 11. Effect of completeness issues on reports. ... 25
Figure 12. Effect of consistency issues on reports. ... 26
Figure 13. Effects of data confidence on report quality. ... 26
Figure 14. Effect of confidence issues on reports. ... 27
Figure 15. Interactive quality-aware report. ... 28
Figure 16. Quality-aware reporting and interaction model in a BI environment. ... 29
Figure 17. Functional decomposition of quality-aware BI architecture. ... 30
Figure 18. Web of meanings vs. web of links. ... 32
Figure 19. Main processes and the related data assets in the ENS. ... 33
Figure 20. Relevance of data quality dimensions to each stage of a dataflow in the ENS. ... 35
Figure 21. Sample consistency issues in the ENS. ... 36
Figure 22. Example of new entity creation: ... 38
Figure 23. Data staleness issue of entity composed from multiple sources S
1, S
2and S
3. ... 40
Figure 24. Attribute-level and entity-level quality measurement. ... 41
Figure 25. Conceptual model of popularity ranking in the ENS. ... 43
Figure 26. Query processing using popularity lists. ... 44
Figure 27. Sample distinctiveness threshold function for new entity creation. ... 45
Figure 28. Example of new entity creation with evaluation of its distinctive uncertainty
.. 48
Figure 29. Example of search result for query “Amsterdam” in the ENS ... 50
Figure 30. Extended (full) representation of entity “Morey Amsterdam” in the ENS. ... 50
Figure 31. Goals, methods and workflows for staleness measurement for different types of data
sources for the ENS. ... 55
Figure 32. Example of potential data staleness issue in an article from Wikipedia. ... 56
Figure 33. Possible cases of staleness measurement (eq. 5.1) ... 58
Figure 34. Example of prediction of element’s update by enhanced averaging method. ... 61
Figure 35. Irregular updates delimitation by shifting window. ... 61
Figure 36. Example of exponential growth of weights associated with updates in each PTI. ... 63
Figure 37. Example of staleness estimation with exponential smoothing method. ... 65
Figure 38. The possible outcomes of data staleness prediction. ... 67
Figure 39. Yearly updates for two sample articles (A and B) of update rate 5000. ... 69
Figure 40. Average yearly updates of selected articles with first revision ≥ 2006-01-01. ... 70
Figure 41. Error rates of enhanced averaging method. ... 71
Figure 42. Error rates of shifting window method with window size of 1 month. ... 72
Figure 43. Error rates of shifting window method for tick size of 6 hrs. ... 72
Figure 44. Error rates of shifting window method for tick size of 12 hrs. ... 73
Figure 45. Error rates of shifting window method for tick size of 24 hrs. ... 73
Figure 46. Error rates of exponential smoothing method with parameter α=0.05. ... 74
xii
Figure 48. Error rates of exponential smoothing method for tick size of 6 hrs. ... 74
Figure 49. Error rates of exponential smoothing method for tick size of 12 hrs. ... 75
Figure 50. Error rates of exponential smoothing method for tick size of 24 hrs. ... 75
Figure 51. Error rates of exponential smoothing method for tick size of 48 hrs. ... 75
Figure 52. Error rates of exponential smoothing method for tick size of 72 hrs. ... 76
Figure 53. Algorithmic minimal error rates for selected articles. ... 76
Figure 54. A graphical representation of completability, adapted from [127]. ... 97
xiii
List of Tables
Table 1. Quality dimensions addressed by major researches in DQ field, adapted from [15]. ... 7
Table 2. Freshness factors and metrics according to [45]. ... 11
Table 3. Base notions for measurement of data quality in the ENS. ... 41
Table 4. Logical table for
staleness coefficient ... 64
Table 5. Parameters to store per data element for the proposed staleness measurement methods
considering existing loads of queries and updates. ... 66
Table 6. Correctness of update predictions with respect to real updates. ... 68
Table 7. Articles revision groups ... 69
1
Chapter 1
Introduction
C
HAPTER
1.
I
NTRODUCTION
1
M
OTIVATION AND PROBLEMS
“Business intelligence (BI) systems combine operational data with analytical tools to present complex and competitive information to planners and decision makers” [1] is the generic description of a BI concept. For the decades that BI studies took place, there was a lot of work done and research challenges solved for components of an entire scope of a simplified BI architecture in Web era. As such an architecture, BI can be seen as getting data in a data warehouse (ETL, integrations, matching, deduplication, cleansing, etc.) and getting data out of it (reporting, OLAP, analytics, etc.) [2].
Given the role of output data and its influence on business decisions [3], it is undisputable that such data must be of a proper quality level for data stakeholders. Given that, there must be certain measurement approaches and control mechanisms enforcing required level of data quality. In fact, there are number of ready-to-go solutions from the key BI software providers that allow to measure and control quality of data: MS SQL Server 2012 ‘Knowledge bases’ for data quality services from Microsoft, ‘Information server data quality module’ from IBM, ‘Business objects’ from SAP and others. All of these data quality components primarily serve for data deduplication, error correction and standardization with help of natural language processing (NLP) and ranking algorithms. Due to the wide scope of notion of ‘data quality’, none of those components aim to get objective measures of quality level of data. In fact, whether data is of high quality, depends on its intended or potential use. Hence, it is the data consumers who decide if the data they have is of high quality, and this decision is usually based on a number of measurable data characteristics (quality dimensions), either objective or subjective. Hence, the ultimate questions for researchers in data quality might be ‘Who is thedecision maker or data consumer and how they are going to consume the data?’. Without answering this question, the research in most cases is limited to a scope of a particular system, as it was noted in [1].
However, definite pervasive research challenges do exist in data quality. One of those is defining and objectively measuring data quality, which is composed of a set of quality dimensions. Hence, among the key challenges in this area would be: 1) understanding of a compound notion of data quality and 2) elaboration of methods for objective measurement of quality dimensions.
In our work, we focused on one of those dimensions that play an important role in representing time-related aspect of data quality, but it is underexplored in the research community. ‘How stale data do we have at hand, and hence, how much can we trust it is still valid?’ – is the primary question we want to answer studying quality dimension of staleness. By staleness, as we will show in more details, we denote a linearly growing measure of time from an instant when a data element came out of synchronization with its corresponding real world instance.
A great value of such a time-related measure of quality cannot be underestimated in business intelligence, especially of a real-time nature [1]. In spite of the fact that there are companies already having real-time BI systems, both engineers from industry and researches lack objective data-driven1 quality measures for the time-related quality dimensions. None of the key vendors of BI software for management of data quality (Microsoft, SAP, IBM) deal with measurement of a quality dimension of freshness, timeliness or another time-related one. However, in some cases, such time-related quality measure in BI can be success-critical and simply vital for the entire company, like Continental Airlines [4], distributing its resources in accordance with current state of flights (on time/delayed/cancelled) for each of the company’s traveler or supplier.
Chapter 1. Introduction
2
Of course, large size companies like Continental Airlines or Yahoo!, have a number of qualified professionals that implement ad-hoc solutions for specific data quality challenges their companies confront. Nevertheless, lack of widely applicable methods to objectively measure data quality dimensions comes from inability to have a single goal of data usage that the methods should work for. For example, consistency usually denotes correspondence of data elements to required schemas or values. Still, schemas or business logic, as well as notion of acceptable degree of correspondence to them which ultimately defines consistency level of data, may vary from one application to another. Another example is validity, which primarily denotes an extent or correspondence of data to its original entity in the real world (stored address in a database of a person vs. real address of that person at current time). Due to inability to verify data at hand against most of entities from the real world, this quality dimension’s scope is normally limited to semantic validity for reference data (sources of truth) or known rules (valid intervals and values for specific types of data, like date, month, year, etc.).
From the other side, data quality scope is much wider than measurement of certain quality dimensions and their exploitation in context of an information system. Essence of a compound notion of data quality can be best demonstrated while end customer of a system is involved, and the entire process from getting and processing data out of the real world (or an origin source system) to its delivery to the end customer, is demonstrated via a prism of data quality. For these purposes, beyond the context of a particular quality dimension, we study a system environment. It is essential to provide such a scope in order to reduce a gap between scientific approach to measurement of a compound system-wide characteristic of data quality, and ultimate data consumers.
Demonstration of a sample real life business intelligence use case scenario, that involves user interaction, completes a logical data quality assessment triad used in this work by closing a conventional data life cycle – from data origination, to processing, assessment and consumption. This ultimate abstraction level provides necessary contextual aggregation of the other two levels in order to enable judgment by the end customer whether assessed data fits for ones use. At this level, it is also important to understand how data quality dimensions will affect each other, as well as how they will influence perception of the compound DQ concept at the consumer level.
Hence, to tackle the key problems of understanding and assessing a compound notion of data quality, in our work we will consider use cases of three different abstraction levels – Application, System and Dimension, which we explain below.
2
O
UR PROPOSITION AND OUTLINE OF THE THESIS
Our ultimate goal in this work is to demonstrate in context of data quality a connection of originators of data in the real world (which are usually humans) with the corresponding data consumers (which are usually humans as well) in the scope of BI applications in the Web era and heterogeneous information systems, providing objective automated measures of a compound notion of data quality with emphasis on one of key time-related and data-driven quality dimensions that is underexplored among researchers and practitioners – data staleness. For that, we explored three different use cases with context of Application, System and (quality) Dimension.
In the Application use case, we wanted to understand how the notion of data quality can be understood, measured, and how the measurement results can influence a decision maker which is the main consumer of such measurements in BI. For that, we considered a health care scenario2, where we
highlighted key areas in which we provided data quality analysis and elaboration of quality-aware reports consumable by decision makers. Without such a real world scenario, there is little sense in providing concrete measures for abstract goals. In fact, the biggest limiting factor for the researchers in BI area is its application-oriented nature. In order to make sense of data quality research in context of BI, an instantiation of the above mentioned notions of “operational data” and “decision makers” should be fixed, i.e., which kind of data is used by whom and, ultimately, for which purposes? Nobody can simply answer the latter question, since it is up to ‘decision makers’ to consider relevant information to drive a concrete company according to their fixed goals, whether making more profit, or increasing their presence in a market, or invading a new one, for instance. Hence, in Chapter 3 (Application), we propose an architecture for a typical BI application in a data warehouse environment supporting execution of a health
2
3
care scenario. In this architecture, we focus on its reporting part which comprehends methods for extraction, processing, aggregation and presentation of data from various sources to data stakeholders such as decision makers. We describe possible reasons for data at the report level to suffer from quality issues, considering human/computer aspects relevant to data processing phases from source systems to aggregation level. In particular, we focus on quality dimensions of consistency, completeness and confidence which we believe are among the most important quality characteristics in such a BI application. For these dimensions, we demonstrate possible contextual quality issues and consequences of their aggregation and propagation to reporting level, where decision makers eventually consume quality-aware reports.
In the System context, continuing exploration and aiming at getting objective measurement of a compound notion of data quality in a user-centric environment from the previous chapter, we were looking for data management system that possessed the following properties. It should take both structured and semi-structured data of different granularity from various sources on the Web, integrate it and serve data consumers (users) who are the ultimate assessors of data quality in such systems. Moreover, we wanted to thoroughly explore certain types of data in context of their quality, since not all data is suffered to the same extent from quality problems, as SAP research revealed [5]. In fact, in web-based systems it is the customer data that suffers the most. All those properties we found instantiated in a system called Entity Name System or ENS [6], which manages descriptions of unique entities that may represent potentially anything in the real world.
In Chapter 4 (System) we show how one can resolve data quality issues by breaking them down and exploring proper quality dimensions in a system like ENS. In particular, we elaborate and formalize dimensions of consistency, staleness, popularity, distinctiveness and representational importance. We show how one can instantiate the dimensions for measurement at necessary granularity levels (data value / entity / database); we demonstrate how the measured values can be used in the ENS to fulfill one of its ultimate goals – delivery of a high quality data to an end user.
Chapter 5 (Dimension) explores deeper one of the most important but currently underexplored data quality dimension, which we study in the system context of the previous chapter – data staleness. It follows a corresponding chapter of state of the art where we present an overview of existing definitions and measurement methods of this dimension, seen from both data and system perspectives. While proposing our notion of data-driven staleness dimension, we confront it with a set of key requirements that each objectively measurable data quality dimension should possess (e.g., feasibility of its measurement, interpretability of measures, etc.). After setting the notion of staleness, we propose base methods to objectively measure it: naïve averaging, shifting window and exponential smoothing. For their accuracy evaluation, we used history of updates of articles from an online encyclopedia – Wikipedia. We also explore possible options for delivery of staleness measurement results to a subject consuming them (which can be a user or a software component, for instance). We provide parametrical analysis of cost of system resources for usage of one or another delivery method.
Generalizing approaches for measuring of a time-related data quality aspect, we propose metrics for evaluation of overall performance of the algorithms measuring this dimension.
2.1
O
UR CONTRIBUTIONS
The main contributions provided in this thesis falls into data quality definition and assessment areas. In particular:
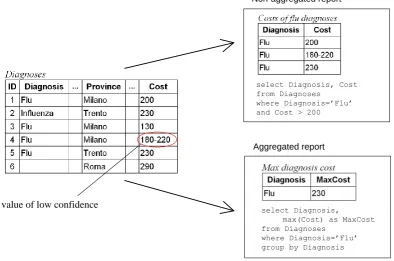
- we define the notion of data quality and discuss key quality dimensions for one of typical quality-aware BI applications; we discuss intra-dimensional effects of sample quality dimensions of completeness, consistency, confidence for aggregated and non-aggregated reports;
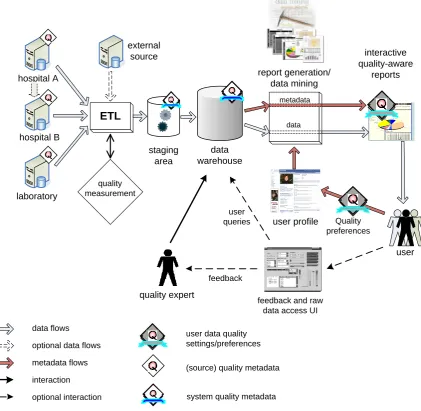
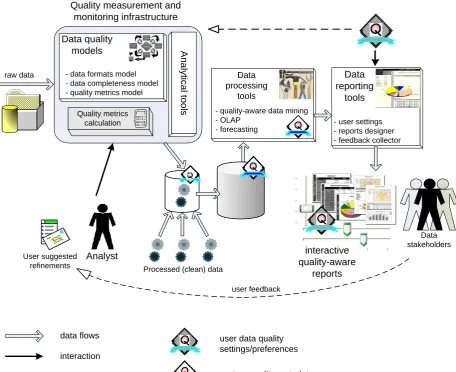
- we propose a report quality aware data warehouse architecture, together with a notion of quality-aware reports in a BI environment, that aims at computation and propagation of quality metadata to the report level, considering user quality feedback; we discuss related aspects of propagation and aggregation of potential quality issues from source systems up to the report level in a data warehouse.
Chapter 1. Introduction
4
data (dimensions of consistency and distinctiveness) and outgoing data (dimensions of popularity, representational importance and staleness), covering entire data lifecycle from data originators to consumers;
- following current state of the art and in accordance to key requirements to objectively measureable data quality notions, we define a data-driven notion of staleness;
- we propose different space-efficient methods for measurement of data staleness, comparing their update prediction accuracy we examined on articles update metadata from Wikipedia;
5
Chapter 2
State of the Art
C
HAPTER
2.
S
TATE OF THE
A
RT
A classical concept of “product quality” established in the era of industrial revolution [7], less than a century after served as one of origins for concept of “data quality”. Some approaches for understanding of quality were common for both of them. However, certain aspects of data use in a virtual world coupled with its ubiquity in a wide range of applications, led to such problems that quality assurance industry normally did not have. One of those is certification and standardization of real world product vs. data product. In the real world, an extensive corpus of various standards and certification methods has been developed since the beginning of industrial era. In spite of few attempts to come up with data quality standards (like ISO 8000), there is little one can done in standardization in this area. For example, can someone set a pervasive standard for data freshness or data completeness? Even if treated separately for different types of applications (like safety-critical, operational, etc.), it is nearly impossible to have those standards universal.
Chapter 2. State of the Art
6
1
D
ATA QUALITY AND QUALITY DIMENSIONS
Researches of various fields looked at problems of data quality (DQ) differently. Statisticians began addressing those problems in the late 60’s, trying to resolve duplicates in statistical datasets. In the 80’s management-oriented research started investigation of methods for detection and quality problems elimination in data manufacturing systems. In the beginning of 90’s computer scientists began research of definition, assessment and improvement of data quality in databases and data warehouses. As for now, they concentrate in the following main research streams if the DQ field:
1. Definitions of DQ dimensions;
2. DQ analysis (root causes analysis of DQ);
3. DQ assessment (current DQ level assessment and definition of a gap between current and required DQ level);
4. DQ improvement (solution for a DQ problem; monitoring of its effectiveness).
An application of data mining algorithms for the DQ assessment and improvement (data auditing) was introduced by [8]. Apart from these key challenging directions, specificity of DQ application raised such issues as:
5. DQ mining (application of data mining algorithms to derive “quality data”); 6. DQ visualization (representation of the data quality to a user).
From the methodological point of view, DQ dimensions and methodologies form a basis for the following major research issues in the DQ:
1. Models to represent data, data schemas and business processes of an organization; 2. Techniques to provide algorithms, heuristics to solve a given DQ problem; 3. Tools and frameworks to solve DQ problems and to provide DQ services.
Given available DQ tools and techniques, DQ methodologies support the selection of the most efficient approaches to DQ assessment and improvement while data quality dimensions are the components by means on which a compound and context-dependent notion of data quality can be better evaluated for fitness to a certain system or business process.
Since the middle of 90’s computer scientists started active research in the DQ field. Many dimensions to capture various quality characteristics of the data have been identified by them (for example, some of about 180 dimensions proposed by pioneers in the DQ of computer science [9] see in a list in Figure 1).
Ability to be joined with Acceptability
Age Auditable Breadth of data Clarity of Origin Consistency Convenience
Ability to download Access by competition Adequate detail Aggregatability Authority Clear data Completeness Conciseness Accessibility Adequate volume Alterability Availability Certified data Compactness Confidentiality Creativity
Ability to upload Accuracy Aestheticism Believability Clarity Compatibility Compressibility Integrity etc. Figure 1. Extraction from a list of quality dimensions identified by [9].
Each quality dimension, like one of those presented in the figure above, intends to describe a specific aspect of a compound notion of data quality.
Authors in [10] propose an information quality model based on a concept of data quality as “fitness for use”, that is based on a user-centric view. However, most researches in the DQ field providing quality dimensions analysis ( [11], [12], [13], [14], etc.) define them either in context of their projects (context dependent works where the dimensions play specific practical role; for example, too narrow notion of consistent representation defined in [9] as “the extent to which data is presented in the same format”) or in terms of the most important features of “relevant” dimensions (based on public surveys or theoretical investigations; for example, objectivity is defined in [9] as “the extent to which data is unbiased, unprejudiced and impartial”). In the latter case, “relevant” means the most significant dimensions for a generic task in a wide range of applications.
7
for the same dimensions). It should be noticed that up to now there is no firm definitions for the meaning of each dimension as well as there is no agreements on the set of important dimensions to use. This is because subjective nature of definition of data quality itself. Some authors define it as “fitness for use” [9] while others see it as “the distance between the data views presented by an information system and the same data in the real world” [16]. The later definition makes it difficult to assess the quality in case of data acquisitions from sensors. Another reason for absence of standard definitions of data quality is specific requirements for usage of data in particular types of applications.
Table 1. Quality dimensions addressed by major researches in DQ field, adapted from [15].
Dimension [16] [9] [17] [18] [19] [20]
Accuracy X X X X X X
Completeness X X X X X X
Consistency X X X X X X
Timeliness X X X X X
Currency X X X
Volatility X X
Interpretability X X X X
Ease of understanding X X X
Reliability X X X X
Reputation X X X
Relevance X X X
Accessibility X X X
Security X X
Value-added X X
Appropriate amount of data X X
Availability X X
Response time X X
The table above has been populated with those quality dimensions found at least in two of the selected representative works, among which are:
[16] that defined data quality dimensions using mapping functions from real world to information system. The mapping bases on ontological model.
[9] that made their list of the dimensions and defined them from user perspective by interviewing data customers.
[17], authors in which have concluded their list of dimensions working in the project “Foundations of Data Warehouse Quality”. User role in a data warehouse environment was taken as a classification basis for that list (in particular, Design and Administration Quality, Software Implementation Quality, Data Usage Quality and Data Quality).
[18] that represents empirical quality assessment from 2 perspectives: 1) automatic DQ assessment (conformance to defined business rules); 2) physical DQ assessment (ensures accuracy of data values by comparing them with real values by observations, surveys, confirmation with physical objects/processes owners, etc.).
[19] that defines data quality dimensions and querying methods for molecular biology information systems (MBIS). In particular, they describe querying plans that assure quality of the resulting data received from corresponding sources. Their more recent work [21] comprehensively considers completeness model that mediators use in query answers planning. Such usage of mediators to plan getting a high quality data may be a part of data quality management in BI.
[20] that defines the quality metrics connecting context independent characteristics with context dependent feature – data utility. In their framework authors revise definitions of quality metrics along with assessment techniques to incorporate contextual issues.
Chapter 2. State of the Art
8
[9], some advances have been also done in definitions, interpretations or applications of those quality dimensions. In [23] authors have extended applicability of dimensions outlined in [9] to operational environment that produces the data, separating quality dimensions into four groups: intrinsic DQ, accessibility DQ, contextual DQ, representational DQ.
To represent a proper classification of the approaches for data quality dimensions definitions from the works above, we will use the following classification attributes proposed by [15]:
1) Modeling view on data – the data perspective taken for definitions of quality dimensions: a. schema (intensional definition of data, such as definition of a table),
b. format (data representation, format of actual values),
c. instance (extensional definition of data referring to the object from real world). 2) Measurement view on data– shows point of view for data quality assessment:
a. process (assessment of processes producing the data, e.g. data acquisition from sensors, analysis of manual entry of corporate data etc.),
b. system (consideration of the whole information system, e.g. in the case of distributed systems consideration of timeliness of data delivery to a destination node etc.),
c. product (particularly related to the data and its perception from the end-user point of view and thus include subjective dimensions as ease of understanding, etc.).
3) Approach to dimension definition – shows methodology exploited by authors to derive and define the quality dimensions. Among those are:
a. intuitive (dimensions are defined driven by a common understanding of the field), b. theoretical (definitions are based on a new theoretical model),
c. empirical ones (dimensions are derived after a practical experiments, interviews, etc.).
From the selected representative six works, two of those have been developed for a specific project and thus are project-specific. The other four are oriented for generic purposes. We denote the groups in Figure 2 as ‘project-specific’ and ‘generic’ correspondingly.
schema format instance
intuitive
theoretical
empirical
process system product
Measurement view on data
Approach to dimension
definition
Modeling view on data
Wand&Wang96 Wang&Strong96 Jarke99
English99 Naumann99
Project specific
Generic
Even07
Figure 2. Classification of proposals for quality dimensions, adapted from [15].
In fact, as authors in [9] concluded from the existing data quality works, there are three major approaches to study data quality: intuitive, theoretical and empirical. To the best of our knowledge, most of the existing works in DQ up to now follow one of those approaches for definition and study of data quality dimensions and the corresponding metrics.
9
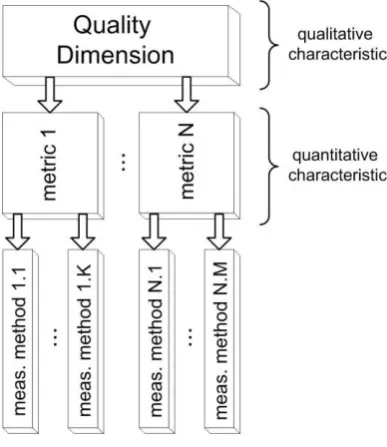
one of the corresponding DQ analysis methodologies – AIMQ [13]. In fact, selection of a methodology is not vital for detection of potential quality issues of a system: its key role during potential quality issues analysis step is in guidance of identification and planning of proper management activities of the most common quality issues in a given system. Normally, system and data analyst are able to come to that from their own experience, which is also supposed by AIMQ. From the other side, AIMQ is the only one among other well-known DQ methodologies that drives objective and domain independent quality evaluation [24]. In fact, each qualitative characteristic of a compound notion of data quality, dimension, may consist from more than one quantitative ones, metrics (for example, consistency dimension may be composed from extensional and intensional parts, as we mentioned before). Those metrics, in their turn, may be measured by means of different methods of using different appliances [25] – see Figure 3 below.
Figure 3. Data quality dimension components.
With a deductive approach and using the quality assessment methodology instantiated for the real-world project we had, for our studies we derived quality dimensions of consistency, staleness, popularity, distinctiveness and representational importance. The former two dimensions (consistency and staleness) are, by their nature, much more suitable for theoretical research in a data management community (we give an overview of the corresponding state of the art for definition and measurement of those quality dimensions in Section 1.1 and Section 1.2). The other three dimensions, in their turn, are extremely dependent on the application context, at the same time having highly volatile definitions and thus, measurement methods. For example, the dimension of distinctiveness can denote simply edit distance for single data cell values or exploit semantics at the same data granularity (e.g., are the two occurrences of a dog in a text refer to the same specimen or two different ones?). From the other side, authors in [26] see attribute distinctiveness as a reverse function of attribute granularity – it reduces with increase of the granularity. With such a context-dependency of definition of the quality dimension of distinctiveness, as well as for popularity and representational importance, these dimensions were left out of key research activities in DQ area. Given the application context we have, in our work we will demonstrate an approach for definition of all of the identified quality dimensions and the corresponding measurement methods.
In a context of quality evaluation of association rules, authors in [27] proposed quality dimensions aggregative or fusion functions which can be min, max, average, or more complex approaches to account specifics of a particular application. For example, overall freshness of a rule may equal to freshness metric of its least fresh data component. Aggregated consistency, from the other side, can be the highest consistency metric found among all components of an association rule.
In our work, we generalized the idea of fusion functions for each quality dimension identified in our system environment. In particular, we came to a proposal for their measurement and aggregation at higher data abstraction levels, coming from single values, records, to data tables and entire databases.
Chapter 2. State of the Art
10
1.1 C
ONSISTENCY
In a geospatial community, consistency dimension of data quality concept is captured with the notion of logical consistency (“degree of adherence to logical rules of data structure, attribution and relationships”) which consists (according to the standard ISO 191913 [28]) of the following parts:
- format consistency: “degree to which data is stored in accordance with the physical structure of the dataset”;
- domain consistency:“adherence of values to the value domains”; - conceptual consistency: “adherence to rules of the conceptual schema”;
- topological consistency:“correctness of the explicitly encoded topological characteristics of a dataset”.
Besides the latter (topological) type of consistency, conceptual (including referential integrity), domain and format consistencies are considered to be the core parts of the data quality notion of consistency in a data management community, both by researchers and practitioners.
Some of pioneers in DQ research refer to consistency in terms of data representation, defining it as an extent of data format homogeneity [12], [9]. They propose to measure it as a difference of 1 and ratio of violations of a specific consistency type to the total number of checks for consistency. Hence, this measure ranges from 0 (data is completely inconsistent for the given checks) to 1 (data is consistent for the checks provided). Sometimes consistency can be seen as correspondence of metadata to the actual data described, as in a hybrid database and file system data management approach [29]. In its wider scope, consistency measures equivalence of data in various systems, applications and processes for making data equivalent [30], [31], [32]. The equivalence means representation by the same data of the same fact. Along with improving consistency, authors in [30] propose to reduce data redundancy across multiple tables or databases by means of manual inspection. A similar notion of consistency gives DAMA dictionary of data management: “the degree to which data values are equivalent across redundant databases” [33]. Authors in [16] examine consistency in terms of data values as well. In particular, by consistency they consider one to one mapping of an information system state to a corresponding state of the real (world) system.
Semantic consistency in [34] refers to the extent of the same meaning of a same concept (compare ‘worker’ vs. ‘employee’); structural consistency in their work is an extent of data representation in the same format (values for ‘date’ field, for instance). Structural consistency can also be seen as conformance of attribute value to specific type of data, its length and pattern [35].
Authors in [36] describe consistency as a fact of accordance of constraints in data with the intended ones, at schema and/or data level. Due to the wide scope of the notion of consistency, authors note that one of the options to clean data and make it consistent is detailed manual or computer-aided data analysis for identification of the quality issues. In [37] authors consider consistency as correspondence by a database to a certain class of constraints that can be discovered by conditional functional dependencies (CFDs) [38] which are an approach to infer dependency rules in a database table between its fields of the form {F1,F2,…}-> {D1,D2,…}. For example, in a sample dataset, country code (F1) and area code (F2)
may unambiguously define city (D1). Another consistency measurement approach [22] suggests to use
database integrity constraints – for relational data – and data edits which are rules manually defined for the input data – for non-relational data.
One of recent summaries on research for data quality dimensions [39] describes consistency in a wider scope for constraints satisfaction: it is a degree of correspondence by a data managed in a system to specific constraints (including database integrity constraints) or business rules. Those rules can be specified manually by user or derived automatically from training data. The measure of consistency is a fraction of tuples in a relation that satisfy the imposed constraints. Some authors propose to see consistency as “the degree to which data satisfies a set of integrity constraints” [40] and measure it as number of elements (values, records, relations) that violate referential integrity [41], [42].
1.2
T
IME
-
RELATED QUALITY DIMENSIONS
In spite of the fact that time-related data quality dimensions have been studied by computer scientists ( [43] explored how to ensure required currency level of materialized views) even before main data quality research in this area began ( [9], [44]), they still lack a comprehensive measurement methodology that can be applied in practice.
11
those. Because of this fact, such time-related quality terms as freshness, timeliness, currency, up-to-dateness, age, staleness, obsolescence may be used to denote the same quality problems (up to antonymous equivalence). Bouzeghoub and Peralta [45] have presented a structured view of some of those terms in the table below.
Table 2. Freshness factors and metrics according to [45].
Factor Metric Definition
Currency
Currency
The time elapsed since data was extracted from the source (the difference between query time and extraction time).
Obsolescence The number of updates transactions/operations to a source since the data extraction time.
Freshness rate The percentage of tuples in the view that are up-to-date (have not been upup-to-dated since extraction time).
Timeliness Timeliness
The time elapsed from the last update to a source (the difference between query time and last update time).
Though Bouzeghoub and Peralta [45] studied freshness-related metrics, they have concentrated on analysis of definitions of data freshness in literature. Measurement of those metrics was out of their scope. One of recent works where authors focus on evaluation of time-related data quality metrics, elaborating a set of corresponding requirements for them is Heinrich et al. [46]. We discuss satisfiability of our notion of data-driven staleness metric to those requirements in Section 3.
Authors of other related works (expanded list of the notions, definitions and measurement methods of those works see in Appendix 1) measure data freshness using known update rate of a monitored element [47]. In [48] they study incorporation of a freshness parameter into OLAP queries processing. The more recent work of Guo et al. [49] presented an integration of currency and consistency requirements of users into SQL queries; Labrinidis and Roussopoulos in [50] proposed an algorithm that allows users to get data based on their performance and freshness preferences. Qu and Labrinidis [51] introduced Quality contracts as a way to express user preferences for speed of data delivery vs. delivery of fresh data; in [52] authors propose a model that allows user to specify freshness constraints and read out-of-date data within a serialized transaction. For example, if prices for an item at an auction change, user may want to get quick response with old prices if staleness of the data will not be beyond a specified threshold. In our work, instead of aiming at satisfaction of user freshness preferences expressed in user queries, we measure current staleness of monitored elements based on prediction of the most recent updates that should have taken place in the past.
Golab et al. [53] define the notion of data staleness (“a difference between time t and the timestamp of the most recent tuple in table T”) and study this quality measure for scheduling of updates for a real-time warehouse, focusing on management aspects of data synchronization between two systems, rather than on data-driven characteristics we pursue in our work.
Definition of freshness and approaches to measure it for data replication was given by [54], where authors study a problem of maintaining a cache at required level of currency, consistency, completeness and presence (defined by users). Cho and Garcia-Molina [55] have shown how web crawler should update its cache to keep it as fresh as possible. Following this work, Denev et al. [56] proposed a framework for assessment of a cashed web page data quality by the means of two dimensions: blur (expected number of changes a crawler would see from a source site) and coherence (number of unchanged pages a web crawler caught for a site snapshot).
Chapter 2. State of the Art
12
abstract from data freshness guarantees which are driven by system properties (choice of the most fresh sources, assurance that sources execute update operation correctly, etc.).
In this work, we study the nature of data staleness that is a data-driven characteristic that depends on data element’s frequency of updates. Hence, our notion of staleness does not depend on system properties that are usually considered in works studying time-related data quality notions in terms of replication and caching techniques (an overview of those notions with corresponding definitions and measurement methods see in Appendix 1 and Appendix 2).
One of such data-driven and time-related intrinsic notions was given by Ballou et al. [61] – by volatility authors refer to data element validity interval, which also depends on frequency of updates in the real world, but not state of currency. For instance, this property well measures historical facts which normally are nonvolatile. However, in our work, we aim at measurement of extent of non-synchronization of frequently changeable data elements stored in an information system and referencing a real world state (see Chapter 4 and Chapter 5 for more details) rather than stable ones. For the same reason, we cannot adopt a notion of temporal inaccuracy of Redman [11] which measures data aspects (how accurately current data element corresponds to the source of truth) rather than temporal ones (how much time passed since current data element represented source of truth). In fact, temporal inaccuracy is considered as a special case of accuracy dimension, taking into account a binary correspondence of a data element (whether a data element up to date or not) while considering time aspects along this dimension.
Cho and Garcia-Molina [62], [63] gave one of the most relevant time-related quality notions and freshness and age, that we adapted in our work, together with notion of currency proposed by Cappiello et al. [64] in the context of time-related factors evaluation problem in a distributed multichannel information system; Cho and Garcia-Molina studied a problem of keeping a cache (replica) of certain web data as fresh as possible by means of discovery of update rate (frequency of updates) of the data in a source system(s), and by the following selection of a corresponding strategy to efficiently synchronize the cache with the source system(s). In our work, we will demonstrate in Section 2.5 of Chapter 4 and in Chapter 5 how our data-driven notion of staleness comprehends and extends the semantics of the most relevant existing notions of freshness, age and currency elaborated by Cho and Garcia-Molina, and Cappiello et al. in a system-driven context.
2
Q
UALITY VIEWS AND QUALITY PROFILES
There are different notions of quality views and quality profiles in different works. For example notion of quality view introduced in [65] and [66] expresses users’ quality processing requirements in terms of workflows. They propose a framework that captures views of users involved into processes of data creation (in particular bio tests) on data quality. Such views can be compiled, embedded into data processing environment and computed during execution of data processes. In spite of the fact that we want to use similar notion of quality views but from the other side of the entire data life cycle – to take processed data from data warehouse and let user tune a personal view to it – we want to use a concept described in these works of data quality-aware accountability of user experience via personalized views. The authors also show how user (data expert) can not only specify personal quality model, but also how one can derive effective criteria for data acceptability.
Data quality profile in [67] denotes a universal view of a particular database rather than a custom view that we aim to have for our quality-aware BI approach. An important notice is made in [67] regarding the fact that quality metadata should have its full derivation history (how, why, by whom an assessment was provided, etc.) to present to the end user not only results of quality assessment, but to give a basis for reasoning on how much user may trust to the results. This fact is important for users in our data warehouse since it gives them ability to manually tune quality metadata parameters (creating own quality profiles or quality-aware views [3]) to see the data assessed in a custom way.
13
3
D
ATA QUALITY FOR BUSINESS INTELLIGENCE
There have been number of works done in data quality with respect to business intelligence and in particular to data warehousing environment, including healthcare area [68] we refer to in the corresponding chapter. However, we are interested in cross-domain works in both data quality and BI that introduce such areas of new challenges as quality-aware data provenance, quality-aware identity resolution, uncertainty in databases due to quality issues and others. Here we will overview related works in these areas.
Since data stored in a database is usually a result of data retrieval and processing stages, for better understanding potential data quality issues we are interested in its provenance [69], which can help us to better understand how a certain piece of data is obtained and why do we have it in a database [70]. A particular interest for the data quality scope we have in recent provenance works dealing with incomplete and probabilistic databases [71] and provenance metadata management [72]. In some cases, a custom metadata annotation and propagation management system for a relational database may be needed to handle quality metadata. Such a system, coupled with the corresponding extension for a query language (SQL) was presented in [73].
Identity resolution is another closely related to data quality area. It essentially tries to find a mapping of an entity representation from the real world or an external information system to the one represented by one or more data items at hand. The key deduplication techniques via record linkage with help of various clustering algorithms are presented in [74]. Rule-based approaches [75], [76] ease the task of mapping at the price of user intervention: creation of a number of training rules must be human-supervised. Another practical approach for the entity resolution is efficient aggregation of approximate match ranks for a given query for a relational DB [77].
Understanding the nature and approaches to deal with uncertainty in data is a twin problem for data quality issues resolution. Number of works proposed a data warehouse design which is driven by data quality and uncertainty [78], [18], [79], [80]. These approaches, in particular, aim to set quality goals, driving the corresponding quality issues resolution processes. Recently, there have been works focusing on design of relational databases dedicated to management of uncertain data [81], [82], [83], [84]. In these works, data in the databases is annotated with a probabilistic value mainly indicating degree of confidence that the data is of high quality and in particular, it is accurate and valid. Various techniques are then proposed to handle those annotations to answer user queries. However, those approaches do not provide solutions to go beyond queries. For example, for generation of a report one should solve a problem of annotation aggregation for data of different granularity like cell, tuple or table. Moreover, different quality measures (consistency, validity, precision, etc.) may and normally, will be used for the annotations. Corresponding representation of a combined measure of those at a report level is another challenge that fell outside of scope of those works.
As data warehouses usually acquire data from various sources, they often meet problem of data fuzziness. Authors in [85] has separated the root causes of data fuzziness into the following categories:
Uncertainty: indicates truthfulness of available information. For example, temperature of a patient may be 38 C. Such statement may be a result of missing data or data received from a sensor that has certain precision or it may be a result of prediction or intentional data concealing (for example to preserve privacy), etc.
Imprecision: non-specificity of available data. For example “the temperature outside is between 30 and 33 C” or “doctor says that the patients doesn’t have flu” or “doctor says the patient is ill with unidentified disease”.
Vagueness: model includes vague concepts. For example “patient Smith is ill”.
Inconsistency: conflicting data. For instance, patient requests reimbursement for an operation 300 euro while hospital reports 250 euro as total costs for that type of operation.
Ambiguity: lack of common semantics, agreement on domain terms, etc. For example, in a report the cost of provided operation may be regarded differently without explicit indication whether it includes taxes or not.
Chapter 2. State of the Art
14
4
O
PEN ISSUES
Understanding of data quality effects on the end customer was always among the key DQ issues. In business intelligence this issue has a particular impact on the entire organization if DQ aspects are ignored or their effect is misunderstood. Intra-dimensional quality relations, as well as their aggregation and propagation to a reporting level, are among another important issues to study in this area.
In an information system context, DQ focus shifts to a deeper understanding of a composed notion of data quality, measurement individual quality dimensions (like consistency, staleness, etc.), and efficient exploitation of the measurement results.
Having diverse set of notions for time-related quality dimensions (see Appendix 2), the DQ community is still open for new approaches for their understanding (especially while looking beyond a system-driven context), efficient measuring and the measured result exploitation and delivery to the end user or a system component.
15
Chapter 3
Data Quality in Business Intelligence
Applications
C
HAPTER
3.
D
ATA
Q
UALITY IN
B
USINESS
I
NTELLIGENCE
A
PPLICATIONS
To start our deeper exploration of data quality concepts, we would like to first outline a bigger scenario where from the one hand, data quality penetrates all the stages of operational data environment, from data origination to processing and consumption, and from the other hand, it invades all those stages in such a transparent manner that normally one may not care of the DQ aspects in small or medium BI applications. However, the effect of those aspects may result in misrepresentation of the real world business related facts.
Chapter 3. Data Quality in Business Intelligence Applications
16
1 I
NTRODUCTION
Nowadays, Business Intelligence (BI) solutions play more and more critical role for the companies using it in their everyday business. The role of BI is particularly important for applications where human health depends on efficiency of a solution, on quality of its design and ultimately (from an IT perspective), on quality of data produced for decision makers like doctors, pharmacists and provisioners. In spite of the fact, that it is not a secret that low quality data from any of a source system may lead to low-quality data represented in reports (provided the data from problematic source is not processed for quality enhancement and it is a part of a final report), a proper design of a BI solution mitigating or solving low-quality data problem is still an enormous problem these days.
Data quality problems in BI applications are becoming more and more pervasive. This is mainly due to the fact that today many organizations tend to employ data warehousing techniques in their everyday data processing routines. They get data from various sources, clean it and transform into a usable for operation form (completing an ETL process), loading data into a data warehouse (DW) or a database. With a wide variety of types of operational environments and data types of source systems, ETL processes become more and more complex as well. Such a complication inevitably leads to risks of having errors in sourced and aggregated data, not speaking of challenge of providing correct data quality enhancement (for example, data cleaning and validation) procedures.
Consider, for example, a BI solution comprising DW, ETL tools, which put data into the data warehouse from various source systems like hospitals or laboratories. For getting data out of the DW, there should be querying, aggregation and maybe data mining modules which will feed report generation component of the BI solution. As a result, reports generated after such a process (depicted in Figure 4) may have such a degree of data quality that they may be unusable for a decision maker, or, even worse, they may be misleading because of misrepresentation of factual data.
department of health hospital A
hospital B
laboratory
data
warehouse report generation/ data mining low-quality
data
low-quality reports
low-quality/ wrong decisions
reports
Figure 4. The risk of low-quality data propagation in a healthcare BI.
17
Patient
Doctor
Laboratory
Other data storing/ processing unites
Data warehouse
Data stakeholders
Hospital
Figure 5. Healthcare BI scenario.
A problem of having quality data seems to be one of the most critical for data stakeholders. Even having an incoherent view on the same data may already lead for far-reaching consequences, like in the following use case.
The Ministry of Health wants to analyze number of flu cases for last season(s) in order to take corresponding measures for the next one. For that, they need accurate estimates (to a statistical error boundary, which is usually negligible compared to data quality errors) to predict demand in doctors’ visits, all flu-related drugs and other medical resources for the next season. From the other hand, it depends on a BI infrastructure whether data from all the sources will be coherent, i.e., treatment of the same patient from the real world as a unique entity in all the information systems, treatment of the same diagnoses pervasively (have an agreement on notions like ‘flu’ and ‘influenza’), etc. More to that, data may be simply incomplete (due to delay in delivery from a source), outdated or incorrect (there is always human factor). When the estimates are provided based on low-quality data, insufficient resources for mitigating flu during next season may be negotiated. As a result, manufacturers may be unable to satisfy non foreseen ad-hoc requests for the necessary drugs which are not reserved in advance; doctors and laboratories may be not well-prepared for an excessive number of patients, providing only limited number of vaccinations.
In the above scenario, not only problems with quality of data from source systems may lead to wrong decisions, but unawareness of such problems do the same. By knowing that report at hand has specific data quality problems with a certain portion of data affected, data analyst would have more options to consider previously hidden quality data issues for the resulting decisions.
One of the key contributions of this work is in demonstration of an approach to the latter problem – enabling quality degree awareness at the report level. For that, we set a notion of quality-aware reports for a BI application. Such reports aimed at exposure of existing key quality issues which we will discuss in Section 2.2. From the other hand, we have to keep in mind that those reports are normally used at executive level for which information in the reports must be presented in “ready-to-act” way. The stakeholders of such reports are seeking at understandable representation of potential quality issues underlying the data. For example, how useful could be a report indicating 90% consistency and 7 days staleness of its data? Simply exposure of a measured quality degree does not solve the problem.
Chapter 3. Data Quality in Business Intelligence Applications
18
also take corrective measures for enhancing current data or prevent from error re-occurrence by improving related data handling processes. For example, a report may demonstrate low confidence in a summary of certain p
![Table 1. Quality dimensions addressed by major researches in DQ field, adapted from [15]](https://thumb-us.123doks.com/thumbv2/123dok_us/606500.2060325/21.595.153.458.190.434/table-quality-dimensions-addressed-major-researches-field-adapted.webp)
![Figure 2. Classification of proposals for quality dimensions, adapted from [15].](https://thumb-us.123doks.com/thumbv2/123dok_us/606500.2060325/22.595.136.473.396.673/figure-classification-proposals-quality-dimensions-adapted.webp)