REVIEW
Prognostic value of long non-coding
RNA GHET1 in cancers: a systematic review
and meta-analysis
Dingding Wang
1†, Hong Zhang
1†, Xiaolian Fang
2, Xue Zhang
1and Honggang Liu
1*Abstract
Background: A number of studies have demonstrated the critical role of long non-coding RNA gastric cancer high expressed transcript 1 (GHET1) in many cancers. This meta-analysis provides an evidence-based evaluation of the prognostic role of GHET1 in cancer.
Materials and methods: Literature searches were conducted in several databases including Medline, Cochrane, EMBASE, CNKI, and Wanfang. The pooled odds ratio (OR) and hazard ratio (HR) with 95% confidence interval (CI) were used to evaluate the role of GHET1 in cancer. The study protocol was registered at PROSPERO (ID: CRD42018111252).
Results: Sixteen studies, containing 1315 patients, were analyzed in this meta-analysis. The pooled results indicated that GHET1 overexpression was significantly associated with poor overall survival (OS) and disease-free survival (DFS) in cancer. Moreover, up-regulation of GHET1 expression predicted larger tumor size, positive lymph node metastasis, positive distant metastasis, and advanced TNM (tumor-node-metastases) stage in human cancers.
Conclusion: There is a significant correlation between up-regulation of GHET1 and both poor prognosis and advanced clinicopathological cancer characteristics. GHET1 may be a potential prognostic predictor for human cancers.
Keywords: GHET1, Meta-analysis, Cancers, Prognosis
© The Author(s) 2020. This article is licensed under a Creative Commons Attribution 4.0 International License, which permits use, sharing, adaptation, distribution and reproduction in any medium or format, as long as you give appropriate credit to the original author(s) and the source, provide a link to the Creative Commons licence, and indicate if changes were made. The images or other third party material in this article are included in the article’s Creative Commons licence, unless indicated otherwise in a credit line to the material. If material is not included in the article’s Creative Commons licence and your intended use is not permitted by statutory regulation or exceeds the permitted use, you will need to obtain permission directly from the copyright holder. To view a copy of this licence, visit http://creat iveco mmons .org/licen ses/by/4.0/. The Creative Commons Public Domain Dedication waiver (http://creat iveco mmons .org/publi cdoma in/ zero/1.0/) applies to the data made available in this article, unless otherwise stated in a credit line to the data.
Background
Despite great progress in cancer diagnosis and treatment, there were still 18.1 million new cancer cases and 9.6 mil-lion cancer deaths worldwide in 2018 [1]. The treatment prognosis of most cancers remains poor; one of the pri-mary reasons for this is the lack of specific biomarkers for the early diagnosis of most cancers [2]. Therefore, it is necessary to identify novel prognostic markers of cancer for potential clinical application [3–5].
Recently, many studies have indicated that long non-coding RNAs (lncRNAs) play a crucial role in the pro-gression of cancer [6–10]. Some lncRNAs are involved in the modulation of cancer proliferation, invasion, and metastasis. In addition, several studies have found that lncRNAs are potential cancer-specific prognostic bio-markers [2, 11–13]. The lncRNA gastric cancer high expressed transcript 1 (GHET1) is located on chro-mosome 7q36.1 and was originally found to be highly expressed in gastric cancer [14]. In gastric cancer, the up-regulation of GHET1 promotes tumor cell proliferation in vitro and in vivo by physically binding to IGF2BP1, thereby enhancing the interaction between c-Myc mRNA and IGF2BP1; this can enhance the stability of c-Myc mRNA [14].
Open Access
*Correspondence: [email protected]
†Dingding Wang and Hong Zhang have contributed equally to this article 1 Department of Pathology, Beijing Tongren Hospital, Capital Medical
University, Beijing 100730, China
Clinically, several studies have indicated that up-regu-lation of GHET1 is associated with poor prognosis and advanced clinical features in several cancers [14–24]. Most existing studies suggest that GHET1 might be a potential biomarker for predicting the prognosis of human cancers. However, due to limitations such as small sample sizes and discrete outcomes, the findings of a single study may not accurately capture the phenom-enon under examination [14–24]. Thus, we undertook a systematic review and meta-analysis of all eligible studies to perform an evidence-based evaluation of the prognos-tic role of GHET1 in cancer.
Materials and methods
This systematic meta-analysis was conducted accord-ance with the Preferred Reporting Items for Systematic Reviews and Meta-Analyses (PRISMA) guidelines. It has been registered with PROSPERO (ID: CRD42018111252).
Literature search and selection
Literature searches were conducted in several databases, including Medline, Cochrane, EMBASE, CNKI, and Wanfang, up until April 15th, 2019. The search strat-egy was as follows: “GHET1” OR “lncRNA GHET1“ OR “gastric cancer high expressed transcript 1“) AND (“can-cer“ OR “neoplasm“ OR “tumor“ OR “carcinoma“). The search was limited to English and Chinese studies. The references of relevant studies were also retrieved to avoid missing any potentially eligible studies.
Inclusion and exclusion criteria
The inclusion criteria for this meta-analysis were as fol-lows: (1) detection of GHET1 expression in human cancers by quantitative real-time PCR (qRT-PCR); (2) patients in the study were divided into subgroups based on different GHET1 expression levels; (3) prognosis or clinicopathological feature of GHET1 was reported; (4) hazard ratios (HRs) and 95% confidence intervals (CI) were able to be obtained directly or indirectly from the article. In addition, the exclusion criteria were as fol-lows: (1) reviews, editorials, conference reports, case reports, and meta-analyses; (2) non-human tissue stud-ies; (3) studies only investigating the molecular mecha-nisms of GHET1; (4) duplicate publications. The titles and abstracts were first evaluated based on the inclu-sion and excluinclu-sion criteria; the full texts of those reports that appeared to meet the criteria were then further evaluated.
Data extraction and quality assessment
Two researchers (Dingding Wang and Xiaolian Fang) independently extracted data from the selected stud-ies according to uniform data extraction standards; any
disagreements were settled by consensus with a third investigator (Hong Zhang). Extracted data included: first author’s name, publication year, country or region, sam-ple size, cancer type, method for detection of GHET1, cut-off values, treatment data, disease-free survival (DFS), overall survival (OS), and clinical stage of cancer. If the HRs and 95% CIs for DFS or OS were not available in the paper, the data were indirectly extracted from sur-vival curves, based on the approach described previously [25]. The Newcastle–Ottawa Scale (NOS) was used to assess the methodological quality of each study. A study was considered to be high quality if the NOS score was greater than or equal to 6; otherwise, it was considered to be a low-quality study.
Public data and tools
TCGA data, including RNAseqV2 and clinical data, were extracted from the TCGA Data Portal and UCSC Xena project, according to the publication guidelines (http:// cance rgeno me.nih.gov/publi catio ns/publi catio nguid eline s). GEPIA was used to analyze RNAseq data. Dif-ferential expression analysis was conducted using one-way ANOVA. Survival analysis was performed using the Kaplan–Meier method and log-rank test.
Statistical analysis
Pooled HRs and 95% CIs were used to assess the relation-ship between GHET1 expression and prognosis. Odd ratios and 95% CIs were combined to evaluate the rela-tionships between GHET1 expression and clinicopatho-logical factors. If the 95% CI of the combined OR or HR did not overlap 1, the result was considered statistically significant. The I2 and Q tests were used to evaluate the heterogeneity of the meta-analysis. If I2 > 50% or P < 0.05, heterogeneity was considered statistically significant and a random effects model was chosen; otherwise, a fixed effects model was utilized. We also performed a sensi-tivity analysis to evaluate the stability of the combined results. The Begg’s test was used to assess potential pub-lication bias. All statistical calculations were performed using RevMan 5.3 software and STATA software version 14.2 (StataCorp LLC, College Station, TX, USA). Moreo-ver, Engauge Digitizer 10.0 was utilized to extract HRs and 95% CIs from the Kaplan–Meier survival curves. A P value of less than 0.05 was considered to be statistically significant.
Results
Study characteristics
according to the inclusion criteria. Following this, six studies were excluded. The full texts of the remaining 26 articles were reviewed; this resulted in the exclusion of 10 papers due to a lack of eligible prognostic or clin-icopathological information. Finally, a total of 16 studies were included in the meta-analysis (Fig. 1).
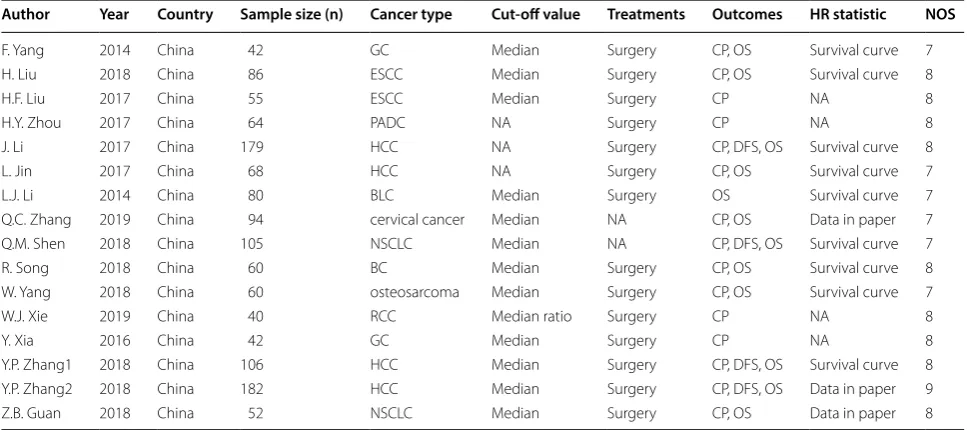
The basic characteristics of the patients in these 16 studies were extracted and are summarized in Table 1. A
total of 1315 patients were included in the current meta-analysis; all patients were from China. The sample size of each individual study ranged from 42 to 182, and the publication years ranged from 2014 to 2019. Fourteen of the articles were published in English and two were pub-lished in Chinese. GHET1 expression in all studies was assessed using qRT-PCR. Moreover, 13 studies provided cut-off definitions for high or low GHET1 expression groups, including the median and median ratio. However, the remaining three studies did not provide explicit cut-off values. The types of cancer evaluated in the evaluated studies included: bladder cancer, breast cancer, cervi-cal cancer, esophageal squamous cell carcinoma, gastric cancer, hepatocellular carcinoma, non-small cell lung cancer, osteosarcoma, pancreatic cancer, and renal cell carcinoma. Patients in 14 cohorts underwent surgical treatments; however, the therapeutic approach adopted in two of the studies was not available. Meanwhile, 15 studies reported the clinical stage of the patients, 12 studies reported OS, and four studies reported DFS. The NOS score ranged from 7 to 9, with an average score of 7.7; this indicates that each of the studies employed high-quality methodology.
Association between GHET1 expression and prognosis
Twelve studies reported OS for eight types of cancer based on GHET1 expression in 1114 patients. As shown in Fig. 2, a fixed-effects model was adopted since there was no statistical heterogeneity (I2= 0.0%, P = 0.783). The Fig. 1 Flaw chart of literature search and selection
Table 1 Basic characteristics of the included studies
BC breast cancer, BLC bladder cancer, ESCC esophageal squamous cell carcinoma, GC gastric cancer, HCC hepatocellular carcinoma, PADC pancreatic cancer, NSCLC non-small lung cancer, qRT-PCR quantitative reverse transcription polymerase chain reaction, CP clinicopathological parameters, OS overall survival, DFS disease-free survival, NOS Newcastle–Ottawa Scale, NA not available
Author Year Country Sample size (n) Cancer type Cut-off value Treatments Outcomes HR statistic NOS
F. Yang 2014 China 42 GC Median Surgery CP, OS Survival curve 7
H. Liu 2018 China 86 ESCC Median Surgery CP, OS Survival curve 8
H.F. Liu 2017 China 55 ESCC Median Surgery CP NA 8
H.Y. Zhou 2017 China 64 PADC NA Surgery CP NA 8
J. Li 2017 China 179 HCC NA Surgery CP, DFS, OS Survival curve 8
L. Jin 2017 China 68 HCC NA Surgery CP, OS Survival curve 7
L.J. Li 2014 China 80 BLC Median Surgery OS Survival curve 7
Q.C. Zhang 2019 China 94 cervical cancer Median NA CP, OS Data in paper 7
Q.M. Shen 2018 China 105 NSCLC Median NA CP, DFS, OS Survival curve 7
R. Song 2018 China 60 BC Median Surgery CP, OS Survival curve 8
W. Yang 2018 China 60 osteosarcoma Median Surgery CP, OS Survival curve 7
W.J. Xie 2019 China 40 RCC Median ratio Surgery CP NA 8
Y. Xia 2016 China 42 GC Median Surgery CP NA 8
Y.P. Zhang1 2018 China 106 HCC Median Surgery CP, DFS, OS Survival curve 8
Y.P. Zhang2 2018 China 182 HCC Median Surgery CP, DFS, OS Data in paper 9
pooled HR for the high GHET1 expression group versus the low group was 2.037 (95% CI 1.626–2.551, P < 0.001). This pooled result indicates a significant association between overexpressed GHET1 and poor OS.
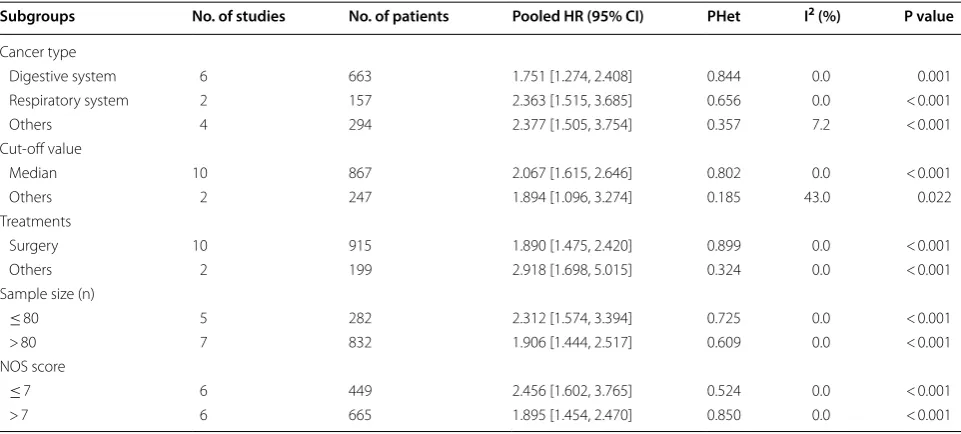
In order to further explore the potential prognostic value of GHET1, a series of subgroup analyses were per-formed based on cancer type, sample size, cut-off value, treatment, and NOS score. The results indicated that, regardless of the cancer type, sample size, cut-off value, treatment, and NOS score, the up-regulation of GHET1 was significantly correlated with poor OS in all subgroup analyses (Table 2).
Moreover, DFS was reported in four studies with a total of 572 patients. There was no statistical heteroge-neity, and a fixed-effect model was utilized (I2= 37.1%, P = 0.190). The pooled results indicated that elevated GHET1 expression was significantly correlated with shorter DFS (HR = 1.362, 95% = 1.051–1.765, P = 0.020, Fig. 3). Overall, these results indicate that GHET1 might be an independent factor associated with sur-vival of cancer patients.
Fig. 2 Meta-analysis for the association between GHET1 expression and OS
Table 2 Subgroup analysis for the association between GHET1 expression and OS
HR hazard ratio, CI confidence interval
Subgroups No. of studies No. of patients Pooled HR (95% CI) PHet I2 (%) P value
Cancer type
Digestive system 6 663 1.751 [1.274, 2.408] 0.844 0.0 0.001
Respiratory system 2 157 2.363 [1.515, 3.685] 0.656 0.0 < 0.001
Others 4 294 2.377 [1.505, 3.754] 0.357 7.2 < 0.001
Cut-off value
Median 10 867 2.067 [1.615, 2.646] 0.802 0.0 < 0.001
Others 2 247 1.894 [1.096, 3.274] 0.185 43.0 0.022
Treatments
Surgery 10 915 1.890 [1.475, 2.420] 0.899 0.0 < 0.001
Others 2 199 2.918 [1.698, 5.015] 0.324 0.0 < 0.001
Sample size (n)
≤ 80 5 282 2.312 [1.574, 3.394] 0.725 0.0 < 0.001
> 80 7 832 1.906 [1.444, 2.517] 0.609 0.0 < 0.001
NOS score
≤ 7 6 449 2.456 [1.602, 3.765] 0.524 0.0 < 0.001
Associations between GHET1 expression and clinicopathological parameters
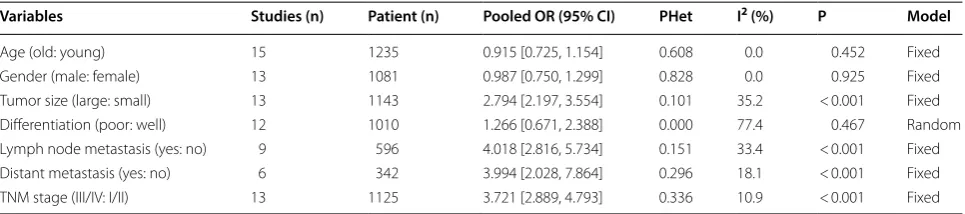
To explore the associations between GHET1 expression and clinicopathological features, further meta-analysis of seven studies was conducted. The pooled results are shown in Table 3. Compared to low GHET1 expression, high GHET1 expression level was statistically correlated with larger tumor size (P < 0.001, fixed model), positive lymph node metastasis (P < 0.001, fixed model), positive distant metastasis (P < 0.001, fixed model), and advanced clinical stage (P < 0.001, fixed model). However, there were no statistically significant relationships between GHET1 expression level and age (P = 0.452, fixed model), gender (P = 0.925, fixed model), and histological dif-ferentiation (P = 0.467, random model). These findings demonstrate statistically significant associations between up-regulation of GHET1 and advanced clinicopathologi-cal features of cancer.
Publication bias and sensitivity analysis
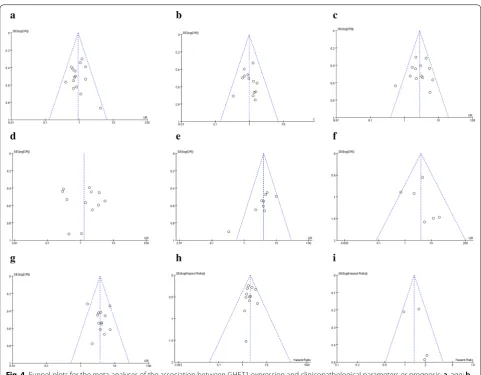
The Begg’s test was conducted to evaluate publication bias among the studies. As shown in Fig. 4a–i, regard-less of age (Pr > |z| = 0.692), gender (Pr > |z| = 0.583), tumor size (Pr > |z| = 0.583), lymph node metastasis (Pr > |z| = 0.076), distant metastasis (Pr > |z| = 0.452), TNM stage (Pr > |z| =0.760), histological differen-tiation (Pr > |z| = 0.732), DFS (Pr > |z| = 0.734), and OS (Pr > |z| = 1.000), the funnel plots of the Begg’s test
showed no obvious asymmetry. This indicates publication bias did not affect the pooled results in the meta-analysis.
In addition, to assess the stability of the combined results, we performed a sensitivity analysis of OS. The sensitivity analysis indicated that no individual study changed the combined results; thus, the OS results can be considered reliable (Fig. 5).
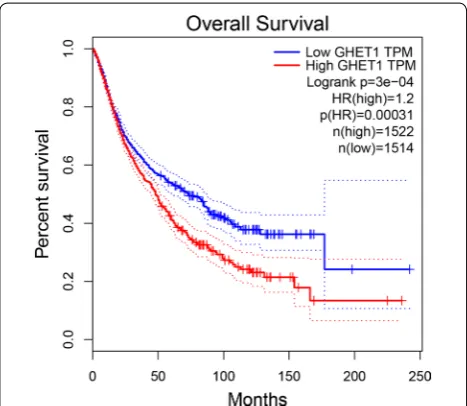
Validation of GHET1 in TCGA dataset
To further verify our results, the expression of GHET1 in eight types of cancer was evaluated using RNAseqV2 and TCGA clinical data. The results indicated that GHET1 was up-regulated in most cancers, including lung squa-mous cell carcinoma (LUSC), kidney renal papillary cell carcinoma (KIRP), liver hepatocellular carcinoma (LIHC), stomach adenocarcinoma (STAD), colon adeno-carcinoma (COAD), breast invasive adeno-carcinoma (BRCA), bladder urothelial carcinoma (BLCA), and esophageal carcinoma (ESCA) (|Log2FC| Cutoff > 1, q-value < 0.01, Fig. 6). Further, the GHET1 high expression indicated poor prognosis in several cancer (Additional file 1: Fig. S1). We merged the expression and prognosis data for cancers of the digestive system, respiratory system, and urinary system, including BLCA, COAD, ESCA, STAD, LIHC, pancreatic adenocarcinoma (PAAD), lung adenocarcinoma (LUAD), LUSC, kidney chromophobe (KICH), and KIRP. According to the median GHET1 expression level, 3036 patients with 10 cancer types were classified into two groups. As demonstrated in Fig. 7, Fig. 3 Meta-analysis for the association between GHET1 expression and DFS
Table 3 Meta-analysis results for the association between GHET1 expression and clinicopathological characteristics
Random random-effects model, Fixed fixed-effects model, OR odds ratio, CI confidence interval
Variables Studies (n) Patient (n) Pooled OR (95% CI) PHet I2 (%) P Model
Age (old: young) 15 1235 0.915 [0.725, 1.154] 0.608 0.0 0.452 Fixed
Gender (male: female) 13 1081 0.987 [0.750, 1.299] 0.828 0.0 0.925 Fixed
Tumor size (large: small) 13 1143 2.794 [2.197, 3.554] 0.101 35.2 < 0.001 Fixed
Differentiation (poor: well) 12 1010 1.266 [0.671, 2.388] 0.000 77.4 0.467 Random
Lymph node metastasis (yes: no) 9 596 4.018 [2.816, 5.734] 0.151 33.4 < 0.001 Fixed
Distant metastasis (yes: no) 6 342 3.994 [2.028, 7.864] 0.296 18.1 < 0.001 Fixed
the GHET1 high expression group had shorter OS than the GHET1 low expression group, confirming that over-expression of GHET1 is correlated with poor OS in vari-ous human cancers (P < 0.001).
Discussion
Accumulating evidence has demonstrated that lncRNAs act as crucial regulators of almost all aspects of physi-ological and pathphysi-ological processes [26–30]. Multiple studies have also indicated that lncRNAs contribute to the carcinogenesis and progression of several tumors [6– 10]. Recently, several studies have reported that lncRNA GHET1 might be related to prognosis in cancer patients [14–24, 31]. Therefore, we performed this meta-analysis of 16 eligible studies to systematically evaluate the prog-nostic value of GHET1 in all cancers.
In the present study, we evaluated the prognostic value of GHET1 in cancer. The pooled HR indicated that GHET1 overexpression was significantly associated with Fig. 4 Funnel plots for the meta-analyses of the association between GHET1 expression and clinicopathological parameters or prognosis; a, age; b, gender; c, tumor size; d, differentiation; e, lymph node metastasis; f, distant metastasis; g, clinical stage; h, OS; i, DFS
poor OS and DFS in cancer. Moreover, further subgroup analyses indicated that elevated GHET1 expression was significantly correlated with OS in each subgroup, regard-less of the analysis model, sample size, cut-off value, treatment, cancer type, and NOS score. The pooled data illustrated that GHET1 overexpression was significantly associated with larger tumor size, positive lymph node metastasis, positive distant metastasis, and advanced TNM stage. Unexpectedly, we failed to identify an asso-ciation between GHET1 expression and histological dif-ferentiation. However, these results might be not reliable because there was significant heterogeneity among the included studies. Overall, high GHET1 expression was an unfavorable risk factor for survival outcomes in patients with cancer; thus, GHET1 might be a valuable biomarker for a variety of cancers. To our knowledge, this research is the first meta-analysis focusing on the prognostic value of GHET1 in human cancers.
Many studies have tried to illustrate the correlation between high GHET1 expression and cancer prognosis; however, the molecular mechanism of GHET1 remained unclear [14, 17–19, 23, 24]. Feng et al. found that GHET1 overexpression promotes gastric cancer cell proliferation by binding to IGF2BP1 and enhancing the stability of c-Myc mRNA [14]. Further, GHET1 overexpression could prohibit cellular apoptosis by promoting the expression of Bcl-2 and could contribute to the development of mul-tidrug resistance by promoting the expression of MDR1 and MRP1 in gastric cancer [16]. Xia et al. study revealed that down-regulation of GHET1 could prohibit the G1-S phase transition of the cell cycle in gastric cancer cells by modulating the expression of P21, cyclin, and CDK [21]. Moreover, upregulation of GHET1 could be induced by hypoxia in gastric cancer cells, and the depletion of GHET1 c significantly enhanced the CpG island meth-ylation of EGFR, which plays a crucial role in the metas-tasis of cancers [32]. In hepatocellular carcinoma, Ding et al. found that high GHET1 expression could be acti-vated by H3K27 acetylation, and could promote the pro-gression and migration of cancer by physically binding to ATF1 [20]. In addition, Jin et al. showed that GHET1 can bind to the enhancer of EZH2 and recruit PRC2 to the promoter region of KLF2; KLF2 acts as a tumor sup-pressor in hepatocellular carcinoma and is epigenetically repressed [24]. As for lung cancer, Guan et al. revealed that GHET1 depletion inhibited the proliferation, inva-sion, and epithelial-mesenchymal transition (EMT) of cancer cells by inhibiting the LATS1/YAP pathway [19]. Additionally, several studies have reported that GHET1 can promote EMT in esophageal squamous cell carci-noma, breast cancer, colorectal cancer, osteosarcoma, renal cell carcinoma, and bladder cancer [17, 18, 22, 31, 33, 34]. Other studies have also shown that GHET1 pro-motes the progression of cancer and might be a thera-peutic target of cancer [35, 36].
The present meta-analysis has several limitations. First, this meta-analysis included only 16 studies, and Fig. 6 The expression levels of GHET1 in eight types of cancer tissues and normal tissues in TCGA cohort
all of these studies were from China. Therefore, the results might only apply to Asian or Chinese patients, which may limit the representativeness of the results. The validation tests using data from TCGA make up this disadvantage in some extent. Second, the HRs and 95% CIs in several studies could not be directly obtained. Thus, we extracted the data from the Kaplan– Meier curve in these studies, which might introduce statistical errors. Finally, the sample sizes of some can-cer types in this meta-analysis were limited; this may have contributed to the heterogeneity and may have affected the reliability of the pooled results for some cancer types. Nevertheless, the results of this meta-analysis should be verified by studies evaluating more cancer types with larger sample sizes.
Conclusions
In sum up, the up-regulation of lncRNA GHET1 expres-sion was significantly associated with poor OS, poor DFS, and advanced clinicopathological characteristics in vari-ous cancers. GHET1 can be considered to be a promis-ing prognostic predictor for human cancers. However, high-quality studies with larger samples sizes and those encompassing more cancer types are still needed to ver-ify these conclusions.
Supplementary information
Supplementary information accompanies this paper at https ://doi. org/10.1186/s1293 5-020-01189 -9.
Additional file 1: Fig. S1. OS plots for each TCGA cohort.
Abbreviations
BC: Breast cancer; BLC: Bladder cancer; ESCC: Esophageal squamous cell car-cinoma; GC: Gastric cancer; HCC: Hepatocellular carcar-cinoma; PADC: Pancreatic cancer; NSCLC: Non-small lung cancer; qRT-PCR: Quantitative reverse tran-scription polymerase chain reaction; CP: Clinicopathological parameters; OS: Overall survival; DFS: Disease-free survival; HR: Hazard ratios; OR: Odds ratio; CI: Confidence intervals; NOS: Newcastle–Ottawa Scale.
Acknowledgements
We thank the overall participates in our research for their help.
Authors’ contributions
Designing the study: HGL Preparing the manuscript: DDW Concept of study: HZ Edit manuscript: DDW and XLF Prepare figures: XZ and HZ Data analysis: DDW and HZ Statistics: XLF. All authors read and approved the final manuscript.
Funding
This study was supported by the National Natural Science Foundation of China (No. 81502493) and Beijing Municipal Administration of Hospitals Clini-cal Medicine Development of Special Funding (No. ZYLX201814).
Availability of data and materials
The datasets during and/or analysis during the current study available from the corresponding author on reasonable request.
Ethics approval and consent to participate Not applicable.
Consent for publication Not applicable.
Competing interests
The authors declare no competing interests.
Author details
1 Department of Pathology, Beijing Tongren Hospital, Capital Medical
Univer-sity, Beijing 100730, China. 2 Department of Otolaryngology, Head and Neck
Surgery, Beijing Children’s Hospital, Capital Medical University, National Center for Children’s Health, No.56 Nanlishi Rd, Beijing 100045, China.
Received: 22 June 2019 Accepted: 27 March 2020
References
1. Bray F, Ferlay J, Soerjomataram I, Siegel RL, Torre LA, Jemal A. Global cancer statistics 2018: GLOBOCAN estimates of incidence and mortality worldwide for 36 cancers in 185 countries. Cancer J Clin. 2018;68(6):394–424.
2. Ng L, Poon RT, Pang R. Biomarkers for predicting future metastasis of human gastrointestinal tumors. CMLS. 2013;70(19):3631–56. 3. Kim JL, Cho KH, Park EC, Cho WH. A single measure of cancer burden
combining incidence with mortality rates for worldwide application. APJCP. 2014;15(1):433–9.
4. Qin L, Chen C, Chen L, Xue R, Ou-Yang M, Zhou C, Zhao S, He Z, Xia Y, He J, et al. Worldwide malaria incidence and cancer mortality are inversely associated. Infect Agents Cancer. 2017;12:14.
5. Fidler MM, Gupta S, Soerjomataram I, Ferlay J, Steliarova-Foucher E, Bray F. Cancer incidence and mortality among young adults aged 20–39 years worldwide in 2012: a population-based study. Lancet Oncol. 2017;18(12):1579–89.
6. Lin C, Yang L. Long noncoding RNA in cancer: wiring signaling circuitry. Trends Cell Biol. 2017;28(4):287–301.
7. Li CH, Chen Y. Targeting long non-coding RNAs in cancers: progress and prospects. Int J Biochem Cell Biol. 2013;45(8):1895–910.
8. Yang G, Lu X, Yuan L. LncRNA: a link between RNA and cancer. Biochem Biophys Acta. 2014;1839(11):1097–109.
9. Dhamija S, Diederichs S. From junk to master regulators of invasion: lncRNA functions in migration, EMT and metastasis. Int J Cancer. 2016;139(2):269–80.
10. Bhan A, Mandal SS. LncRNA HOTAIR: a master regulator of chromatin dynamics and cancer. Biochem Biophys Acta. 2015;1856(1):151–64. 11. Zhou M, Zhao H, Wang Z, Cheng L, Yang L, Shi H, Yang H, Sun J.
Identi-fication and validation of potential prognostic lncRNA biomarkers for predicting survival in patients with multiple myeloma. J Exp Clin Cancer Res. 2015;34:102.
12. Giulietti M, Righetti A, Principato G, Piva F. LncRNA co-expression network analysis reveals novel biomarkers for pancreatic cancer. Carcinogenesis. 2018;39(8):1016–25.
13. Ning L, Li Z, Wei D, Chen H, Yang C. LncRNA, NEAT1 is a prognosis biomarker and regulates cancer progression via epithelial-mesenchy-mal transition in clear cell renal cell carcinoma. Cancer Biomarkers. 2017;19(1):75–83.
14. Yang F, Xue X, Zheng L, Bi J, Zhou Y, Zhi K, Gu Y, Fang G. Long non-coding RNA GHET1 promotes gastric carcinoma cell proliferation by increasing c-Myc mRNA stability. FEBS J. 2014;281(3):802–13.
15. Zhou HY, Zhu H, Wu XY, Chen XD, Qiao ZG, Ling X, Yao XM, Tang JH. Expression and clinical significance of long-non-coding RNA GHET1 in pancreatic cancer. Eur Rev Med Pharm Sci. 2017;21(22):5081–8. 16. Zhang X, Bo P, Liu L, Zhang X, Li J. Overexpression of long non-coding
RNA GHET1 promotes the development of multidrug resistance in gastric cancer cells. Biomed Pharm. 2017;92:580–5.
•fast, convenient online submission
•
thorough peer review by experienced researchers in your field
• rapid publication on acceptance
• support for research data, including large and complex data types
•
gold Open Access which fosters wider collaboration and increased citations maximum visibility for your research: over 100M website views per year
•
At BMC, research is always in progress.
Learn more biomedcentral.com/submissions
Ready to submit your research? Choose BMC and benefit from: 18. Li LJ, Zhu JL, Bao WS, Chen DK, Huang WW, Weng ZL. Long noncoding
RNA GHET1 promotes the development of bladder cancer. Int J Clin Exp Pathol. 2014;7(10):7196–205.
19. Guan ZB, Cao YS, Li Y, Tong WN, Zhuo AS. Knockdown of lncRNA GHET1 suppresses cell proliferation, invasion and LATS1/YAP pathway in non small cell lung cancer. Cancer Biomarkers. 2018;21(3):557–63. 20. Ding G, Li W, Liu J, Zeng Y, Mao C, Kang Y, Shang J. LncRNA GHET1
acti-vated by H3K27 acetylation promotes cell tumorigenesis through regu-lating ATF1 in hepatocellular carcinoma. Biomed Pharm. 2017;94:326–31. 21. Xia Y, Yan Z, Wan Y, Wei S, Bi Y, Zhao J, Liu J, Liao DJ, Huang H. Knockdown of long noncoding RNA GHET1 inhibits cellcycle progression and inva-sion of gastric cancer cells. Mol Med Rep. 2018;18(3):3375–81. 22. Song R, Zhang J, Huang J, Hai T. Long non-coding RNA GHET1
pro-motes human breast cancer cell proliferation, invasion and migration via affecting epithelial mesenchymal transition. Cancer Biomarkers. 2018;22(3):565–73.
23. Shen QM, Wang HY, Xu S. LncRNA GHET1 predicts a poor prognosis of the patients with non-small cell lung cancer. Eur Rev Med Pharm Sci. 2018;22(8):2328–33.
24. Jin L, He Y, Tang S, Huang S. LncRNA GHET1 predicts poor prognosis in hepatocellular carcinoma and promotes cell proliferation by silencing KLF2. J Cell Physiol. 2018;233(6):4726–34.
25. Tierney JF, Stewart LA, Ghersi D, Burdett S, Sydes MR. Practical methods for incorporating summary time-to-event data into meta-analysis. Trials. 2007;8:16.
26. Shi X, Sun M, Liu H, Yao Y, Song Y. Long non-coding RNAs: a new frontier in the study of human diseases. Cancer Lett. 2013;339(2):159–66. 27. Joung J, Engreitz JM, Konermann S, Abudayyeh OO, Verdine VK, Aguet
F, Gootenberg JS, Sanjana NE, Wright JB, Fulco CP, et al. Genome-scale activation screen identifies a lncRNA locus regulating a gene neighbour-hood. Nature. 2017;548(7667):343–6.
28. Bassett AR, Akhtar A, Barlow DP, Bird AP, Brockdorff N, Duboule D, Ephrussi A, Ferguson-Smith AC, Gingeras TR, Haerty W, et al. Considera-tions when investigating lncRNA function in vivo. eLife. 2014;3:e03058.
29. Iwakiri J, Hamada M, Asai K. Bioinformatics tools for lncRNA research. Biochem Biophys Acta. 2016;1859(1):23–30.
30. Shibayama Y, Fanucchi S, Magagula L, Mhlanga MM. lncRNA and gene looping: what’s the connection? Transcription. 2014;5(3):e28658. 31. Zhou J, Li X, Wu M, Lin C, Guo Y, Tian B. Knockdown of long noncoding
RNA GHET1 inhibits cell proliferation and invasion of colorectal cancer. Oncol Res. 2016;23(6):303–9.
32. Yang Z, Wang R, Zhang T, Dong X. Hypoxia/lncRNA-AK123072/EGFR pathway induced metastasis and invasion in gastric cancer. Int J Clin Exp Med. 2015;8(11):19954–68.
33. Xie W, Chen Q, Liu X, Ma M, Yang X, Gong B, Sun T, Chen J. Silencing of the long non-coding RNA GHET1 inhibits cell proliferation and migration of renal cell carcinoma through epithelial-mesenchymal transition. Oncol Lett. 2019;17(3):3173–80.
34. Yang W, Shan Z, Zhou X, Peng L, Zhi C, Chai J, Liu H, Yang J, Zhang Z. Knockdown of lncRNA GHET1 inhibits osteosarcoma cells proliferation, invasion, migration and EMT in vitro and in vivo. Cancer Biomarkers. 2018;23(4):589–601.
35. Huang H, Liao W, Zhu X, Liu H, Cai L. Knockdown of long noncoding RNA GHET1 inhibits cell activation of gastric cancer. Biomed Pharm. 2017;92:562–8.
36. Ni W, Luo L, Zuo P, Li RP, Xu XB, Wen F, Hu D. lncRNA GHET1 down-regulation suppresses the cell activities of glioma. Cancer Biomarkers. 2018;23(1):9–22.
Publisher’s Note