Early human use of anadromous salmon in North
America at 11,500 y ago
Carrin M. Halffmana,1, Ben A. Pottera, Holly J. McKinneya, Bruce P. Finneyb, Antonia T. Rodriguesc, Dongya Y. Yangc, and Brian M. Kempd,e
aDepartment of Anthropology, University of Alaska Fairbanks, Fairbanks, AK 99775;bDepartments of Biological Sciences and Geosciences, Idaho State
University, Pocatello, ID 83209;cDepartment of Archaeology, Simon Fraser University, Burnaby, BC, Canada V5A 1S6;dDepartment of Anthropology,
Washington State University, Pullman, WA 99164; andeSchool of Biological Sciences, Washington State University, Pullman, WA 99164
Edited by Eske Willerslev, University of Copenhagen, Copenhagen, Denmark, and approved August 19, 2015 (received for review May 18, 2015) Salmon represented a critical resource for prehistoric foragers
along the North Pacific Rim, and continue to be economically and culturally important; however, the origins of salmon exploitation remain unresolved. Here we report 11,500-y-old salmon associated with a cooking hearth and human burials from the Upward Sun River Site, near the modern extreme edge of salmon habitat in central Alaska. This represents the earliest known human use of salmon in North America. Ancient DNA analyses establish the species asOncorhynchus keta(chum salmon), and stable isotope analyses indicate anadromy, suggesting that salmon runs were established by at least the terminal Pleistocene. The early use of this resource has important implications for Paleoindian land use, economy, and expansions into northwest North America.
salmon
|
Paleoindians|
Beringia|
ancient DNA|
stable isotopesE
ach year along the Pacific coast of North America, millions of salmon migrate from the ocean to spawn and die in their natal rivers and lakes; however, during the last Ice Age, many of the rivers that today support salmon were blocked by glacial ice, severely restricting salmon ranges (1). A potential glacial refugium for salmon was Beringia, the mostly ice-free landmass that bridged northeast Asia and Alaska (1–3). Evidence for such a refugium comes from studies of present-day diversity and distributions of Pacific salmon (1, 2), but there is little direct evidence of the an-tiquity of salmon spawning runs in North America. Here we con-firm the presence of an anadromous salmon species,Oncorhynchus keta (chum salmon) through ancient DNA (aDNA) and stable isotope analyses of fish remains at the Upward Sun River site lo-cated deep in the interior of Alaska, about 50 km downstream from the modern limit of major spawning areas (Fig. 1). These speci-mens, dating to the terminal Pleistocene, represent the oldest ge-netically confirmed Pacific salmon species in an archaeological context in North America. These data are important for testing competing models of subsistence strategies and diet breadths of Paleoindian populations in the New World (4, 5), as well as for understanding Beringian ecosystem biodiversity.Oncorhynchusis a salmonid genus that includes several Pacific salmon and Pacific trout species; some species of this genus occur as both freshwater resident and anadromous forms, migrating from the sea to freshwater to spawn (6). The spawning behavior of anadromous Pacific salmon results in massive and predictable runs in freshwater streams over a short period, making these fish a potentially valuable human food resource (7). Salmon are also ecologically important because they transport rich marine-derived nutrients into relatively unproductive interior riparian areas (8). Five species of Pacific salmon and one species of Pacific trout presently occur in central Alaskan waters, including Chinook (Oncorhynchus tshawytscha), coho (Oncorhynchus kisutch), chum (O. keta), sockeye (Oncorhynchus nerka), pink salmon ( Onco-rhynchus gorbuscha), and rainbow/steelhead trout (Oncorhynchus mykiss) (1).
Pleistocene-aged remains of Pacific salmon from North America are extremely rare in both paleontological and archaeological
contexts. This scarcity is related in part to the spawning habitat of most salmon species, leading to death in river gravels where re-mains are unlikely to be preserved (9) and to the fragility of fish skeletal elements and their small size (inhibiting recovery), resulting in their underrepresentation in the archaeological record (10). Pa-leontological specimens of Pacific salmon have been recovered from middle Pleistocene sediments in the Skokomish Valley, Washington (United States) (9), and from late Pleistocene sediments at Kam-loops Lake, British Columbia (Canada) (11). Although the remains from both of these locales were morphologically identified as O. nerka, carbon stable isotope analysis of specimens from Kamloops Lake suggests that the fish were likely the landlocked form of O. nerka, known as kokanee (11). Other late Pleistocene paleonto-logical fish remains assigned to Pacific salmon derive from two ad-ditional sites in British Columbia, including Courtenay (Vancouver Island) and Gaadu Din 1 cave (Haida Gwaii) (12, 13). Specimens from the latter site were genetically identified as“salmon,”but the details of the aDNA analysis were not reported (13).
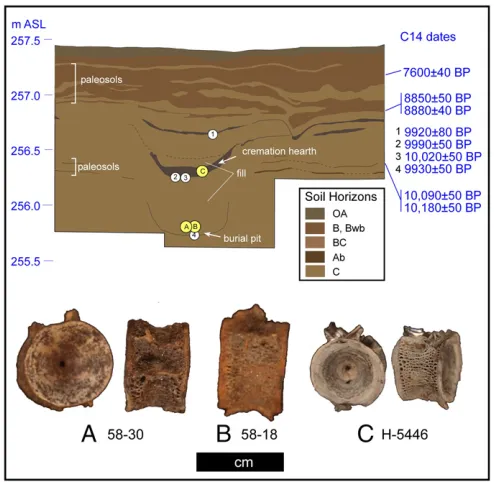
The only report ofOncorhynchusremains from a Pleistocene-age archaeological site in North America comes from Upward Sun River, located adjacent to the Tanana River (a major tributary of the Yukon River) in central Alaska (14) (see alsoSI Text) (Fig. 1). Here, 308Oncorhynchusspecimens were recovered from the central hearth of a residential feature, also associated with a cremated 3-y-old child (15). A double infant burial with associated grave goods was located directly below (40 cm) this hearth. Radiocarbon and contextual data suggest near contemporaneity between the hearth
Significance
Fish bones from the 11,500-y-old Upward Sun River site in interior Alaska represent the oldest evidence for salmon fishing in North America. We used ancient DNA analysis to identify the fish specimens as chum salmon (Oncorhynchus keta), and stable iso-tope analysis to confirm that the salmon were anadromous (sea-run). The exploitation of salmon at this early date is noteworthy because Paleoindians are traditionally portrayed as big-game hunting specialists. Furthermore, the presence of salmon at Up-ward Sun River over 1,400 km upriver from the coast shows that spawning runs had been established by the end of the last Ice Age. The early availability and use of anadromous salmon has important implications for understanding Paleoindian economies and expansion into North America.
Author contributions: C.M.H., B.A.P., and B.M.K. designed research; C.M.H., B.A.P., H.J.M., B.P.F., A.T.R., D.Y.Y., and B.M.K. performed research; C.M.H., B.A.P., H.J.M., B.P.F., A.T.R., D.Y.Y., and B.M.K. analyzed data; and C.M.H., B.A.P., H.J.M., B.P.F., A.T.R., D.Y.Y., and B.M.K. wrote the paper.
The authors declare no conflict of interest.
This article is a PNAS Direct Submission.
Data deposition: The sequences reported in this paper have been deposited in the Gen-Bank database (accession nos.KT693031,KT693032,KT725810, andKT725811). 1To whom correspondence should be addressed. Email: [email protected].
This article contains supporting information online atwww.pnas.org/lookup/suppl/doi:10. 1073/pnas.1509747112/-/DCSupplemental.
www.pnas.org/cgi/doi/10.1073/pnas.1509747112 PNAS Early Edition | 1 of 5
ANTHR
and the burial pit, with a mean pooled age of 9,970 ± 30 B.P. (11,600–11,270 cal B.P.); thus, these represent the oldest known human remains in the North American Arctic/Subarctic (Fig. 2 and SI Text). A total of 29 additional Oncorhynchus specimens were found within the pit fill. The fish remains were mostly fragmentary and over 90% were burned and calcined. The component and burials are culturally affiliated with the Denali Complex, which was widespread in Eastern Beringia from∼12,700 cal B.P. to the early Holocene (3, 16).
The fish vertebrae were morphologically identified as Onco-rhynchus using a modern comparative collection based on their large size, fenestration pattern, and characteristic shape (17) (Fig. 2). Based on overall size and occupation season, based on other fauna, the vertebrae resembled O. keta (Fig. S1and Table S1); however, species-level identifications based on morphology remain ambiguous without genetic confirmation (18, 19). Species distinc-tions are critical to separate salmon from trout and other salmonids, because although some other members of this family are anadro-mous, they do not typically form the extensive and massive spawning runs that make salmon such an exceptional resource (6, 20). Additionally, salmon species differ in habitat requirements, run timing and abundance, and body size and fat content, all of which have implications for understanding past human land use and subsistence strategies (18, 19, 21, 22). aDNA analysis provides more accurate identifications of fish remains, and has recently been suc-cessfully applied to fish assemblages from Holocene archaeological sites in the Pacific Northwest of North America (18, 19, 23, 24).
Genetic identification cannot resolve questions about anadromy because salmon life history pattern is variable. Most Pacific salmon stocks are anadromous; however, natural or introduced freshwater stocks also occur for all species except chum, and captive chum have been reared to maturity in fresh water (25). Stable isotope analysis is an appropriate technique for distinguishing between anadromous and nonanadromous salmon because the isotope ratios of carbon (δ13C) and nitrogen (δ15N) are typically elevated in marine compared with freshwater food consumers (26). This technique has been successfully applied to identify life history patterns in modern salmonid stocks (27–30).
To address the questions of taxonomic identification and life history of the Upward Sun RiverOncorhynchusspecimens, we subjected two unburned vertebral specimens (58-18 and 58-30) to aDNA analysis, one of which (58-18) was also subjected to carbon and nitrogen stable isotope analysis (SI TextandTable S1). An unsuccessful attempt was also made to analyze DNA from a third specimen (H-5446), a nearly complete but calcined vertebra. The three specimens shared the distinctive morpho-logical and overall size characteristics of the larger number of burned and fragmentedOncorhynchusspecimens.
Results and Discussion
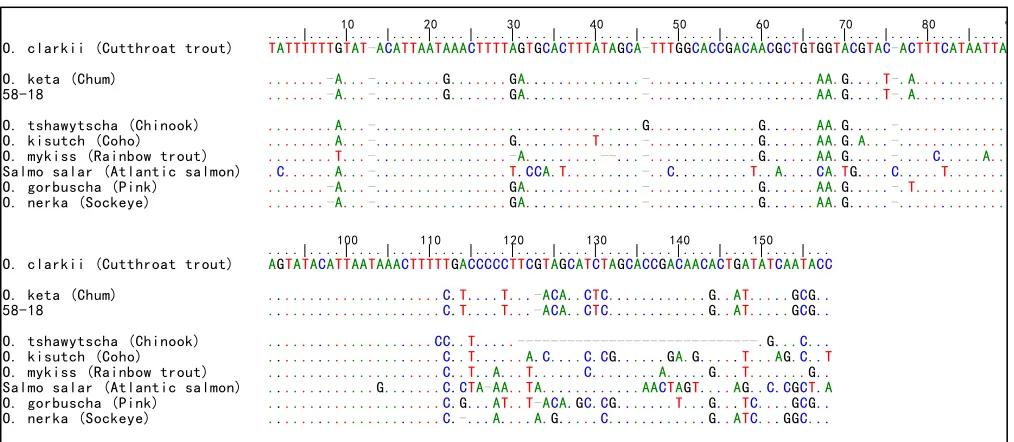
DNA was extracted from the specimens following established methods (SI Text). The extracts for the unburned specimens were successfully PCR-amplified and sequenced for a region of the mitochondrial 12S gene that is useful for discriminating among Pacific salmonids and other fishes (31) (SI Text). Repeated se-quence analysis demonstrated the samples to beOncorhynchus keta (chum salmon) (Table S2). Additionally, one sample (58-18) was analyzed at an independent aDNA laboratory using discriminating fragments of the d-loop and cytochromebregions of the salmonid mitochondrial genome (22), confirming the identification made with 12S (SI Text,Figs. S2–S4, andTable S3). Thus, repeatable and independent analyses of mitochondrial DNA (mtDNA) demon-strate that both samples are chum salmon.
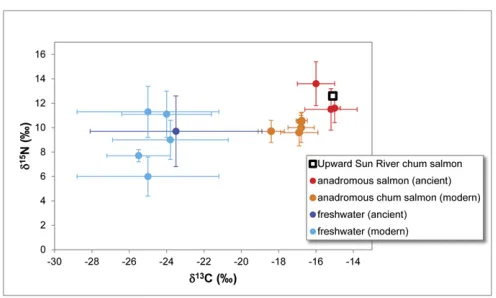
Stable isotope analysis of bone collagen extracted from one of the confirmedO. ketavertebra producedδ13C andδ15N values of
−15.1‰ and 12.6‰, respectively (SI Text). These values are consistent with previously reported isotope values for ancient and modern salmon from Alaska, and are elevated over those for ancient and modern freshwater fishes (Fig. 3 andTables S4and S5). These data indicate that the Upward Sun River chum salmon specimen was anadromous.
The confirmed presence of an anadromous Pacific salmon spe-cies,O. keta, at the terminal Pleistocene Upward Sun River site provides the earliest evidence for human use of salmon in North America, and adds to our understanding of Paleoindian adapta-tions. Previous reports of genetically identified Pacific salmon Fig. 1. Location of Upward Sun River Site, course of the Tanana-Yukon
River and possible course across the Bering Shelf during lower sea level, and modern chum salmon fall spawning limit along the Tanana River. Details are provided inSI Text.
Fig. 2. Upward Sun River stratigraphy, chronology, and aDNA and stable isotope bone samples. Details provided inSI TextandTable S1.
remains from archaeological sites date to as old as∼6610–5940 cal B.P. from Namu on the central coast of British Columbia (23), and to as old as 9300–8200 cal B.P. for morphologically identified salmon from the Dalles Roadcut site on the Columbia River (32). Pacific salmon remains have not been previously reported for a late Pleistocene-age site, and, indeed, fish remains of any kind are rare in sites for this period in the Americas. In a broad review of taxa exploited by early Paleoindians (33), only two sites (Aubrey and Shawnee-Minisink) had evidence of fish (with no further taxonomic identification) in strong association with human occupation, though abundance values were low. Recently, Erlandson et al. (34) reported 78 specimens (1.4% of total) of various fish taxa (none are salmon) at three Paleoindian sites on the Channel Islands, California.
In Beringia, there is additional evidence for fish exploitation, particularly during the Younger Dryas (16). In central Alaska, Broken Mammoth Cultural Zone 3 (∼12,080 cal B.P.) contained 28 salmonid specimens (possibly grayling) (35), and Mead Cultural Zone 3 (∼11,990 cal B.P.) contained unidentified fish remains (16). In Kamchatka (Russia), Ushki 1 Level 6 (∼12,160 cal BP) con-tained an unspecified number of burned fish bones (possibly salmon) within houses (36). The salmon data from Upward Sun River reported here add an important component to Paleoindian diet breadth, with implications for seasonal exploitation and pos-sibly storage that is markedly different from multiseasonal exploi-tation of freshwater fish.
Although Paleoindians are traditionally portrayed as specialist big-game hunters, evidence from Upward Sun River and other early sites in Beringia increasingly suggests a diversity of sub-sistence strategies, which included hunting, gathering, and fishing. Although the degree of reliance on salmon by early Beringians is
currently unresolved, historically in subarctic Alaska, salmon were taken in great numbers in summer to early fall for drying and storing through the winter (37). The extent of salmon storage among early Beringians is also unknown, but chum are well suited for preservation because of their low oil content relative to other salmon species (23).
Our findings have important implications for the paleoecology and human colonization of Beringia and the Americas. Of the 40 earliest known components in northwest North America (dating between 14,000 and 11,500 cal B.P.) (16), 36 (90%) are located in the interior and the majority (60%) are associated with large interior river bottomlands, suggesting the importance of riverine resources to early foragers. Our data show that at least by 11,500 cal B.P., salmon had established spawning runs in the deep in-terior of eastern Beringia near their current limit of migration, an upriver distance of over 1,400 km from the current mouth of the Yukon, plus an additional∼300 km of river on the exposed gradually sloping Bering Sea shelf (38) (Fig. 1). The addition of salmon to the early subsistence record further indicates that interior eastern Beringia was a productive landscape in the ter-minal Pleistocene, supporting a variety of large and small terres-trial mammals, waterfowl, and other fish. This resource diversity contrasts with the assumptions of very low resource availability in inland ecosystems in debates about New World migration corri-dors (39, 40).
Modern ocean foraging areas for chum salmon include the Bering Sea and the subarctic North Pacific Ocean. Although suitable salmon habitat was likely available in this region throughout the Late Pleistocene, during intervals within glacial periods habitat was probably suboptimal, and especially so near coastal areas surrounding the Bering Sea and the northern Gulf of Alaska (41, 42). Recent paleoceanographic data show that conditions improved dramatically between ∼17,000 and 13,000 cal B.P., depending on indicator and location, in terms of warming sea-surface temperatures, reduced cover of seasonal sea ice, and increased primary productivity (41, 42). River migration access and spawning habitat in the lower Yukon River basin during the Late Pleistocene was probably not an impediment to salmon, as it was not glaciated, even at maximum glacial extent (38, 43). These observations suggest that ocean habitat and mi-gration barriers to Yukon-Tanana salmon were not substantial during the period of early human colonization. Given this, salmon may have been an important resource to earlier Paleoindian subsistence economies and may have played a role in the bio-geographic expansions of humans into northwest North America.
ACKNOWLEDGMENTS.We thank the Healy Lake Tribal Council and Tanana Chiefs Conference representatives for their support; Robert Sattler (Tanana Chiefs Conference), MTNT Ltd., and the McGrath Native Village council for their support in the recovery and analysis of prehistoric freshwater fish specimens; Cara Monroe and Lindsay Hilldorfer for assistance in the Washington State University laboratory; and Bobbi Johnson for the initial analysis of the 58-18 morphometric measures. This project was funded in part by National Science Foundation Grants 1138811 and 1223119.
1. Lindsey CC, McPhail JD (1986) Zoogeography of fishes of the Yukon and Mackenzie basins.The Zoogeography of North American Freshwater Fishes, eds Hocutt CH, Wiley EO (Wiley, New York), pp 639–674.
2. Waples RS, Pess GR, Beechie T (2008) Evolutionary history of Pacific salmon in dynamic environments.Evol Appl1(2):189–206.
3. Hoffecker JF, Elias SA (2007)Human Ecology of Beringia(Columbia Univ Press, New York).
4. Surovell TA, Waguespack NM (2009) Human prey choice in the late Pleistocene and its relation to megafaunal extinctions.American Megafaunal Extinctions at the End of the Pleistocene, ed Haynes G (Springer, Dordrecht, The Netherlands), pp 77–105. 5. Cannon MD, Meltzer DJ (2008) Explaining variability in early Paleoindian foraging.
Quat Int191:5–17.
6. Quinn TP (2005)The Behavior and Ecology of Pacific Salmon and Trout(Univ of Washington Press, Seattle).
7. Schalk RF (1977) The structure of an anadromous fish resource.For Theory Building in Archaeology, ed Binford LR (Academic, New York), pp 207–249.
8. Schindler DE, et al. (2003) Pacific Salmon and the ecology of coastal ecosystems.Front Ecol Environ1(1):31–37.
9. Smith GR, Montgomery DR, Peterson NP, Crowley B (2007) Spawning sockeye salmon fossils in Pleistocene lake beds of Skokomish Valley, Washington.Quat Res68:227–238. 10. Lyman RL (1994)Vertebrate Taphonomy(Cambridge Univ Press, Cambridge, UK). 11. Carlson CC, Klein K (1996) Late Pleistocene salmon of Kamloops Lake.Life in Stone: A
Natural History of British Columbia’s Fossils, ed Ludvigsen R (Univ of British Columbia Press, Vancouver), pp 274–280.
12. Harington CR, Ross RLM, Mathewes RW, Stewart KM, Beattie O (2004) A late Pleis-tocene Steller sea lion (Eumetopias jubatus) from Courtenay, British Columbia: Its death, associated biota, and paleoenvironment.Can J Earth Sci41(11):1285–1297. 13. Fedje D, Mackie Q, Lacourse T, McLaren D (2011) Younger Dryas environments and
archaeology on the Northwest Coast of North America.Quat Int242(2):452–462. 14. Potter BA, Irish JD, Reuther JD, Gelvin-Reymiller C, Holliday VT (2011) A terminal
Pleistocene child cremation and residential structure from eastern Beringia.Science 331(6020):1058–1062.
Fig. 3. Stable isotope values for the Upward Sun River sample compared with published values for ancient and modern anadromous and freshwater fishes in Alaska. Modern values have been adjusted for tissue offsets (muscle to bone collagen) and for the Suess effect (reduction ofδ13C in carbon
res-ervoirs from industrial carbon emissions). Details provided inSI Textand Tables S4andS5.
Halffman et al. PNAS Early Edition | 3 of 5
ANTHR
15. Potter BA, Irish JD, Reuther JD, McKinney HJ (2014) New insights into Eastern Be-ringian mortuary behavior: A terminal Pleistocene double infant burial at Upward Sun River.Proc Natl Acad Sci USA111(48):17060–17065.
16. Potter BA, Holmes CE, Yesner DR (2013) Technology and economy among the earliest prehistoric foragers in interior eastern Beringia. Paleoamerican Odyssey. Proceedings of the 2013 Paleoamerican Odyssey Conference in Santa Fe, New Mexico, eds Graf KE, Ketron CV, Waters MR (Texas A&M Press, College Station, TX), pp 81–103.
17. Butler VL (2004) Fish remains.Marmes Rockshelter: A Final Report on 11,000 Years of Cultural Use, ed Hicks BA (Washington State Univ Press, Pullman, WA), pp 320–337. 18. Moss ML, Judd KG, Kemp BM (2014) Can salmonids (Oncorhynchusspp.) be identified to species using vertebral morphometrics? A test using ancient DNA from Coffman Cove, Alaska.J Archaeol Sci41:879–889.
19. Grier C, et al. (2013) Using ancient DNA identification and osteometric measures of archaeological Pacific Salmon vertebrae for reconstructing salmon fisheries and site seasonality at Dionisio Point, British Columbia.J Archaeol Sci40:544–555. 20. Orchard TJ, Szpak P (2011) Identification of salmon species from archaeological
re-mains on the Northwest Coast.The Archaeology of North Pacific Fisheries, eds Moss ML, Cannon A (Univ of Alaska Press, Fairbanks, AK), pp 17–29.
21. Huber HR, Jorgensen JC, Butler VL, Baker G, Stevens R (2011) Can salmonids (Onco-rhynchusspp.) be identified to species using vertebral morphometrics?J Archaeol Sci 38(1):136–146.
22. Yang DY, Cannon A, Saunders SR (2004) DNA species identification of archaeological salmon bone from the Pacific Northwest coast of North America.J Archaeol Sci31: 619–631.
23. Cannon A, Yang DY (2006) Early storage and sedentism on the Pacific Northwest Coast: Ancient DNA analysis of salmon remains from Namu, British Columbia.Am Antiq71(1):123–140.
24. Speller CF, Yang DY, Hayden B (2005) Ancient DNA investigation of prehistoric salmon resource utilization at Keatley Creek, British Columbia, Canada.J Archaeol Sci 32:1378–1389.
25. Clarke WC, Hirano T (1995) Osmoregulation.Physiological Ecology of Pacific Salmon, eds Groot C, Margolis L, Clarke WC (Univ of British Columbia Press, Vancouver), pp 317–378.
26. Schoeninger MJ, DeNiro MJ (1984) Nitrogen and carbon isotopic composition of bone collagen from marine and terrestrial animals.Geochim Cosmochim Acta48:625–639. 27. Ciancio JE, et al. (2008) Stable isotope profiles of partially migratory salmonid
pop-ulations in Atlantic rivers of Patagonia.J Fish Biol72:1708–1719.
28. Swanson HK, et al. (2010) Anadromy in Arctic populations of lake trout (Salvelinus namaycush): Otolith microchemistry, stable isotopes, and comparisons with Arctic char (Salvelinus alpinus).Can J Fish Aquat Sci67:842–853.
29. Doucett RR, Power M, Power G, Caron F, Reist JD (1999) Evidence for anadromy in a southern relict population of Arctic charr from North America.J Fish Biol55:84–93. 30. Kline TC, Jr, Wilson WJ, Goering JJ (1998) Natural isotope indicators of fish migration
at Prudhoe Bay, Alaska.Can J Fish Aquat Sci55:1494–1502.
31. Jordan LG, Steele CA, Thorgaard GH (2010) Universal mtDNA primers for species identification of degraded bony fish samples.Mol Ecol Resour10(1):225–228. 32. Butler VL, O’Connor JE (2004) 9000 years of salmon fishing on the Columbia River,
North America.Quat Res62:1–8.
33. Cannon MD, Meltzer DJ (2004) Early Paleoindian foraging: Examining the faunal evidence for large mammal specialization and regional variability in prey choice. Quat Sci Rev23:1955–1987.
34. Erlandson JM, et al. (2011) Paleoindian seafaring, maritime technologies, and coastal foraging on California’s Channel Islands.Science331(6021):1181–1185.
35. Yesner DR (2007) Faunal extinction, hunter-gatherer foraging strategies, and sub-sistence diversity among eastern Beringian Paleoindians.Foragers of the Terminal Pleistocene in North America, eds Walker RB, Driskell BN (Univ of Nebraska Press, Lincoln, NB), pp 15–31.
36. Dikov NN (1979)Drevnie kul’tury Severo-Vostochnoi Azii (Aziia na styke s Amerikoi v drevnosti) trans Bland RL [Early Cultures of Northeastern Asia] (Nauka, Moscow). 37. VanStone JW (1974)Athapaskan Adaptations(Field Museum of Natural History,
Chicago).
38. Knebel HJ, Creager JS (1973) Yukon River: Evidence for extensive migration during the Holocene transgression.Science179(4079):1230–1232.
39. Fladmark KR (1975)A Paleoecological Model for Northwest Coast Prehistory (Na-tional Museums of Canada, Ottawa).
40. Surovell TA (2003) Simulating coastal migration in New World colonization.Curr Anthropol44(4):580–591.
41. Caissie BE, Brigham-Grette J, Lawrence KT, Herbert TD, Cook MS (2010) Last Glacial Maximum to Holocene sea surface conditions at Umnak Plateau, Bering Sea, as in-ferred from diatom, alkenone, and stable isotope records.Paleoceanography25: PA1206.
42. Addison JA, et al. (2012) Productivity and sedimentaryδ15N variability for the last 17,000 years along the northern Gulf of Alaska continental slope.Paleoceanography 27:PA1206.
43. Dyke AS (2004) An outline of North American deglaciation with emphasis on central and northern Canada.Quaternary Glaciations-Extent and Chronology. Part II: North America, eds Ehlers J, Gibbard PL (Elsevier, Amsterdam), pp 373–424.
44. Reuther JD (2013) Late Glacial and Early Holocene geoarchaeology and terrestrial paleoecology in the lowlands of the Middle Tanana Valley, subarctic Alaska. PhD Dissertation. (University of Arizona, Tucson, AZ).
45. Potter BA, Reuther JD, Bowers PM, Gelvin-Reymiller C (2008) Little Delta Dune site: A late-Pleistocene multicomponent site in central Alaska.Current Research in the Pleistocene25:132–135.
46. Dyke AS, Moore A, Robertson L (2003) Deglaciation of North America. Geological Survey of Canada Open File 1574. Thirty-two digital maps at 1:7,000,000 scale with accompanying digital chronological database and one poster (two sheets) with full map series (Geological Survey of Canada, Ottawa).
47. Manley WF (2002) Postglacial flooding of the Bering Land Bridge: A geospatial ani-mation: INSTAAR, University of Colorado, v1. Available at instaar.colorado.edu/QGISL/ bering_land_bridge/. Accessed May 17, 2014.
48. Barton LH (1984)A Catalog of Yukon River Salmon Spawning Escapement Surveys. Technical Data Report 121(Alaska Department of Fish and Game, Division of Com-mercial Fisheries, Juneau, AK).
49. McKennan RA (1981) Tanana.Handbook of North American Indians: Vol. 6: Sub-arctic, eds Sturtevant WC, Helm J (Government Printing Office, Washington DC), pp 562–576.
50. Kemp BM, Glenn Smith D (2010) Ancient DNA methodology: Thoughts from Brian M. Kemp and David Glenn Smith on“Mitochondrial DNA of protohistoric remains of an Arikara population from South Dakota”.Hum Biol82(2):227–238.
51. Barta JL, Monroe C, Kemp BM (2013) Further evaluation of the efficacy of contami-nation removal from bone surfaces.Forensic Sci Int231(1-3):340–348.
52. Cui Y, et al. (2013) Ancient DNA analysis of mid-Holocene individuals from the Northwest Coast of North America reveals different evolutionary paths for mitoge-nomes.PLoS One8(7):e66948.
53. Kemp BM, Monroe C, Judd KG, Reams E, Grier C (2014) Evaluation of methods that subdue the effects of polymerase chain reaction inhibitors in the study of ancient and degraded DNA.J Archaeol Sci42:373–380.
54. Monroe C, Grier C, Kemp BM (2013) Evaluating the efficacy of various thermo-stable polymerases against co-extracted PCR inhibitors in ancient DNA samples.Forensic Sci Int228(1-3):142–153.
55. Winters M, Barta JL, Monroe C, Kemp BM (2011) To clone or not to clone: method analysis for retrieving consensus sequences in ancient DNA samples.PLoS One6(6): e21247.
56. Yang DY, Eng B, Waye JS, Dudar JC, Saunders SR (1998) Technical note: Improved DNA extraction from ancient bones using silica-based spin columns.Am J Phys Anthropol105(4):539–543.
57. Yang DY, Speller CF (2006) Co-amplification of cytochromeband d-loop mtDNA fragments for the identification of degraded DNA samples.Mol Ecol Notes6(3): 605–608.
58. Thompson JD, Higgins DG, Gibson TJ (1994) CLUSTAL W: Improving the sensi-tivity of progressive multiple sequence alignment through sequence weighting, position-specific gap penalties and weight matrix choice.Nucleic Acids Res 22(22):4673–4680.
59. Hall TA (1999) BioEdit: A user-friendly biological sequence alignment editor and analysis program for Windows 95/98/NT.Nucleic Acids Symp Ser41:95–98. 60. Tamura K, Stecher G, Peterson D, Filipski A, Kumar S (2013) MEGA6: Molecular
Evo-lutionary Genetics Analysis version 6.0.Mol Biol Evol30(12):2725–2729.
61. Longin R (1971) New method of collagen extraction for radiocarbon dating.Nature 230(5291):241–242.
62. Coplen TB (1995) Reporting of stable carbon, hydrogen, and oxygen isotopic abun-dances.Reference and Intercomparison Materials for Stable Isotopes of Light Ele-ments. Proceedings of a Consultants Meeting Held in Vienna, 1–3 December 1993, ed International Atomic Energy Agency (IAEA, Vienna), pp 31–34.
63. Böhlke JK, Coplen TB (1995) Interlaboratory comparison of reference materials for nitrogen-isotope-ratio measurements.Reference and Intercomparison Materials for Stable Isotopes of Light Elements. Proceedings of a Consultants Meeting Held in Vienna, 1–3 December 1993, ed International Atomic Energy Agency (IAEA, Vienna), pp 51–66.
64. Ambrose SH (1990) Preparation and characterization of bone and tooth collagen for isotopic analysis.J Archaeol Sci17(4):431–451.
65. DeNiro MJ (1985) Postmortem preservation and alteration of in vivo bone collagen isotope ratios in relation to palaeodietary reconstruction.Nature317:806–809. 66. van Klinken GJ (1999) Bone collagen quality indicators for palaeodietary and
radio-carbon measurements.J Archaeol Sci26:687–695.
67. Britton K, et al. (2013) Maritime adaptations and dietary variation in prehistoric Western Alaska: Stable isotope analysis of permafrost-preserved human hair.Am J Phys Anthropol151(3):448–461.
68. Byers DA, Yesner DR, Broughton JM, Coltrain JB (2011) Stable isotope chemistry, population histories and Late Prehistoric subsistence change in the Aleutian Islands. J Archaeol Sci38(1):183–196.
69. Misarti N, Finney B, Maschner H, Wooller MJ (2009) Changes in northeast Pacific marine ecosystems over the last 4500 years: Evidence from stable isotope analysis of bone collagen from archeological middens.Holocene19:1139–1151.
70. Halffman CM, Sattler R, Clark JL (2015) Bone collagen stable isotope analysis of three late Holocene humans from Interior Alaska.Am J Phys Anthropol156(S60):157. 71. Johnson SP, Schindler DE (2009) Trophic ecology of Pacific salmon (Oncorhynchus
spp.) in the ocean: A synthesis of stable isotope research.Ecol Res24(4):855–863. 72. Ben-David M (1996) Seasonal diets of mink and martens: Effects of spatial and
tem-poral changes in resource abundance. PhD Dissertation. (University of Alaska Fair-banks, FairFair-banks, AK).
73. Satterfield FR, Finney BP (2002) Stable isotope analysis of Pacific salmon: Insight into trophic status and oceanographic conditions over the last 30 years.Prog Oceanogr 53(2):231–246.
74. Kaeriyama M, et al. (2004) Change in feeding ecology and trophic dynamics of Pacific salmon (Oncorhynchusspp.) in the central Gulf of Alaska in relation to climate events. Fish Oceanogr13(3):197–207.
75. Knudson KJ, Frink L (2011) Nitrogen isotope analysis in the Arctic: Identifying fish processing and marine resource use through ethnoarchaeological soil analysis on Nelson Island, Alaska.Alaska Journal of Anthropology9(2):17–54.
76. Keeling CD (1979) The Suess effect:13Carbon-14Carbon interrelations.Environ Int 2(4-6):229–300.
77. McCarroll D, Loader NJ (2004) Stable isotopes in tree rings.Quat Sci Rev23: 771–801.
78. Shedlock AM, Parker JD, Crispin DA, Pietsch TW, Burmer GC (1992) Evolution of the salmonid mitochondrial control region.Mol Phylogenet Evol1(3):179–192.
79. Royle TC (2014) Ancient DNA analysis of Middle and Late Period archaeological fish remains from Kamloops, British Columbia. MA Thesis (Simon Fraser University, Burnaby, BC).
80. Piorkowski RJ (1995) Ecological effects of spawning salmon on several southcentral Alaskan streams. PhD Dissertation. (University of Alaska Fairbanks, Fairbanks, AK). 81. Crock JG, Seal RR, II, Gough LP, Weber-Scannell P (2003) Results of elemental and stable
isotopic measurements, and dietary composition of Arctic grayling (Thymallus arcticus) collected in 2000 and 2001 from the Fortymile River Watershed, Alaska. Open-File Re-port 2003-03-057 (US Department of the Interior, US Geological Survey, Denver).
Halffman et al. PNAS Early Edition | 5 of 5
ANTHR
Supporting Information
Halffman et al. 10.1073/pnas.1509747112
SI TextSample Archaeological Context.All three samples were recovered from a single complex feature associated with Component 3 at the Upward Sun River site (USR), located in the central Tanana River basin (Fig. 2). USR site context, geoarchaeology, site for-mation, and evaluation of postdepositional disturbance and ta-phonomy have been previously reported (14, 15, 44, 45). Multiple datasets (including clearly defined and horizontal Ab horizons, thin unimodal distributions of lithics and faunal remains, and lack of bioturbation and cryoturbation) indicate minimal postdepositional disturbance, allowing for exploration of cultural behaviors re-sponsible for site formation. A series of 27 radiocarbon dates se-curely date all four components, with sterile zones (derived from backscatter plots and level totals) separating the occupations. Component 3 contains 10 hearths and associated artifact and faunal scatters dating to∼11,500 cal B.P. (14, 15).
The largest quantity of faunal remains is situated directly within two superimposed features: (i) an upper hearth feature associated with a cremated 3-y-old human (14) and (ii) burial pit fill associ-ated with a double infant burial (15). These features are within a residential feature, interpreted to represent a tent structure (14), and the dating indicates they are potentially contemporaneous. Analyses presented in Potter et al. (15) suggest they were created and used within a single season or subsequent seasons by the same population.
Faunal data are provided in Potter et al. (15). Number of identified specimens (NISP) for both features totals 930, with 827 (89%) in the cremation hearth and 103 (11%) in the burial pit fill. Based on NISP, the most abundant taxon isOncorhynchus spp. (salmon) for both features (337 NISP), comprising 37% of hearth NISP and 36% of pit-fill NISP. Other taxa includeUrocitellus
parryii(ground squirrel) (242 NISP, 26% of both features),
Avrico-linae (vole and microtine) (245 NISP, 26%), and small quantities
ofLepus americanus (snowshoe hare), Marmota sp. (marmot),
Tetraoninae (ptarmigan/grouse), and Paridae (passerine bird).
Oncorhynchusspp. is the predominant fish taxa, although 25
spec-imens of Salmonidae (small salmonid, notOncorhynchus) were also identified. Taxa associated with the hearth were nearly all burned/calcined (96–100% of NISP per taxon), and burned pro-portions were lower for burial pit fill specimens (0–29% of NISP per taxon). Given the contextual information presented in Potter et al. (15), two related assemblages were identified: (i) the pit-fill fauna, representing a preburial occupation of the residential fea-ture, and (ii) the cremation hearth, representing a second occu-pation of the residential feature. Faunal diversity is similar between features, suggesting similar (summer) seasons of occupation and similar economy.
Sample Descriptions and Morphometric Analysis.Of the very few unburned completeOncorhynchusspp. vertebrae (n =6), we se-lected two vertebrae for destructive analysis on the basis of likely preservation of collagen and sufficient mass for genetic and stable isotope analyses (Table S1). A third vertebra (H-5446) was selected from the cremation material and was one of the very few complete calcined vertebra in the upper assemblage. All three were fused (type III) caudal vertebrae and were typical of the specimens as-signed toOncorhynchusspp. Sample provenience and metric data are provided in Table S1 (see Fig. 2 for stratigraphic location).
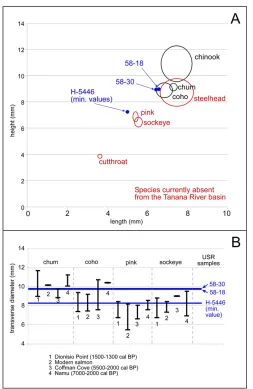
Because of current debates over identification of salmon species through osteometric analyses, we took a variety of measurements and compared them with published modern and ancient archaeo-logical salmon assemblages (18, 20–22). Fig. S1Ashows the USR
samples relative to type III vertebral length and height dimensions for modernOncorhynchusspecies (at 1σ) [data from Huber et al. (21)]. The two unburned specimens (58-18, 58-30) are larger than smaller Oncorhynchus species (sockeye, pink, and cutthroat), smaller than Chinook, but similar to chum, coho, and steelhead.
We also compared USR samples with data from Moss et al. (18), who provide summary statistics of vertebral transverse di-ameter for modern and genetically identified chum, coho, pink, and sockeye from archaeological assemblages (Fig. S1B). USR sample measurements were consistent with both chum and coho, but were larger than both pink and sockeye. These osteometric analyses demonstrate that genetic analysis is necessary to dis-tinguishOncorhynchusspecimens to the species level.
Relationship of Site Location to Modern Salmon Limit.The location of the Upward Sun River site and limits of modern major fall spawning areas along the Tanana River are illustrated in Fig. 1. The modern course of the Tanana River and Yukon River (south of the junction with the former) is shown along with a possible ancient course to the southern Bering Sea (38). Glacial ice distributions and exposed continental shelf are derived from Dyke et al. (46) and Manley 2002 (47), respectively. Modern major fall spawning areas of chum salmon are documented to the Delta River (50 km from USR), with only limited spawning to Billy Creek (the limit shown in Fig. 1) (48). Ethnographic use of salmon is limited to lower Tanana clearwater tributaries (49). The geographic position of Upward Sun River salmon relative to the modern extent of major salmon spawning in the Tanana River shows that spawning habitat was established by at least 11,500 cal B.P. The presence of anadromous chum salmon indicates their availability as a resource along the length of the Tanana River and the lower Yukon River, totaling at least 1,400 km.
aDNA Extraction and Analysis (Washington State University).DNA was first extracted from specimen 58-18 at Washington State University (WSU). Located in a separate building from where PCR and post-PCR activities are conducted, the Ancient DNA Laboratory at WSU is dedicated for the study of highly degraded DNA samples. Precautions to minimize the introduction of contamination are routinely practiced in the laboratory (50).
A subsample of the vertebrae, weighing 34 mg, was removed from the whole with a single-use razor blade. The subsample was sub-merged in 6% (wt/vol) sodium hypochlorite (bleach) for 4 min to remove possible surface contaminants (51). The bleach was poured off and the sample rinsed twice by submersion in DNA-free water. The sample was then transferred to a 1.5-mL tube, to which an aliquot of 500 μL of EDTA (pH 8.0) was added. An extraction negative accompanied the sample through the extraction pro-cedure to monitor for the possible origination of contamination. DNA was extracted from the sample following the WSU method described by Cui et al. (52). After 48 h of decalcification in EDTA, 60 U of proteinase K (Biobasic) were added to the tubes and in-cubated at 65 °C for 3 h. The volumes were transferred to 5-mL Falcon tubes, to which 750μL of 2% (wt/vol) celite in 6 M gua-nidine HCl, and 250μL of 6 M guanidine HCl were added. The tubes were vortexed numerous times over a 2-min period. These solutions were pulled across Promega Wizard Minicolumns using Luer-Lok syringes and a vacuum manifold. The silica pellets were rinsed by pulling 3 mL of 80% (wt/vol) isopropanol across the columns. Residual isopropanol was removed from the columns by centrifugation in 1.5-mL tubes at 10,000 g for 2 min. The columns were moved to new 1.5-mL tubes and 50μL of 65 °C DNA-free
ddH2O was added to the column and left for 3 min before cen-trifugation at 10,000×gfor 30 s, and this step was repeated again resulting in 100 mL of extracted DNA.
The DNA extract was first tested for the presence of PCR in-hibitors following Kemp et al. (53). Following determination that the extract was inhibited, 50μL of the volume was subjected to repeat silica extraction (53) and tested again for inhibition. Fol-lowing one round of repeat silica extraction, the treated extract was determined not to be inhibited. In addition, 5μL each of the full concentration extract was diluted with water to 1:10 and 1:50 its original concentration. These dilutions were also determined not to be inhibited. DNA from the full concentration extract, the repeat silica-treated portion of the extract, the 1:10 dilution, and the 1:50 dilution were PCR-amplified and sequenced for a region of the mitochondrial 12S gene (189 bp, minus primers the sequence length is 148 bp) that is useful for discriminating among Pacific salmonids and other fishes (31) using Omni Klentaq LA, as de-scribed by Monroe et al. (54). Fifteen-microliter PCRs contained 0.32 mM dNTPs, 1×Omni Klentaq Reaction Buffer, 0.24μM of each primer, 0.3 U of Omni Klentaq LA, and 1.5μL of template DNA. Primers were those described by Jordan et al. (31); however, it is important to note that in the original study the authors reported the wrong orientation for the reverse primer. Described correctly, the primer sequences are: (i)“OST12S-F”5′ -GCTTAAAACCC-AAAGGACTTG-3′ and (ii) “OST12S-R” 5′ -CTACACCTCGA-CCTGACGTT-3′. PCR cycling conditions consisted of: (i) a 3-min hold at 94 °C, (ii) 60 cycles of 15-s holds at 94 °C, 55 °C, and 68 °C, and (iii) a 3-min hold at 68 °C. Successful amplifications were prepared for sequencing following Monroe et al. (54). Sequences were generated in both directions with an ABI 3730xl sequencer at Elim Biopharm. Aligned against a rainbow trout mtDNA se-quence [National Center for Biotechnology Information (NCBI) accession no. DQ288271] in Sequencher (v4.8), sequences gen-erated in this study were used for species determination according to Jordan et al. (31).
Although the full concentration extract was determined to be inhibited as described above, it was successfully amplified. This outcome has been observed in a minority of cases by Kemp et al. (53) and a subsequent test of the full concentration extract in the present study indicated that it was not inhibited. These observations can be explained by the stochastic nature of PCR amplification of low copy-number DNA extracts. The sequence, spanning nucleotides positions (nps) 593–740 relative to the rainbow trout mtDNA ref-erence sequence (NCBI accession no. DQ288271), exhibited the following mutations: 660T and 713T (Table S2). According to Jor-dan et al. (see table 2 in ref. 31), this sequence corresponds to
Oncorhynchus keta(chum salmon). In comparison with the records
maintained by the NCBI, the Basic Local Aligment Search Tool (BLAST) reveals five complete matches to this sequence, all of which are chum salmon (accessions nos.: KM273849.1, HQ592292.1, AP010773.1, AP125512.1, and AF113119.1). Both the 1:10 dilution and 1:50 dilution amplified for the 12S fragment and the sequences exhibited the same mutations, matching 100% to chum salmon. The forward sequencing reaction from the repeat silica-treated extract failed, but the reverse sequence was consistent with chum salmon (i.e., the sequence spans nps 593–711 and exhibits the following mutation: 660T). Neither the extraction-negative control nor any of the PCR-negative controls amplified. In total, four PCR amplifica-tions and the resulting sequences from the first extraction of 58-18 demonstrate the sample to be chum salmon. Repeated observations of an identical sequence effectively rules out these results as having been influence by postmortem nucleotide damage (55). Following analysis of 58-18 at WSU, the remainder of the vertebra was sent to Simon Fraser University (SFU) for independent verification (de-scribed below).
After the analysis of 58-18, the complete H-5446 (calcined) vertebrae and a powered portion of the 58-30 (unburned) vertebrae (i.e., the portion remaining following isotopic analysis) were sent to
the WSU laboratory for genetic species identification. DNA was extracted from a 39-mg portion of H-5446 that was removed from the whole with a one-time razor blade and a 53-mg aliquot of the 58-30 powered vertebrae. The extraction, PCR, and sequencing methods were as described above except that the powered bone was not submerged in bleach nor rinsed with DNA-free water. DNA extracted from sample 58-30 was not inhibited. Determined twice by PCR, the sequence, spanning nps 593–740 relative to the rainbow trout mtDNA reference sequence (NCBI accession no. DQ288271) exhibited the following mutations: 660T and 713T (Table S2). This finding is identical to that determined for specimen 58-18 and, as de-scribed above, reveals specimen 58-30 to be of chum salmon.
DNA extracted from sample H-5446 was also not inhibited yet it repeatedly failed to amplify (with 1.5μL of template DNA from the full concentration extract, 3.0μL of template DNA from the full concentration extract, 1.5μL of a 1:10 dilution, and 1.5μL of a 1:50 dilution) (Table S2). Neither the extraction-negative control nor any of the PCR-negative controls amplified. In total, the results demonstrate 58-18 and 58-30 to be chum salmon and H-5446 to not contain analyzable DNA with the methods used here.
aDNA Extraction and Analysis (Simon Fraser University). A 25-mg subsample of specimen 58-18 was sent to the Ancient DNA Lab-oratory at SFU for independent replication. The Ancient DNA Laboratory at SFU is specifically designed for ancient DNA analysis and includes UV-filtered ventilation, positive airflow, bench UV lights, and dedicated equipment. No modern DNA samples have ever been processed in the laboratory and strict contamination control protocols are followed at all times (56).
Sample 58-18 was chemically decontaminated through sub-mersion in 6% (wt/vol) sodium hypochlorite for 7 min before being rinsed twice in ultrapure water and UV-irradiated in a cross-linker for 30 min on two sides. The sample was then manually crushed into powder and incubated overnight in 4 mL of lysis buffer [0.5 M EDTA (pH 8.0), 0.5% SDS, and 0.5 mg/mL proteinase K] in a rotating hybridization oven at 50 °C. The tubes were then centri-fuged and 2 mL of supernatant from each sample was concentrated to≤100μL using Amicon Ultra-4 Centrifugal Filter Devices (10 KD, 4 mL; Millipore). Concentrated extracts were purified using QIAquick spin columns (Qiagen) following the method developed by Yang et al. (22, 56). Next, 100μL of DNA from each sample was eluted from each QIAquick column for PCR amplification.
PCR amplifications (60 cycles) were performed on an Eppendorf Mastercycler Gradient using a 30-μL reaction volume containing 1.5×Applied Biosystems Buffer, 2 mM MgCl2, 0.2 mM dNTP, 1.0 mg/mL BSA, 3.0–4.0μL of template DNA, and 1.5 U Ampli-Taq Gold (Applied Biosystems).“Universal”bony fish primers, as well as salmonid-specific primers, targeting mtDNA were amplified separately using previously published protocols (57) (Table S3). PCR cycling conditions consisted of: (i) a 12-min hold at 95 °C; (ii) 60 cycles of a 30-s hold at 95 °C, 30-s hold at 52 °C, and 40-s hold at 70 °C; and (iii) a 7-min hold at 72 °C. Five microliters of PCR product from each sample was separated on a 2% agarose gel and visualized using SYBR Green on dark reader (Clare Chemical Research).
Sample 58-18 was successfully amplified using the universal and salmonid-specific primers for DNA (22, 57). The universal primers targeted a COI DNA fragment (∼220 bp) designed to discriminate between bony fish species. The resulting DNA sequence was identified asO. keta(chum salmon) through the BLAST analysis of GenBank sequences. To strengthen this identification, salmonid-specific primers yielded discriminating fragments of the cyto-chromeb(168 bps) and d-loop (248 bp) regions of the salmonid mitochondrial genome. The resulting amplicons were sent to Eu-rofins MWG Operon for sequencing and good-quality sequences were obtained. Sequences were visually edited and base-pair am-biguities were examined using ChromasPro software (technelysium. com.au). Multiple alignments of the ancient sequences and
published salmonid reference sequences were achieved using ClustalW (58), through BioEdit (59), and phylogenetic analysis was conducted using Mega 6.0 software (60).
Determination of Species Identity (SFU). The species identity of sample 58-18 was determined through multiple analytical ap-proaches of the d-loop and cytochromebsalmonid sequences. First, a BLAST search against GenBank was used. All amplifications yielded salmonid sequences, which matched either identically or within a few base pairs with GenBank BLAST reference sequences
forO. keta(chum salmon). Second, multiple alignments and
phy-logenetic comparison of this sample to closely-related species also clearly and explicitly point to the species identity ofO. keta(chum salmon). Figs. S2 and S3 display multiple alignments of the ancient salmonid cytochromeb and d-loop sequences, respectively, and reference sequences obtained from GenBank, and Fig. S4AandB display phylogenetic relationships between the ancient salmonid cytochromeband d-loop haplotypes, respectively, and reference sequences obtained from GenBank. The accuracy of the phy-logenetic trees is enhanced by relatively low intraspecific DNA variation for each Pacific salmon species because of their unique evolutionary history (2).
Exclusion of Contamination (SFU).Contamination can be excluded from the analysis of specimen 58-18. The dedicated aDNA lab-oratory at SFU follows strict contamination control protocols, such as the separation of the pre-PCR and post-PCR work spaces; the use of aDNA-dedicated equipment, including clothing, equip-ment, and reagents; and the analysis of blank extraction and negative-PCR controls alongside the aDNA samples. The contamination controls undertaken in this study were successful at eliminating any systematic contamination because no PCR amplification was ob-served in blank extracts and PCR-negative controls. Furthermore, both cytochromeband d-loop sequences from the same sample yielded the same species identity.
Bone Collagen Extraction and Stable Isotope Methods.Bone colla-gen was extracted from a single unburned salmonid vertebra (58-30) for carbon and nitrogen stable isotope analysis. The spec-imen was cleaned using a dental pick to remove visible adhering sediment, followed by ultrasonication in ultrapure water (re-sistivity>18 MΩ-cm; total oxidizable carbon<5 ppb) for 15 min (repeated once with a change of water). After air-drying over-night, the sample was pulverized in a ball mill to less than 0.5 mm. Bone collagen was extracted using the Longin method (61) with some modifications. Extraction steps were carried out at room temperature, unless otherwise noted. To demineralize the sample,∼0.04 g of powdered bone was placed into a 1.5-mL microcentrifuge tube to which∼1.0 mL of 0.5 M HCl was added. The contents were mixed using moderate shaking (600 rpm) on a laboratory mixer for 30 min, followed by centrifuging and discard of the supernatant. The HCl treatment was repeated twice (for a total of three acid washes), after which the sample was rinsed three times in ultrapure water. To remove base-soluble con-taminants, such as humic acids,∼1.0 mL of 0.1 M NaOH was added to the sample, and the contents were mixed using mod-erate shaking (600 rpm) on a laboratory mixer for 10 min, fol-lowed by centrifuging and discard of the supernatant. The NaOH treatment was repeated once (for a total of two alkaline washes), after which the sample was rinsed three times in ultrapure water. To gelatinize (solubilize) the collagen,∼1.0 mL of dilute HCl
(0.001 M, pH 3) was added to the sample, and the tube was placed on a laboratory mixer at 70 °C with moderate shaking (800 rpm) for 20 h, followed by centrifuging and collection of the supernatant (containing the solubilized collagen) and discard of the pellet. Samples were freeze-dried for∼48 h.
Bone collagen samples were submitted to the WSU Stable Isotope Core Laboratory (R. Dale Evans, Laboratory Director) for carbon and nitrogen stable-isotope ratio measurement on the Thermo-Finnigan Delta PlusXP continuous flow isotope ratio mass spec-trometer, coupled to a Costech Elemental Analyzer (ECS 4010). The ratios of nitrogen stable isotopes (15N/14N) and carbon stable isotopes (13C/12C) are conventionally expressed in δ notation in parts per thousand (per mil;‰) relative to a standard, as follows:
δð‰Þ= Rsample−RstandardRstandard×1000,
where RsampleandRstandard are the ratios of the heavier to the lighter isotope in the sample and the standard, respectively (62, 63). The international standard for nitrogen is atmospheric ni-trogen (AIR), and that for carbon is Vienna Pee Dee Belemnite. Within-run reference checks using an animal protein (casein) produced SDs of<0.1‰for bothδ13C andδ15N. The Upward Sun River fish bone collagen sample met the accepted quality standards [%N>5%, %C>13%, atomic C:N ratio 2.9–3.6; and collagen yield>1% (64–66)], as follows: %C=43.1, %N=12.6; atomic C:N=3.2; %Yield=7.0 [all concentrations are (wt/wt)].
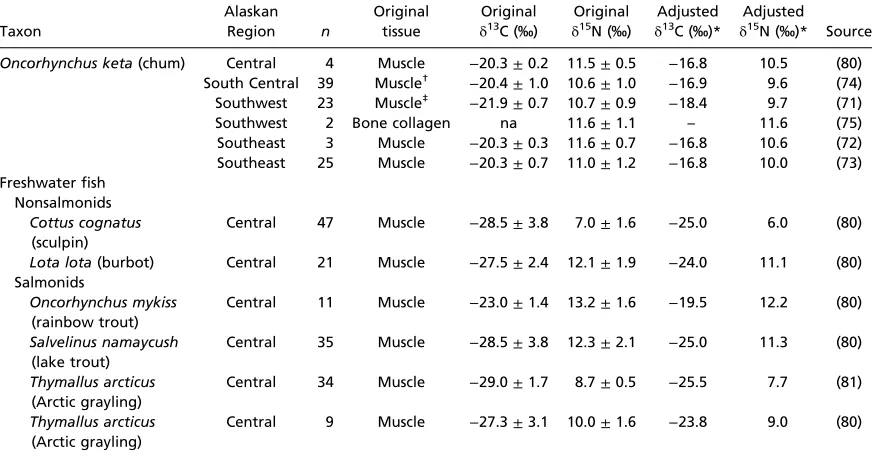
Comparativeδ13C andδ15N Values for Ancient and Modern Alaskan Fish Specimens.There are few publishedδ13C andδ15N values on bone collagen for prehistoric salmon from Alaska (67–69) and none for prehistoric freshwater fish, except for a small sample (n=2) of late-prehistoric burbot from the upper Kuskowkim River (70) (Table S4). None of the published ancient salmon were identified to species. Although there are several isotopic studies of modern salmon and freshwater fishes in Alaska (71–75), these analyzed muscle, which is not directly comparable to bone col-lagen. The δ13C and δ15N offsets between muscle and bone collagen have been published by Misarti et al. (69) for salmon, and are used here for all fish, including freshwater fish, as fol-lows:δ13C for fish bone collagen is 2.5‰ higher than muscle, whereasδ15N for fish bone collagen is 1‰lower than muscle. All published isotope values for modern fish muscle tissue were adjusted using these offsets (Table S5). Some studies of modern fish tissues extracted lipids before isotopic analysis (74) or cor-rected for lipid content (71), but we did not adjust isotope values further for this methodological difference.
A further correction is necessary to compare δ13C between ancient and modern tissues to account for the“Suess effect”(the reduction ofδ13C in the Earth’s carbon reservoirs as a result of industrial carbon emissions) (76). Here we use the maximum adjustment described by Misarti et al. (69) of 1‰to be added to modern tissueδ13C values for comparability with preindustrial values (Table S5). Note that the Misarti et al. (69) correction factor is for the oceanic Suess effect in the North Pacific. Be-cause the freshwater Suess effect has not been characterized for Alaska, we use the oceanic correction. The magnitude of the freshwater Suess effect may be slightly larger [e.g., the atmo-spheric Suess effect is roughly 1.5‰ (77)], but this would not greatly affect the pattern of differences seen in δ13C between chum salmon and freshwater fish in Alaska.
Fig. S1. USR osteometric values compared with various genetically identifiedOncorhynchusdatasets. (A) Fused vertebra (type III) measurements [data from Huber et al. (21)]. (B) Vertebral transverse diameter measurements of genetically identified salmon species [summary data from Moss et al. (18); original data: “1”Grier et al. (19),“2”Orchard and Szpak (20),“3”Moss et al. (18), and“4”Yang et al. (22)].
_ _ _ _ _ _ _ _ _ _ _ _ _ _ _ _ _
2WVKDZ\WVFKD&KLQRRN $7*$$$&777**&7&$&7&&7$**&&7$7*777$*&&$&&&$$$77&77$&&***&7&77&77$*&&$7$&$&7$7$&&7&&*$&$77
2NHWD&KXP 7*7&&&*&
7*7&&&*&
2NLVXWFK&RKR *
2FODUNLLKHQVKDZL&XWWKURDW 7&*
2P\NLVV5DLQERZWURXW *$7&*
6DOYHOLQXVPDOPD'ROO\9DUGHQ 77*$&&7
6DOPRVDODU$WODQWLF6DOPRQ 7&&&&7&
2JRUEXVFKD3LQN 7&&$&*&7
2QHUND6RFNH\H $&
Fig. S2. Multiple-alignment of ancient cytochromebsequences from specimen 58-18 and GenBank reference sequences. The dots indicate identical base pairs compared with the Chinook salmon sequence at the top. Ancient sequences have been truncated to remove primer sequences. GenBank accession numbers: Oncorhynchus clarkiiNC006897;Oncorhynchus mykissNC001717;Oncorhynchus tshawytschaNC002980;Oncorhynchus kisutchNC009263;Oncorhynchus nerka NC008615;O. ketaAJ314561;Oncorhynchus gorbuschaNC010959;Salvelinus malmaDQ298801;Salmo salarNC001960.
_ _ _ _ _ _ _ _ _ _ _ _ _ _ _ _ _
2FODUNLL&XWWKURDWWURXW 7$777777*7$7$&$77$$7$$$&7777$*7*&$&777$7$*&$777**&$&&*$&$$&*&7*7**7$&*7$&$&777&$7$$77$
2NHWD&KXP $**$$$*7$
$**$$$*7$
2WVKDZ\WVFKD&KLQRRN $**$$*
2NLVXWFK&RKR $*7*$$*$
2P\NLVV5DLQERZWURXW 7$*$$*&$
6DOPRVDODU$WODQWLFVDOPRQ &$7&&$7&7$&$7*&7
2JRUEXVFKD3LQN $*$*$$*7
2QHUND6RFNH\H $*$*$$*
_ _ _ _ _ _ _ _ _ _ _ _ _
2FODUNLL&XWWKURDWWURXW $*7$7$&$77$$7$$$&77777*$&&&&&77&*7$*&$7&7$*&$&&*$&$$&$&7*$7$7&$$7$&&
2NHWD&KXP &77$&$&7&*$7*&*
&77$&$&7&*$7*&*
2WVKDZ\WVFKD&KLQRRN &&7*&
2NLVXWFK&RKR &7$&&&**$*7$*&7
2P\NLVV5DLQERZWURXW &7$7&$*7*
6DOPRVDODU$WODQWLFVDOPRQ *&&7$$$7$$$&7$*7$*&&*&7$
2JRUEXVFKD3LQN &*$77$&$*&&*7*7&*&*
2QHUND6RFNH\H &$$*&*$7&**&
Fig. S3. Multiple-alignment of ancient d-loop sequences from specimen 58-18 and reference sequences. The dots indicate identical base pairs, and the dashes represent insertions/deletions compared with the Cutthroat trout sequence at the top. Ancient sequences have been truncated to remove primer sequences. GenBank accession numbers:O. clarkiiNC006897;O. mykissNC001717;O. tshawytschaNC002980;O. kisutchNC009263;O. nerkaNC008615;O. ketaAJ314561; S. salarNC001960.O. gorbuschareference sequence from Shedlock et al. (78).
O.clarkii henshawi (Cutthroat)
O.mykiss (Rainbow trout)
O.nerka (Sockeye)
O.tshawytscha (Chinook)
O.kisutch (Coho)
O.gorbuscha (Pink)
O.keta (Chum)
58-18
Salvelinus malma (DollyVarden)
Salmo salar (Atlantic Salmon) 87
91
76 60
52 72
0.01
O. clarkii (Cutthroat trout)
O. mykiss (Rainbow trout)
O. tshawytscha (Chinook)
O. kisutch (Coho)
O. nerka (Sockeye)
O. gorbuscha (Pink)
O. keta (Chum)
58-18
Salmo salar (Atlantic salmon) 99
78 63
0.02 A
B
Fig. S4. Phylogenetic tree displaying the relationships between (A) the obtained cytochromebhaplotype from specimen 58-18 and GenBank reference sequences. GenBank subspecies accession numbers:O. clarkiiNC006897;O. mykissNC001717;O. tshawytschaNC002980; O. kisutchNC009263;O. nerka NC008615;O. ketaAJ314561;O. gorbuschaNC010959;S. malmaDQ298801;S. salarNC001960. (B) The obtained d-loop haplotype from specimen 58-18 and GenBank reference sequences. GenBank subspecies accession numbers:O. clarkiiNC006897; O. mykissNC001717;O. tshawytschaNC002980; O. kisutch NC009263;O. nerkaNC008615;O. ketaAJ31456;S. salarNC001960;O. gorbuschaEF455489.1. Trees (NJ with Kimura 2-parameter, 2,000 replications) were composed using Mega 6.0 software, Tamura et al. (60). Bootstrap values<50% not shown.
Table S1. USR fish vertebrae samples subjected to aDNA analysis
ID Location Provenience Element Height (mm) Length (mm) Transverse diameter (mm) Weight (g)
58-18 Burial pit fill N501.578, E514.192,−1.226 SD Caudal vertebra 8.96 6.58 9.72 0.269
58-30 Burial pit fill N501.495, E514.262,−1.222 SD Caudal vertebra 8.95 6.44 9.71 0.242
H-5446 Cremation hearth N501.710, E514.360,−0.771 SD Caudal vertebra 7.25* 5.01* 8.19* 0.094*
*Minimum values due to burning.
Table S2. Sequencing results obtained at WSU
Sample Extract treatment Sequence span (nps)* Mutations*
58-18 None (1.5μL) 593–740 660T, 713T
Resilica extracted (1.5μL) 593–711 660T
1:10 dilution (1.5μL) 593–740 660T, 713T
1:50 dilution (1.5μL) 593–740 660T, 713T
58-30 None, first amplification (1.5μL) 593–740 660T, 713T
None, second amplification (1.5μL) 593–740 660T, 713T
H-5446 None (1.5μL) No DNA NA
None (3.0μL) No DNA NA
1:10 dilution (1.5μL) No DNA NA
1:50 dilution (1.5μL) No DNA NA
*Relative to NCBI accession number DQ288271.
Table S3. Primers used in the SFU Laboratory
Primer Target Locus Primer sequence (5′–3′) Fragment size (bp) Source
F271 Bony fish (Osteichthyes) COI CYAYCYTACCTGTGGCMAT 220 (79)
R271 ACTATAAAGAARATYATWACRAARGCRTG
F800 Salmon (Salmonidae) d-loop AACCCCTAAACCAGGAAGTCTCAA 248 (57)
R1048 CGTCTTAACAGCTTCAGTGTTATGCT
Cyt5 Salmon (Salmonidae) Cytb AAAATCGCTAATGACGCACTAGTCGA 168 (57)
Cyt6 GCAGACAGAGGAAAAAGCTGTTGA
Table S4. Publishedδ13C andδ15N values on bone collagen from prehistoric archaeological Pacific salmon and
freshwater fish specimens in Alaska
Taxon Alaskan region Site Age (cal B.P.) n δ13C (‰) δ15N (‰) Source
Pacific Salmon
Oncorhynchus keta Tanana basin Upward Sun River ∼11,500 1 −15.1 12.6 Present study
Oncorhynchusspp. Sanak, Aleutians Multiple ∼4500–150 91 −15.2±1.4 11.5±1.7 (69)
Oncorhynchusspp. Unalaska, Aleutians Amaknak ∼3590–2570 5 −15.0±0.3 11.6±1.2 (68)
Salmonid Kuskokwim Bay Nunalleq ∼610 2 −16.0±1.0 13.6±1.8 (67)
Freshwater
Lota lota(burbot) Kuskokwim basin Tochak ∼430 2 −23.5±4.6 9.7±2.9 (70)
Table S5. Publishedδ13C andδ15N values on tissues from modern chum salmon and freshwater fish from central Alaska
Taxon
Alaskan
Region n
Original tissue
Original
δ13C (‰)
Original
δ15N (‰)
Adjusted
δ13C (‰)*
Adjusted
δ15N (‰)* Source
Oncorhynchus keta(chum) Central 4 Muscle −20.3±0.2 11.5±0.5 −16.8 10.5 (80)
South Central 39 Muscle† −20.4±1.0 10.6±1.0 −16.9 9.6 (74)
Southwest 23 Muscle‡ −21.9±0.7 10.7±0.9 −18.4 9.7 (71)
Southwest 2 Bone collagen na 11.6±1.1 – 11.6 (75)
Southeast 3 Muscle −20.3±0.3 11.6±0.7 −16.8 10.6 (72)
Southeast 25 Muscle −20.3±0.7 11.0±1.2 −16.8 10.0 (73)
Freshwater fish Nonsalmonids
Cottus cognatus
(sculpin)
Central 47 Muscle −28.5±3.8 7.0±1.6 −25.0 6.0 (80)
Lota lota(burbot) Central 21 Muscle −27.5±2.4 12.1±1.9 −24.0 11.1 (80)
Salmonids
Oncorhynchus mykiss
(rainbow trout)
Central 11 Muscle −23.0±1.4 13.2±1.6 −19.5 12.2 (80)
Salvelinus namaycush
(lake trout)
Central 35 Muscle −28.5±3.8 12.3±2.1 −25.0 11.3 (80)
Thymallus arcticus
(Arctic grayling)
Central 34 Muscle −29.0±1.7 8.7±0.5 −25.5 7.7 (81)
Thymallus arcticus
(Arctic grayling)
Central 9 Muscle −27.3±3.1 10.0±1.6 −23.8 9.0 (80)
*Isotope values on modern fish tissue were adjusted for differences between tissue types and between ancient and modern tissues due to the Suess effect as follows (after ref. 69; see text for further details.):δ13C
prehistoric fish tissue=δ13Cmodern fish tissue+
1‰;δ13C
fish collagen=δ13Cfish muscle+2.5‰;δ15Nfish collagen=δ15Nfish muscle−1‰.
†Lipid extracted muscle. ‡Lipid corrected muscle.