ISSN 1392-2785 ENGINEERING ECONOMICS. 2005. No 2 (42)
ECONOMICSOFENGINEERINGDECISIONS
Integration of Sustainable Development Indicators into Sustainable Development
Programmes
Remigijus Čiegis, Dalia Štreimikienė
VU Kauno humanitarinis fakultetas Muitinės g. 8, LT-44280, Kaunas
The article deals with some theoretical aspects of society sustainable development management and discusses issues of integration of sustainable development indicators into prepa-ration of sustainable development strategies.
The article discuses economic growth and its impact of environmental pollution and income inequality. The idea of economic growth positive impact on sustainable development was elaborated by proposing implementation of environ-mental and social policies into economic development strate-gies. The Kuznets classical and environmental curves were discussed based on recent publications analyzing the relation-ship between income and pollution as well income and ine-quality.
Using theoretical approach the main requirements for sustainable economic development management system were formed. Indicators approach for the development of sustain-able energy programmes was elaborated. Indicators simplify information on complex phenomena and reduce information to the most important elements. Indicators also allow targeted data and information searches and the assessment of condi-tions and trends in relation to goals and targets. Sustainable development indicators are grouped according the main di-mensions of sustainable development: economic, social and environmental. 5 types of indicators are widely recognized: pressure indicators refer to direct stress factors, which human activities place on the environment. State indicators refer to the current conditions. Response indicators refer to the meas-urable aspects of policies developed by the society. Driving force indicators refer to socio-economic or socio-cultural factors driving activities that increase or mitigate the pressure on the environment. Impact indicators refer to effects caused by environmental conditions. Sometimes it is difficult to dis-tinguish between state and impact indicators.
Three principles in application of indicators approach were discussed and the proposals for the integration of indi-cators into national planning systems were developed based on the structure of National sustainable development strategy for Lithuania. Application of indicators of sustainable energy development in national energy strategy illustrated thereto-fore described approach.
The main principles of sustainable development are inte-grated in National sustainable development strategy. This strategy includes 6 branches of economy (transport, industry, energy, agriculture, household, tourism), 4 environmental sectors (air, water, biodiversity and waste), 4 main social aspects (employment, poverty and health, education, cultural identity) and regional development issues. All these economic, social, environmental and regional development issues are presented in close integrity.
Indicators for some branches and environmental sectors were proposed in the strategy but interlinkages and the con-sistent framework of indicators for monitoring progress to-wards all goals established in the strategy wasn’t performed. The article presents new approach for the selection of appro-priate indicators and integration of them into sustainable development strategies. This approach is based on idea that all the main sustainable development indicators are related to each other through the chain of impacts. Economic indicators have direct impact on social and environmental indicators therefore the main response actions or new policies should be implemented on the main driving force indicators of economic dimension.
Keywords: sustainable development, sustainable energy, sustainable development indicators
Introduction
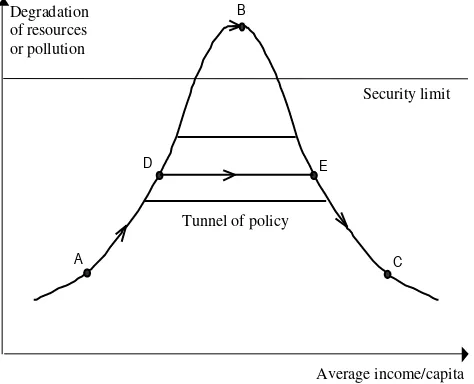
Though the essence of the sustainable development concept is clear enough, the exact interpretation and defini-tion of sustainable development has caused strong discus-sions. The sustainable development concept merges two urgent goals: a) to ensure appropriate, secure, wealthy life for all people – its is the goal of development, and b) to live and work in accordance with bio-physical limits of the environment – it is the goal of sustainability (Čiegis, 2002). These goals might seem contradictory, but some relative data on environmental quality and natural re-sources utilisation and income per person, allows us to make a presumption that environmental quality improves and income inequality diminishes with the increase of in-come per capita level. This interrelation between the na-tional income per person and emissions of pollutants is called the environmental Kuznets curve (Kuznets, 1955), analogous to traditional curve, proposed by Simon Kuznets (Figure 1), which demonstrates a similar relationship be-tween actual income per person and income inequality (Čiegis, Čiegis, 2002). This relationship proves that eco-nomic, ecological of sustainable development can be achieved together by implementing effective management of sustainable development (Stokey, 1998). So regulation in market system is necessary because there is no feedback mechanism to guarantee, unregulated market economy would never exceed its ecological capacity of the environ-ment (Daly, 1991).
2001). Some scientists argue that the shape of Kuznets curve is quite different for different countries and that such regularity does not exists (Coondo & Dinda, 2002; Selden &n Song, 1995). Though there is no firm agreement among scientists regarding Kuznets curves there is obvious rela-tionship between income and demand for environmental quality (McConnell, 1997). The increased income of popu-lation makes it possible to introduce environmental and social policies having significant impact on pollution re-duction, energy saving and poverty alleviation.
Security limit
Tunnel of policy
Average income/capita C E
B
D
A Degradation of resources or pollution
Figure 1. Kuznets ecological curve
Based on commonly agreed four dimensions of sustain-able development the same society sustainsustain-able development management approaches can be distinguished: a) economic, b) ecological, c) social, e) institutional. The economic sus-tainability management approach is based upon Solow’s (1986) amplified theory on capital substitutability and Hicks-Lindahl concept of maximum income, which can be acquired by saving essential essential capital resources for the benefit of future generations (Hicks, 1965). The ecologi-cal approach of sustainability management is based on Holl-ing’s (1973) concept that the primary task of economic de-velopment is to determine the natural systems limits for various economic activities. The social sustainability man-agement approach reflects the interface between develop-ment and dominating social systems, considering equality among different generations and ensuring qualitative growth striving towards perfection, harmony and deep self-cognition (Daly, 1990). Summing up the society sustainable development management can be considered as attempt to replace accents from material values, as the main goal of human existence, to the human needs, non-material, bal-anced and co-ordinate (Schumacher, 1975).
It is clear that for the management of the sustainable development of all dimensions there must be presented their own goals: for environmental – safeguarding the en-vironment; social – strengthening social coherence/justice; economic – satisfying material needs; institutional – par-ticipation/co-decision. It is, however, not enough to define targets for the four dimensions of sustainability. Therefore if we want to manager sustainability, the society is in charge of formulating sustainability objectives, which should be constantly review and assessed. Sustainable
de-velopment indicators can successfully measure the degree of objective implementation. Indicators should also reflect the interlinkages between social, economic and environ-mental targets of sustainable development (Spangenberg, Pfalh, Deller, 1999). For example Kuznets curves shows important interlinkages between economic and social and economic and environmental dimensions of sustainable development.
Indicator development is always a two-way process. Indi-cators are not only desired from policy aims, but they also help to concretise and mould them. Indicators are used in the decision-making mechanism of sustainable development and in the plan of its implementation. The big attention must be given to the modeling of sustainable development and to the preparation of strategies of sustainable development (Span-genberg, Omann, Bockermann, 2000).
Indicators approach to sustainable
develop-ment strategies
Indicators synthesize complex data, in order to com-municate vital information about the environment to offi-cials, politicians, and the public. Many governments, re-search organisations, and NGOs have worked on sustain-able development indicators. Among these, the OECD has been prominent in developing a common framework and common indicators for its member countries. OECD’s framework is based on the Pressure-State-Response (P-S-R) model: indicators describe pressures on the ment, its state, and societal responses to address environ-mental problems. The indicator concept, which was devel-oped by the OECD was widened by the European Envi-ronment Agency (EEA) and is being most broadly used by international organizations and local governments.
The main document dealing with sustainable develop-ment indicators is the Work Programme on Indicators of Sustainable Development (ISDs) adopted by the Commis-sion on Sustainable Development (CSD) at its Third Ses-sion in April 1995. This programme issued a working list of 134 indicators and methodology sheets for their calcula-tions. The aim of the CSD with respect to ISDs was to have an agreed set of indicators available for all countries to use by the year 2001.
Indicators for monitoring progress towards sustainable development are needed in order to assist decision-makers and policy-makers at all levels and to increase focus on sustainable development. Beyond the commonly used eco-nomic indicators of well-being, however, social, environ-mental and institutional indicators have to be taken into account as well to arrive at a broader, more complete pic-ture of societal development.
This list of indicators should be seen as a flexible list from which countries can choose indicators according to national priorities, problems and targets. The indicators are presented in a Driving Force – State – Response frame-work.
While indicators can have different functions depend-ing on the specific context and use, they are usually used in following roles by developing sustainable development strategies (Baltic Environmental Forum, 2000):
• Defining sustainable development targets and
conditions and economic and sectoral policy
• Reporting on environmental and social conditions • Evaluating environmental and social performance –
for example, the progress of national policies to-wards national objectives and international com-mitments
• Defining new policies for the implementation of
sustainable development targets.
The main long-term planning document – Long-term Lithuanian Economy Development Strategy was approved in 2002 in Lithuania. It comprises 15 branch strategies. The main principles of sustainable development are inte-grated in these strategies. Some of these branch strategies are directly aimed at interaction between sectors (the fac-tors of social development and economic facfac-tors of em-ployment, economic factors of environmental protection, tourism development, etc.). Despite a great integrity of the certain strategies, there is a lack of clear relations between the aforementioned 15 strategies. In order to solve this problem the National Strategy of Sustainable Development was adopted in 2003. This strategy includes 6 branches of economy (transport, industry, energy, agriculture, house-hold, tourism), 4 environmental sectors (air, water, biodi-versity and waste), 4 main social aspects (employment, poverty and health, education, cultural identity) and re-gional development issues. All these economic, social, environmental and regional development issues are pre-sented in close integrity. Sustainable development indica-tors for economical, social and regional development and state of environment are selected in the strategy for the monitoring of sustainable development however this sys-tem of indicators were not applied for the analysis of trends and only some targets of sustainable development were set using these indicators. Approach to integrate sus-tainable development indicators into national planning systems should be used with more extent. 3 principles may be singled out for the development of a system of indica-tors for sustainable development strategies (UN Depart-ment of Economic and Social Affairs, 2000):
• The topic approach, which was proposed by UN
CSD. The topics are the largest priority problems in economic, environmental and social sphere
• Problem approach, which means that for each
eco-nomic or other problem the special indicators are developed
• Capital approach is based on the types of capital –
natural, human, physical, aggregate.
The first approach is more widely used and has been tested out and used in 22 countries and is integral, ensures accessibility of information and comparability at the inter-national level. National sustainable development strategy may use this approach because the structure of Lithuanian national sustainable development strategy just follows this approach. Integration of ISD into preparation of strategy should be implemented by the following steps:
• To set targets of sustainable energy development • To analyse trends and interlinkages of selected
indi-cators of sustainable development
• To formulate response actions based on performed
analysis
• To monitor the progress achieved towards set targets
• To evaluate efficiency of implemented policies.
In the following chapter the sustainable energy devel-opment indicators approach was used to illustrate applica-tion of ISD in preparaapplica-tion of sustainable development strategies. Energy sector is the priority sector in economic development because energy is closely connected with social, economic development, quality of life and it’s pro-duction and consumption has the significant impact on environment.
Sustainable energy development strategy
The energy use is considered as a basic driving force that impacts environment. It is major contributor to envi-ronmental problems of global concern, such as climate change, acidification and urban air pollution. Energy is crucial for economic and social development, quality of life and consumption level. According sustainable devel-opment concept it is necessary to incorporate sustainable development goals into all sectoral policies (World Energy Assessment, 2000).
Appropriate list of sustainable energy development in-dicators were selected for the Lithuanian sustainable en-ergy strategy preparation. These indicators can address the priority concerns or strategic priorities of energy sector development with defined headline targets (quantified sus-tainable energy development targets based on EU acces-sion criteria) and relevant Response Actions that corre-spond to indicators selected. The Response actions on tar-geted indicator would define the possible policy measures and actions to be implemented seeking to achieve progress upon headline targets.
The priority areas were selected based on the main en-ergy policy directions developed by third national enen-ergy strategy. These priorities and targets are related with EU accession:
• Energy consumption • Energy intensities • Structure of the economy • Energy security
• Energy prices and energy affordability • Environmental energy situation.
Seeking to review the state of energy priorities it is necessary to select the relevant indicators and complete analysis of trends and impacts from current energy poli-cies. Trends in economics and demographics are the main socio-economic indicators that’s can be considered as driv-ing forces for energy consumption, energy intensities, en-vironmental energy situation etc. So first of all it is neces-sary to assess trends in economics and demographics. Later trends in energy consumption and energy intensities, struc-tural changes in economy and other trends can be assessed. Later trends can be related to implemented energy policies and new policies can be formulated. First four priority ar-eas are attributable to economic dimension indicators. En-ergy prices and enEn-ergy affordability reflect social dimen-sion indicators. Environmental energy situation is repre-sented by environmental dimension indicators (CO2 emis-sions).
supply per capita) the following conclusions was drawn:
• Final energy consumption per capita is more than 2
times lower in Lithuania than in EU and is continu-ously decreasing. At the same time final energy consumption per capita is slowly increasing in EU. So the difference between final energy consumption level in EU and Lithuania is still increasing.
• Electricity per capita consumption growth trends
are negative in Lithuania. Since 1994 some stabili-sation of electricity per capita growth can be no-ticed. This trend is negative because there is no other way to increase economic growth and quality of life without increase in electricity consumption per capita.
• Low final energy and electricity consumption per
capita shows the low income and low living stan-dards in Lithuania. Therefore the further analysis of energy affordability is necessary seeking to define reasons for such low final energy and electricity consumption.
• The big difference between TPES and final energy
consumption per capita shows the low energy con-version efficiency in Lithuanian energy system comparing with EU. Further analysis of energy utilisation efficiency and energy intensities is nec-essary seeking to define measures able to improve situation.
From analysis of energy intensity (TPES/GDP PPP, Final energy/GDP PPP) the main conclusion is that pri-mary energy intensity of GDP in Lithuania is more than twice higher than EU average (IEA statistics, 2001; IEA statistics, 2002). Though in EU the positive trends of de-coupling of final energy and electricity consumption per capita from final energy and electricity intensity can be noticed in Lithuania final energy and electricity intensity of GDP is decreasing more slowly than final energy and electricity consumption per capita. These trends should be changed. Seeking to define the impact of the changes in the structure of economy on the energy intensity decrease the less aggregated analysis of energy intensity is necessary.
Analysis of structural changes in Lithuanian economy (Value added produced by different sectors of economy, energy intensities in economic sectors) showed that their had a positive impact on energy intensity decrease. The share of value added from industry decreased but from commercial sector, which is the least energy intensive, increased. In general energy intensity decreased in all branches of economy but reduction of energy losses and implementation of energy efficiency measures is still needs to be a priority area in energy supply and consumption.
Energy security issues are problematic in Lithuania. The net energy import dependency in Lithuania is almost 90% (Lithuanian energy institute, 2003). As Lithuanian energy sector depends on energy import a lot it is neces-sary to increase indigenous energy production and utiliza-tion of renewable energy sources. In 2000 indigenous or renewable energy sources in total primary energy mix amounted to 9.2%. EU target is 12% of renewable energy sources in the overall energy balance by 2010. The same target is set for Lithuania in National energy strategy adopted in 2002. The share of indigenous electricity to
total electricity production is very small in Lithuania and makes about 3%. In EU this indicators is high more than
14%. The EU target for year 2010 is 22.1%. Lithuania
agreed with EU to implement 7%. Measures to enhance utilisation of renewable energy sources are necessary.
Household energy prices are very high in Lithuania comparing with income. Energy affordability can be treated as social problem Lithuania. The worst situation with energy affordability in Lithuania is in heating sector because district heat prices in Lithuania are very high (only about 14% lower than in EU countries) comparing with low disposable income of population (more than 4 times lower than in EU). The amount of heat that could be con-sumed monthly to current consumer prices and income indicates that in Lithuania the heat witch can be consumed by average population is 13 times lower than in EU. The amount of electricity-consumed daily to current electricity prices in Lithuania was 8 times lower comparing with EU average and electricity prices were 2.3 higher in EU (Baltic Environmental Forum, 2001). Seeking to ensure energy affordability social support schemes to low-income popu-lation are necessary.
The main environmental problem in energy sector is climate change. In EU CO2 emissions per kWh are twice higher than in Lithuania and electricity consumption per capita is also more than twice higher (IEA statistics, 2003). The trend of CO2 emissions decrease with increase of elec-tricity consumption per capita can be noticed in EU. In Lithuania other trends can be noticed – the decrease of electricity consumption per capita is stipulated by decrease of CO2 emissions per kWh. Only in the case of implemen-tation of appropriate GHG mitigation measures Lithuania will be able to fulfil the Kyoto commitments after the clo-sure of Ignalina nuclear power plant.
The most problematic areas in Lithuanian energy sec-tor are: energy intensity, utilisation of renewable energy sources and energy affordability. New policies to address these problems should be implemented (new support schemes for low income population to increase energy affordability, new measures to enhance renewable energy sources utilisation, reduction of energy transformation losses in the system, local and international climate change mitigation measures).
Conclusions
Example of integration of indicators of sustainable en-ergy development into sectoral sustainable strategy prepa-ration illustrates that this approach can help to carry out analysis of interlinkages between social, economic and environmental development targets, evaluate their trends and define relevant policy measures implementing sustain-able development management concept.
Appropriate list of sustainable energy development in-dicators addressing priority concerns of Lithuanian energy sector development were selected for Lithuanian sustain-able energy strategy preparation. The targeted indicators were defined establishing quantified sustainable (eco-nomic, social and environmental) energy development tar-gets based on EU accession criteria. The Response actions on targeted indicators or possible policy measures and ac-tions to be implemented seeking to achieve progress upon headline targets were proposed in the strategy.
References
1. Baltic Environmental Forum. 2nd Baltic State of the environment
report based on environmental indicators, 2002.
2. Čiegis, R. Sustainable Development and the Environment: the
Eco-nomic View. Vilnius, 2002.
3. Čiegis, R. The Possibilities of the Environmental Kuznets Curves for
Going Toward Sustainable Economic Development / R. Čiegis, R. Čiegis // Engineering Economics, 2002, No 3, p. 14 – 18.
4. Coondoo, D. Causality between income and emission: a country group-specific econometric analysis / D. Coondoo, S. Dinda //Ecological Economics, 2002, No 40, p. 351-367.
5. Daly, H. E. Steady- State Economics, 2nd Edition, San Francisco,
1991.
6. Daly, H. E. Toward some operational principles of sustainable devel-opment // Ecological Economics, 1990, No 2, p. 1 – 6.
7. Baltic Environmental Forum, The Regional Environmental Cen-ter for Central and East Europe. Economic transition: environ-ment transition. A case study of the Baltic States based on head-line indicators, 2001.
8. Lithuanian Energy Institute. Energy in Lithuania 2002. Kaunas, 2003.
9. Hicks, J. R. Capital and Growth. Oxford, 1965.
10. Holling, C. S. Resilience and stability of ecological systems // Annual Review of Ecology and Systematics, 1973, No 4, p. 1 – 23.
11. IEA statistics. Energy statistics of OECD countries 1998-1999. 2000 Edition, 2001.
12. IEA statistics. Energy statistics of OECD countries 1998-1999. 2001 Edition, 2002.
13. IEA statistics. CO2 emissions from fuel combustion 1971-2001, 2003.
14. Kuznets, S. Economic growth and income inequality // American Economic Review, 1955, No 49, p. 1-28.
15. McConnell, K. E. Income and the demand for environmental quality. Environment and Development Economics, 1997, No 2, p. 383-399. 16. Pearson, P. J. G. Energy, externalities, and environmental quality:
will development cure the ills it creates // Energy Studies Review, 1994, No 6, p. 199-216.
17. Schumacher, E. Small is beautiful. A study of economics as if people mattered. London, 1975.
18. Selden, T. M. Neoclasical growth, the J curve for abatement and the inverted U curve for pollution / T. M. Selden, D. Song // Journal of Environmental Economics and Environmental Management, 1995, No 29, p. 162-168.
19. Solow, R. M. On the intergenerational allocation of exhaustible resources// Scandinavian Journal of Economics, 1986, No 88 (2), p. 141-156.
20. Spangenberg, J. H. Indicators for institutional sustainability / J. H. Spangenberg, S. Pfahl, K. Deller // In Proceedings of the Second Bi-annual INDEX Conference on Indices and Indicators of Sustainable Development: A System Approach to Natural and Social Dynamics, St. Petersburg, Oxford, 1999.
21. Spangenberg J. H. Modelling sustainable development. Indicators for institutional sustainability / J. H. Spangenberg, I. Omann, A. Bock-ermann, B. Meyer // Integrative Systems Approaches to Natural and Social Dynamics, Berlin, 1999.
22. Stern, D. I. Explaining changes in global sulphur emissions: an econometric decomposition approach// Ecological Economics, 2002, No 42, p. 201-220.
23. Stern, D. I. Is there an environmental Kuznets curve for sulphur?/ D. I. Stern, M. S. Common // Journal of Environmental Economics and Environmental Management, 2001, No 41, p. 162-178.
24. Stokey, N. L. Are there limits to growth?// International Economic Review, 1998, No 39 (1), p. 1-31.
25. UN Department of Economic and Social Affairs. Energy and Sus-tainable Development: Options and Strategies for Action on Key Is-sues, 2000.
26. World Energy Assessment. Energy and the Challenge of Sustainabil-ity. Overview, UNDP, 2000.
Remigijus Čiegis, Dalia Štreimikienė
Darnaus vystymosi rodiklių integravimas darnios plėtros programose
Santrauka
Straipsnis supažindina su kai kuriais teoriniais darnaus vystymo-si koncepcijos aspektais bei su darnaus vystymovystymo-si indikatorių
integ-ravimo darnaus vystymosi strategijose klausimais.
Straipsnyje aptariamas ekonominis augimas ir jo poveikis aplin-kos taršai bei pajamų pasiskirstymo netolygumui. S. Kuznets
klasikinė kreivė aprašo BVP/gyventojui augimo įtaką pajamų
pasiskirstymo tarp gyventojų netolygumui šalyje. S. Kuznets
ekolog-inė kreivė parodo BVP/gyventojui augimo įtaką gamtinių išteklių
vartojimui ir taršai. S. Kuznets kreivės yra varpo formos ir aiškiai
rodo, kad didėjant BVP/gyventojui pradžioje pajamų pasiskirstymo
netolygumas bei gamtinių išteklių naudojimas ir tarša auga, bet,
pasiekus tam tikrą, pakankamai aukštą BVP/gyventojui lygį, pajamų
pasiskirstymo netolygumas bei tarša ima mažėti. Straipsnyje
eko-nominio augimo pozityvus poveikis aplinkosauginių ir socialinių
darnaus vystymosi dimensijų srityje išryškintas, pasiūlius
aplinko-sauginių ir socialinių politikos priemoniųįgyvendinimą ekonominės
plėtros strategijose. Straipsnyje išnagrinėtos S. Kuznets klasikinė ir
aplinkosauginė kreivės, remiantis naujausių tyrimų, paneigiančių arba
patvirtinančių S. Kuznets nustatytus dėsningumus, šioje srityje
medžiaga. Kadangi mokslininkai tarpusavyje iki šiol nesutaria, ar ekonominis augimas veikia pajamų pasiskirstymo netolygumus ir
taršą, kaip nustatė S. Kuznets, tačiau galima padaryti išvadą, kad nors
ne visose šalyse ir ne visada varpo formoje išsidėsto ekonominį
augimą bei taršą ir pajamų nelygybę atspindintys rodikliai, galima
vienareikšmiškai teigti, kad kaip tik aplinkosaugos bei socialinės
politikos priemoniųįgyvendinimas augant ekonomikai, gali užtikrinti
taršos bei socialinės nelygybės mažėjimą, o to ir būtina siekti, nes S.
Kuznets kreivė logiškai parodo, kad, turint daugiau piniginių išteklių,
lengviau užtikrinti socialinių bei aplinkosauginių problemų
sprendimą, ir natūraliai turingesnės šalys daug daugiau dėmesio ir
finansinių išteklių skiria aplinkos apsaugai, energijos efektyvumo
didinimui, naujoms technologijoms, naudojančioms atsinaujinančius
išteklius, bei stengiasi kuo geriau pasirūpinti skurstančiąja ar
so-cialinėje atskirtyje gyvenančia visuomenės dalimi.
Straipsnyje suformuota teorinė pagrindinių darnaus ekonomikos
vystymosi dimensijų sistema bei parengta tą sistemą atitinkančių
indikatorių sistema, skirta darnaus vystymosi programų rengimui.
Indikatoriai yra labai lankstus politikos formavimo įrankis,
palengvi-nantis informacijos pateikimo kompleksiškumą ir sumažinantis
rei-kalingos išnagrinėti informacijos kiekį iki svarbiausių elementų.
Indikatoriai taip pat įgalina efektyvią duomenų ir informacijos
paieš-ką bei duomenų palyginimą. Darnaus vystymosi indikatoriai yra
sugrupuoti pagal pagrindines darnaus vystymosi dimensijas: eko-nominiai, socialiniai ir aplinkosauginiai. Plačiai pripažinti yra penki
indikatorių tipai: poveikio indikatoriai, būsenos indikatoriai,
indikato-riai perduoda tiesioginį žmogaus veiklos poveikį aplinkos būklei;
būsenos indikatoriai atspindi dabartines sąlygas arba reiškinio
būseną. Kadangi poveikio indikatoriai atspindi efektus, sukeltus
ap-linkos sąlygų, kartais sunku rasti būsenos ir poveikio indikatorių
skirtumą. Reagavimo indikatoriai rodo politikos priemonių poveikį
visuomenei. Varomosios jėgos indikatoriai, atspindintys socialinius
ekonominius ar socialinius kultūrinius faktorius, įgalina padidinti
arba sumažinti poveikį aplinkai.
Buvo apžvelgti trys indikatorių pritaikymo principai ir pateikti
indikatorių integravimo į nacionalinę planavimo sistemą pasiūlymai,
remiantis Lietuvos Nacionalinės darnaus vystymosi strategijos
struk-tūra. Ši strategija apima 6 ekonomikos šakas (transportą, pramonę,
energetiką, žemės ūkį, namųūkį, turizmą), 4 aplinkos sektorius (orą,
vandenį, biologinę įvairovę ir atliekas), 4 pagrindinius socialinius
aspektus (užimtumą, skurdą ir sveikatą, švietimą, kultūrą) ir
regioni-nės plėtros problemas. Visos šios ekonominės, socialinės,
aplinko-sauginės ir regioninės plėtros problemos yra glaudžiai susijusios ir
sudaro visumą. Strategijoje buvo pasiūlyti kai kurių ūkio šakų ir
aplinkosauginio sektoriaus indikatoriai, tačiau nebuvo įvertinta jų
tarpusavio sąveika, taip pat nebuvo atliktas šių indikatorių trendų
laike palyginimas. Straipsnyje pateiktas darnaus vystymosi indikato-rių parinkimo ir jų integravimo į darnaus vystymosi strategijoje
me-todas. Šio metodo svarbiausia idėja yra ta, kad visi pagrindiniai
dar-naus vystymosi indikatoriai yra susiję vienas su kitu per jų
nuosek-laus tarpusavio poveikio grandinę. Ekonominiai indikatoriai turi
tiesioginę įtaką socialiniams ir aplinkosauginiams indikatoriams,
todėl naujos politikos priemonės, turinčios įtakos ekonominės
dimen-sijos indikatoriams, turėtų būti įgyvendinamos pirmiausia. Siekiant
efektyviai panaudoti darnaus vystymosi indikatorius darnaus vysty-mosi strategijų arba programų rengime, pirmiausia būtina nustatyti
prioritetines darnaus vystymosi problemas Lietuvoje. Naudojant būklės indikatorius bei juos lyginant, pavyzdžiui, su ES-15 šalių
vidurkiu, galima nustatyti, ar esama būklė yra patenkinama, ar
kritiška. Kadangi indikatoriai yra susiję, nustačius pagrindines
prob-lemas, parenkami kiti ekonominės, socialinės ir aplinkosauginių
di-mensijų indikatoriai (poveikio,būsenos, reagavimo ir varomosios
jėgos indikatoriai), veikiantys arba aprašantys iškeltą problemą arba
prioritetus. Nagrinėjant indikatorių kitimą laike bei jų tarpusavio
poveikį galima ne tik atspindėti problemą nuoseklioje indikatorių
grandinėje, bet ir pasiūlyti atsakomąsias priemones, nukreiptas į
varomosios jėgos indikatorius, kurios garantuotų būklės indikatorių
kitimą norime linkme, sušvelnintų krizinę situaciją arba įgalintų
pasiekti negatyvių tendencijų persilaužimą.
Kadangi šalys labai skiriasi savo išsivystymo lygiu, jų darnaus
vystymosi problemos taip pat skiriasi. Lietuva, kaip pereinamojo laikotarpio ekonomikos šalis, susiduria su daugeliu darnaus vysty-mosi problemų, atspindinčių pasaulinius darnaus vystymosi
pri-oritetus. Lietuvoje paruošta Subalansuotos plėtros įgyvendinimo
ataskaita bei parengta Nacionalinė subalansuotos plėtros strategija.
Straipsnis siekia ne atkartoti šių svarbių dokumentų teiginius bei
išvadas, bet, taikant apibrėžtą rodiklių sistemą, atspindinčią
pri-oritetinius visų pasaulio šalių darnaus vystymosi tikslus, apžvelgti
Lietuvos darnaus vystymosi rezultatus bei problemas.
Kaip rodo atlikta, (kad ir labai paviršutiniška), analizė,
Lietu-voje daugiausia problemų kelia socialiniai darnios plėtros tikslai,
tokie kaip gyventojų sveikatos būklė, skurdas bei lyčių lygybė.
Svei-katos rodikliai, kurie kelia didžiausią nerimą Lietuvoje, yra aukšti
kūdikių bei gimdyvių mirtingumo rodikliai, palyginti su ES šalimis,
bei tuberkuliozės atvejų 100 000 gyventojų aukštas rodiklis. Be to, ir
vidutinės būsimojo gyvenimo trukmės rodiklis Lietuvoje yra žemas,
palyginti su ES. Dabartiniu metu moterų gyvenimo trukmė trumpesnė
1,5, o vyrų 5 metais,palyginti su ES vidurkiu, nors nuo 1995 m.
ryškėja pažangios augimo tendencijos.
Pagrindinis ekonominis rodiklis, parodantis šalies ekonominę
gerovę, BVP, tenkantis vienam gyventojui, perskaičiuotas pagal PGS,
Lietuvoje yra tris kartus mažesnis už ES vidurkį. Nacionalinis skurdo
lygis siekia 16 proc.
Darnaus vystymosi principų integravimo į šalies politikas
rodik-lių, tokių kaip miškingumas, saugomų teritorijų aprėptis, dinamika
Lietuvoje pasižymi pažangiomis tendencijomis. Energijos intensyvu-mas be CO2 emisijos vienam gyventojui taip pat mažėja nuo 1990 m,
tačiau šioje srityje negalime vienareikšmiškai teigti, kad viskas gerai.
Lietuvos parengta nacionalinė subalansuotosios plėtros į
gyvend-inimo ataskaita, skirta Johanesburgo susitikimui, parodė, kad Lietuvos
ekonomika atsigauna ir auga, o aplinkos tarša beveik nedidėja, tačiau,
uždarius Ignalinos AE, kai pasikeis energijos gamybos šaltinių
struk-tūra, šie trendai gali pasikeisti, todėl Lietuvos prioritetinėse darnaus
vystymosi kryptyse atsispindi ir energetikos plėtros klausimai.
Be to, nereikia užmiršti, kad ekonomikos plėtros tikslas yra
var-tojimas, o ne gamyba, todėl šalia rodiklių, įvertinančių aplinkos būklę
bei gamybos efektyvumą, būtina nagrinėti tokius rodiklius kaip
galu-tinės energijos, elektros energijos suvartojimas vienam gyventojui,
kurie atspindi gyvenimo lygio standartus.
Energijos intensyvumo, CO2 emisijų kWh mažėjimas mažėjant
energijos suvartojimui 1 gyventojui rodo, kad energetikos plėtra nėra
darni: energijos intensyvumas ir tarša Lietuvoje mažėja ne dėl pažangių
gamybos būdų ir energijos efektyvumo augimo, bet dėl mažėjančio
energijos suvartojimo, kuris ir taip rodo žemus gyvenimo lygio standar-tus. Tuo tarpu ES šalyse matomos priešingos tendencijos – energijos suvartojimas vienam gyventojui nuolatos didėja, nežymiai mažėjant
energijos intensyvumui ir CO2 emisijoms vienam gyventojui.
Raktažodžiai: darnus vystymasis, darnus energetikos vystymasis, darnaus vystymosi indikatoriai.