Vol.9 (2019) No. 6
ISSN: 2088-5334
The Implementation of Forecasting Method by Incorporating Human
Judgment
Inna Kholidasari
#1, Lestari Setiawati
#2, Tartila
#3 #Industrial Engineering Department, Universitas Bung Hatta, Jalan Gajah Mada, Padang, 25173, Indonesia E-mail: [email protected]; [email protected], [email protected]
Abstract— Business Forecasting (demand forecasting) is an extrapolation process to predict the events that will be happening in the future. Commonly, forecasting methods are divided by two approximations of procedure; those are quantitative and qualitative methods. In a production system, it is important to predict the demand for the next period. This prediction is done by doing the demand forecasting task. This task is the basis of production planning and control in a production system. The case organization in this research deals with a huge number of products. The manager has to do the replenishment order of the product in every period. Usually, the managers do the forecast based on the demand of the last period. This task indeed not an easy task and sometimes the manager determines the ordering size based on she/he intuition and experience (human judgment). This procedure resulted in a high value of forecasting error that gives some impacts to inventory (occurring overstock and stock out). An appropriate forecasting method is needed to avoid the error value when the forecaster decides the size of demand for the next period. This study aims to investigate an appropriate forecasting method for the business retailer by incorporating human judgment. By using 28 period of time series data from a retailer in Surian, Solok Selatan, West Sumatra, quantitative forecasting methods (Mean, Moving Average, Single Exponential Smoothing (α = 0.1)), qualitative forecasting method (pure judgment), and the combination of quantitative and qualitative forecasting methods are used for the purpose of data analyses. The finding of the research shows that the quantitative forecasting method has a clear procedure to do forecasting tasks and suitable for the products that have time-series data. Furthermore, qualitative forecasting method such as human judgment is needed for a particular situation (for example for the new products, promotion event, etc.) and when managers have some contextual information regarding the products under concern.
Keywords— forecasting; human judgment; combined method.
I. INTRODUCTION
Forecasting is a stage in inventory management, which is the events in the future are extrapolated [1]. In a production system, it is important to predict the demand for the next period. This prediction is done by doing the demand forecasting task. This task is the basis of production planning and control in a production system. Without doing a forecasting task, a business cannot decide how many products have to be made or to purchase. The demand forecasting task is conducted to obtain the values of parameters of a demand distribution over lead-time. These values are used in the decision-making process of stock control decisions [2]. Since there are many procedures of forecasting, the forecasters have to choose an appropriate procedure. The forecasting task that is deploying a proper forecasting procedure will produce forecasting results with high accuracy.
In terms of demand forecasting, an appropriate forecasting procedure is needed to be decided to obtain the best performance of forecasting results. Commonly, the
forecasting procedures are chosen based on the characteristics of the demand. There are several demand characteristics such as Eaves [3] which is classifying demand patterns based on the variability of the transaction, demand size, and lead-time. Moreover, the Eaves categorization scheme divides the patterns of demand into smooth slow-moving, irregular, erratic, and highly erratic. By defining the characteristics, the forecasters can determine an appropriate forecasting procedure.
In addition, forecasting procedures may divide into fast and slow-moving demand. If in every period of time horizon of forecast there is a demand, then we can say the demand pattern is fast-moving demand. In other hand, when the demand only occurs sporadicity in some time periods, the demand characteristic is called slow-moving or intermittent demand pattern [4]–[8].
analysis and deploy algorithms. Some quantitative forecasting methods which are commonly used by companies are Time Series Method [2]. Furthermore, qualitative or judgmental forecasting techniques are a forecasting procedure that generally relies upon the judgment of experts to generate forecasts (for example, Pure Judgment, historical analogized, Delphi method, etc.) [9]. These methods are used when we cannot obtain the historical demand data series or the condition a long-time horizon of forecasting is kept changes. By using the qualitative forecasting methods, the forecaster can make decisions more quickly to anticipate the effects of the changes in the future. However, Mic [10] suggests that all forecasting techniques (qualitative and quantitative) need some kind of data, especially for the new product, which does not have historical data, and the information about the market may not be available. Recently, many studies discussed the combination of qualitative and quantitative procedures [11]–[13]. The quantitative or statistical forecasting model is widely accepted in theory, but it seems difficult to apply in practice since the statistical forecasting model tends too simple, misspecified, and incomplete [14]. This study discusses the forecast combination using the R package ForecastComb software. It is a software that implements the combination forecasting model which is covers 15 popular forecasting methods for creating a combined method forecasts.
Moreover, this research also states that choosing a single forecast that resulted in a better forecasting result is by combining some forecasting procedures. In Chindia [15], ‘objective’ and ‘subjective’ forecasting methods are used in representing quantitative and qualitative forecasting methods, respectively. This study also evaluated the combined forecasting method, besides the qualitative and quantitative forecasting method, in terms of the accuracy of performance forecasting in large manufacturing firms. In the context of Supply Chain Management, Qiu and Wang [16] stated that many retailers and manufacturers had been adopted and implemented innovative and integrated procedures the planning process, forecasting, and replenishment order quantity based on network technology using a bayesian procedure.
Moreover, inaccurate forecasting results will produce a high value of forecasting errors. These errors will give some impacts on an increase in costs, such as inventory cost and opportunity cost. Another aspect such as information sharing between supplier or manufacturer and downstream retailers, is also needed to obtain the good of the performance of forecasting tasks [17]. This study suggests that the type of sharing, such as voluntary and mandatory sharing will give benefits to the companies in terms of forecast accuracy. Voluntary-sharing is the sharing decision made by the manufacturer after obtaining the results of the forecast, whereas the latter is the information sharing that happened because the manufacturers are asked to share its forecasts.
In business, decision making in an essential aspect to gain the benefit. The manager of the organization has to make the right decision and also consider the speed and the accuracy of their decision in making a decision. The decision of the quantity and the time of replenishment order of item (inventory decisions) are some decisions that have to be
made. Furthermore, to make those decisions, decision-makers have to expect the size of demand for the next period. This task can be done by doing a forecasting task. In demand forecasting, the decision-maker decided the number of products to be made based on the information from past and/or future data. The accuracy of forecasting results will impact the performance of the stock control system in terms of over of inventory positions and stock out of the products. Overstocks will happen if forecasting results are higher than actual demand and it will increase inventory cost, whereas stock out is the impact that will happen if forecasting results are smaller than actual demand. Overstock that happens will cause the opportunity cost.
The case organization in this research is a retailer that deals with a huge number of products such as grocery and household products. The manager has to do the replenishment order of the product in every period to fulfill demand. The size of demand when demand occurs may be constant or in highly variable [14], [18]–[21]. For these conditions, the manager has to predict the demand of products for the next period on the right way to avoid overstock and/or stock out. In other words, the manager has to do a forecasting task which is resulting in the overstock forecasting error value.
Furthermore, the obsolescence has frequently happened in this category of demand [14], [22]. Obsolescence also impacts overstock that occurs in significant number of periods. Of course, these items will not give benefit to the organization. This task indeed not an easy task for the managers. The solution to the retailer’s problem will depend on three aspects; those are demand forecasts, delivery methods and the process in the Forecasting Support System of the retailer is applying such system [23]. The manager of the case organization tends to determine the ordering size based on she/he intuition and experience (human judgment) and just consider the past demand data. They do not have any appropriate procedure to do this task to avoid the increasing costs causing by forecasting errors. The forecasting procedure conducted by the manager of the case organization tends to have a high value of forecasting error that gives some impacts to inventory (occurring overstock and stock out). The manager of these organizations needs to determine an appropriate procedure of forecasting, both qualitative and quantitative forecasting methods, or the combination of these methods to avoid the error value when he/she decided the size of demand for the next period. We can say that stock out happens when the organization is unable to meet customer demand due to the unavailability of goods in its inventory [24]. The study suggested that the problem of the stock-out condition in the warehouse can be solved by performing demand forecasting, the level of safety stock, and well managed of the time of replenishment order in order to anticipate the stock out condition along a lead time.
organization, (3) Evaluate the impacts of forecasting results on overstock and stock on condition that happened in those particular periods.
II. MATERIALS AND METHOD
The methodology of this research is explained as followed. First, a survey is conducted to get an understanding of the rule or procedure of forecasting task that is done by the manager of a retailer (the case study organization). The case study organization is a retailer in Surian, Solok Selatan, West Sumatra, Indonesia that provides grocery and household products. Since the retailer has a huge amount of product, this research only investigates some products (soap and detergent) that have time data series for some periods happen and they are sufficient for the analysis of the research. The manager of the case organization conducted forecasting on their product based on his/her intuition and experience and considering just the demand data in the last period.
Moreover, the time series of demand data per period (weekly) is collected and the time horizon is 28 weeks. The product that is chosen for the analysis is households such as soap and detergent since these products have sufficient time-series data and can be analyzed to get the information regarding the demand in the future. In this research, quantitative forecasting methods, qualitative forecasting methods and the combination of these methods are used for data analysis. Quantitative methods are chosen by using the criteria of demand categorization. Demand characteristics of the item of goods under concern will be plotted to define the pattern or the type of demand (fast-moving or slow-moving demand pattern.
For applying qualitative forecasting methods, Mean Method, Moving Average, Single Exponential Smoothing (α
= 0.1) are chosen since these methods seem appropriate for fast-moving demand. Commonly, Overstock demand pattern of household products like soap and detergent have Overstocks demand pattern because there is a quantity of demand in every period. Moreover, pure judgment is chosen for the qualitative forecasting method since this method is deployed by the manager of the case study organization. A combination of two types of forecasting methods is used to analyze the performance of forecasting results. The methods that are applied in this study can be defined in detail as below:
A. Mean Method
If Ft+1 is a forecasting result at period t+1, Yi is actual
data, and t is a forecasting period, thus:
=+
=
t
i i
t
y
t
F
1 1
1
(1)
B. Moving Average Method
This method is using the fixed number of actual data in every period. Real data at the oldest period will be replaced with the actual data in the newest period. Thus, if the number of actual data is k, the moving average method can be defined as:
+ − =+
=
t
k t i
i
t
Y
k
F
1 1
1
(2)
C. Single Exponential Smoothing Method
If yt is the demand at t period, then the single exponential
smoothing demand forecast during period t + 1 (product at the end of period t) is given by
(3)
where α is the constant smoothing value used (0<α<1) in period t. In this research, α = 0.1.
Quantitative methods (Mean, MA, SES) are applied to the initial stage (for 14 periods) to define the best performance of the method. The most appropriate method is the method that has the smallest forecasting error.
The forecasting error is the difference between forecasting results and actual data. Forecasting error is calculated by using a forecasting error method. Mean Absolute Error (MAE), Mean Square Error (MSE), and Standard Deviation Error (SDE) are forecasting error methods used in this research. The most appropriate method is the method that has the smallest forecasting error. Once the best method is defined, then this method is continued to apply for the rest periods (until 28 periods) to find the forecast result and forecasting error. Minimizing forecasting error can give some impacts on inventory performance [25] and also can improve planning quality in the firm [26].
D. Pure Judgment
A pure judgmental forecasting procedure is a method to decide the forecasting result using intuition, information, and experience of the forecaster. There is no overt manipulation of data in this procedure.
For the qualitative method (pure judgment), the forecast results and forecast error are calculated without the initial stage. It means that forecasting results are computed for 28 periods. Furthermore, forecasting errors are calculated by using the same methods (MAE, MSE, and SDE) that are deployed for quantitative forecasting methods.
E. Combined method
In this research, a combined method to obtain the best performance of forecasting results is also investigated. For combination analysis, we combine both methods (SES and pure the value of the combination of the methods are obtained by averaging 50%-50% weight the forecasting results resulting from each method being applied. This method has been applied in [2] that conducted
the analysis
benefit of combining forecasting methods also reported by Baecke et al. [28] and Feng et al. [29].
The next step is the analysis of the performance of forecasting results produced by these methods (quantitative, qualitative, and combined method). The analysis is conducted by comparing the value of forecasting error resulted from deploying these methods. The forecasting method that has the smallest forecasting error will perform better compare with other methods. Moreover, the analysis is also done to get an understanding regarding the contribution of human judgment in deciding its implication on stock out and overstock situation that happens in the case study organization.
III. RESULTS AND DISCUSSION
This section discussed the analysis results of the demand characteristics of the products, implementation of SES method, pure judgment method, and combined method. The forecasting error for each method is also analyzed in this session. The performance of forecasting methods is analyzed by comparing forecasting errors by deploying forecasting error methods such as Mean Absolute Error (MAE), Mean Square Error (MSE), and Standard Deviation error (SDE). In addition, the analysis regarding overstock and stock out that occur in every period for every method are also discussed. Overstock and stock out are the impacts of forecasting errors on the inventory system.
A. Demand Pattern of the Time Series Data
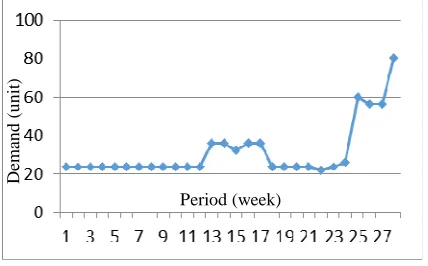
The demand pattern of the historical data in every period is defined to decide the appropriate forecasting methods to be used. There are many procedures to define the patterns of demand. In this research, we plotted the data as Fig.1.
Fig.1 Demand pattern of the product
Fig. 1 is an example of the demand pattern of soap products. From Fig. 1, it is found that there is demand in every period. It means that the product has a pattern of demand as fast-moving demand. Mostly, the products under concern in this research have this type of demand pattern characteristics. Moreover, the figure shows that most of demands are constant over the period, and there is an increasing demand at the end of the time horizon. The forecasting methods appropriate for the demand that those characteristics are forecasting method based on averaging. Based on this explanation, the initial analysis to define the proper quantitative forecasting method is conducting by
applying four forecasting methods based on averaging methods.
B. Forecasting results and forecasting error
1) Forecasting results for the quantitative forecasting method: By applying quantitative forecasting methods on the
initial stage of forecasting tasks for 14 periods, it is found that Single Exponential Smoothing (SES) method has the smallest forecasting error compared with other methods. Table 1 shows the forecasting error resulted from using forecasting error methods for every quantitative forecasting method.
TABLE I
FORECASTING ERROR RESULTED FROM QUALITATIVE FORECASTING METHODS
Methods MAE MSE SDE
Average 1.77 20.38 4.70
SMA 1.82 18.90 4.56
SES 1.57 17.43 4.33
Since SES is the method that resulting in the best forecasting performance, the forecasting task for this method is conducted for the rest of the periods (28 periods). Table 2 shows the results of forecasting for 28 periods of SES method.
TABLEII
THE RESULTS OF FORECASTING OF SESMETHOD
Time period Actual data Forecasting result
Forecasting error
1 8 8 0
2 6 8 2
3 7 8 1
4 7 8 1
5 5 8 3
6 6 8 2
7 5 8 3
8 5 8 3
9 5 7 2
10 5 7 2
11 7 7 0
12 6 7 1
13 7 7 0
14 5 7 2
15 4 7 3
16 6 7 1
17 8 7 1
18 5 7 2
19 6 7 1
20 7 7 0
21 7 7 0
22 5 7 2
23 5 7 2
24 6 7 1
25 6 7 1
26 5 7 2
27 6 6 0
28 6 6 0
Besides has the smallest forecasting error, the SES method has the characteristic to decrease the weight of the
Period (week)
D
em
an
d
(
u
n
it
older actual data and updates the forecast result estimates in every period whether or not demand occurs during this period [1]. This method assumed that demand for a particular period would be similar or close to the quantity of the demand for the next period. This procedure is in line with the way on how the decision-maker of the case organization determined the ordering size in every period (by considering the demand of the last period to forecast the demand for the next period).
2) Forecasting results for the qualitative forecasting method: Moreover, for the analysis of the qualitative
forecasting method, the Pure Judgment method is conducted for the whole demand data (28 periods). There is no initial stage for applying this method. Table 3 and Table 4 show the forecasting results and forecasting error for the pure judgment method. Based on a survey conducted on his research, there are several reasons why the manager in this case study organization makes adjustments (increasing/decreasing) on judgmental forecasting. They tend to make an adjustment based on the demand size of the last period and consider their inventory position. Based on their experiences, they also stated that in the first and fourth week in every month, the demand size tends to increase. On the other hand, on the second and third week in every month, the demand size tends to decrease. In addition, a discount on the price of some products also an aspect to be considered when a manager adjusts forecasting.
TABLEIII
FORECASTING RESULTS FOR PURE JUDGMENT METHOD
Time period Actual data Forecasting result
Forecasting error
1 8
2 6 12 -6
3 7 6 1
4 7 6 1
5 5 9 -4
6 6 6 0
7 5 6 -1
8 5 6 -1
9 5 6 -1
10 5 6 -1
11 7 6 1
12 6 9 -3
13 7 6 1
14 5 6 -1
15 4 6 -2
16 6 6 0
17 8 6 2
18 5 6 -1
19 6 6 0
20 7 6 1
21 7 6 1
22 5 6 -1
23 5 6 -1
24 6 6 0
25 6 6 0
26 5 6 -1
27 6 6 0
28 6 6 0
TABLE IV
FORECASTING ERROR FOR PURE JUDGMENT METHOD
Qualitative
MAE MSE SDE
1.19 3.11 1.80
3) Forecasting results for combined forecasting method:
Combined forecasting method is applied to evaluate the effect of the human judgment on the forecasting results’ performance. Table 5 and Table 6 show the forecasting results and forecasting error for the combine forecasting method. It is found that the effect of human judgment on the performance of the forecasting result is not significant. The forecasting errors resulted from applying the combined method are not significantly decreasing. There are some reasons why the impact of human judgment on statistical forecasting is not significant, such as the method that is used to combine both forecasting methods (quantitative and qualitative forecasting methods). In this research, 50%-50% weight of each procedure is applied and it is determined in an arbitrary way. The better procedure for weighting each method should be evaluated. Moreover, it is indicated that and the procedure to adjust judgmental forecasting should be analyzed and the forecasters should have the relevant reason or justification in making adjustments in the forecasting.
TABLEV
FORECASTING RESULTS FOR COMBINED METHOD
Time period
Actual data
SES Pure
Judgment
Forecasting error
1 8 8
2 6 8 12 -4
3 7 8 6 0
4 7 8 6 0
5 5 8 9 -4
6 6 8 6 -1
7 5 8 6 -2
8 5 8 6 -2
9 5 7 6 -2
10 5 7 6 -2
11 7 7 6 0
12 6 7 9 -2
13 7 7 6 0
14 5 7 6 -2
15 4 7 6 -3
16 6 7 6 -1
17 8 7 6 1
18 5 7 6 -2
19 6 7 6 -1
20 7 7 6 0
21 7 7 6 0
22 5 7 6 -2
23 5 7 6 -2
24 6 7 6 -1
25 6 7 6 -1
26 5 7 6 -2
27 6 6 6 0
TABLEVI
FORECASTING ERROR FOR COMBINED METHOD
Qualitative
MAE MSE SDE
1.38 3,22 1,83
From the analysis results, it is found that the SES method still becomes a superior method compared with the pure judgment method and combined method. Moreover, the forecasting error method that has the smallest error is Mean Absolute Error (MAE) compared with other methods.
C. Stock-Out and Over Stock
The results of forecasting will translate to parameters that are used to determine inventory decisions. The better the performance of forecasting, the better the performance of the inventory system will result. The impact of decision making on the inventory system is overstock and stock out on the system. Overstock will have happened if the quantity of replenishment order from the supplier is higher than demand, whereas stock out occurs when demand is higher than replenishment order quantity in one period. Both situations give some impacts to the organization, for example in increasing inventory cost when overstock occurs and increasing opportunity cost if stock out has happened. In this research, based on the frequency of overstock and stock out for every method (SES, pure judgment, and combination of both methods), it is found that overstock seems to happen more frequent compare to stock out. It indicates that the decision-maker tends to have more inventory to avoid opportunity costs. Table 7 shows that the combined method has the smallest percentage of stock out. However, this method has the highest value of overstock compare to another method. It indicates that combining the qualitative method (SES method) and the quantitative method (pure judgment) in forecasting tasks still produce a high number of forecasting errors. The right way of the procedure of combining the methods is needed to evaluate. Moreover, to produce a good performance of the inventory system, choosing an appropriate forecasting method is not enough. It must be continued by applying the right to inventory model. It means that when an appropriate forecasting method is applied (minimizing forecasting error), a suitable stock control method is still needed to reduce the costs.
TABLEVII
THE PERCENTAGE OF FREQUENCY OF OVERSTOCK AND STOCK OUT
Item
Quantitative (SES)
Qualitative
(pure judgment) Combined
SO OS SO OS SO OS
Type 1 0.14 40.96 0 39.41 0 40.52
Type 2 2.45 38.73 0 46.05 0 43.64
Type 3 0.94 16.78 1.51 13.03 0.11 15.73
Total 3.53 96.47 1.51 98.49 0.11 99.89
IV.CONCLUSION
This research is a study in the area of Operations Management focusing on business forecasting and inventory management. The fact that human judgment tends to exist
when managers make inventory decisions (how much and when to order the SKUs to the supplier) is discussed in this research. The advantage of doing this study is to get more understanding regarding the performance of an inventory system as the impact of forecasting results when human judgment is incorporated. The case study organization in this study deals with a tremendous number of SKUs and applies a pure human judgment method for forecasting tasks. An appropriate procedure for demand forecasting is needed to avoid the forecasting error. Three forecasting method is used in this research – qualitative, quantitative and the combination of quantitative and qualitative method. In order to decide an appropriate quantitative forecasting method, the demand characteristics need to define. Based on the time-series demand data of the case study organization, it is found that the type of demand data is fast-moving demand. It means that there is demand in every period. The appropriate forecasting methods for this type of demand pattern data are the Average method and Single Exponential Smoothing method.
Furthermore, the forecasting error method that is used in this research is Mean Absolute Error (MAE), Mean Square Error (MSE), and Standard Deviation error (SDE). Analysis results indicate that the SES method resulted in the lowest forecasting error compares with other quantitative forecasting methods. It also happens when forecasting results produced by deploying the SES method compares with judgmental forecasting and the combination of SES method and judgmental forecasting using 50%-50% weight for each method. In addition, the findings of the research show that the quantitative forecasting method (in this study, SES method has the best performance of forecasting) has a clear procedure to do the forecasting tasks and suitable for the products that have time-series data. Furthermore, qualitative forecasting method such as human judgment is needed for a particular situation (for example for the new products, promotion event, etc.) and when managers have some contextual information regarding the products under concern.
Regarding the impact of forecasting performance on the inventory system, overstock and stock out still happen when human judgment is incorporated on the results of a quantitative forecasting method. It indicated that the evaluation of the procedure of adjusting quantitative forecasting results is needed. Furthermore, when an appropriate forecasting method is applied, a suitable stock control method is still needed to minimize the costs.
NOMENCLATURE
F forecasting result unit
Y actual data unit
k number of actual data
y demand unit
e exponential
Greek letters
α smoothing constant value 0,1
Subscripts
ACKNOWLEDGMENT
This research was funded by Research and Community Services of Universitas Bung Hatta, Padang. The authors would like to express our gratitude to the Rector and the Head of Research and Community Services of Universitas Bung Hatta for providing a grant to conduct the research.
REFERENCES
[1] Makridakis, S., Wheelwright, S. C., and Hyndman, R. J. (1998). Forecasting Methods and Applications, 3rd Edition, John Wiley & Sons Inc, New Jersey.
[2] Kholidasari, I. (2013) The Implications of Judgemental Interventions in an Inventory System, Unpublished Ph.D. Thesis. University of Salford, Manchester, UK, 2013
[3] Eaves, A. H. C. (2002). Forecasting, Ordering, and Stock-Holding for Erratics Demand, Paper presented at the 21st International Symposium of Forecasting; 23-26 June 2002; Pine Mountain. [4] Silver, E. A., Pyke, D. F., and Peterson, R. (1998). Inventory
management and production planning and scheduling, 3rd Edition, John Wiley & Sons, Inc., New York.
[5] Syntetos, A. A., and Boylan, J. E. (2001). On the bias of intermittent demand estimates. International Journal of Production Economics, 71, 457-466.
[6] Syntetos, A. A., and Boylan, J. E. (2005). The accuracy of intermittent demand estimates. International Journal of Forecasting, 21, 303-314.
[7] Syntetos, A. A., and Boylan, J. E. (2006). On the stock control performance of intermittent demand estimators. International Journal of Production Economics, 103, 36-37.
[8] Willemain, T. R., Smart, C. N., and Schwarz, H. F. (2004). A new approach to forecasting intermittent demand for service parts inventories. International Journal of Forecasting, 20, 375-387. [9] Makridakis, S. G., & Wheelwright, S. C. (1989). Forecasting
methods for management, 5th Edition, John Wiley & Sons.
[10] Mic., C. E. (2019). New Product Demand Forecasting. Research Paper Busines Analytic. Vrije Universiteit Amsterdam.
[11] Clement, R. (1989). Combining forecasts: a review and annotated bibliography. International Journal of Forecasting, 5, 559-583. [12] Goodwin, P. (2000a). Correct or combine? Mechanically integrating
judgemental forecasts with statistical methods. International Journal of Forecasting, 16, 261–275.
[13] Goodwin, P. (2000b). Improving the voluntary integration of statistical forecasts and judgment. International Journal of Forecasting, 16, 85-99.
[14] Weiss, C.E., Raviv, E., and Roetzer, G. (2018) Forecast Combinations in R using the ForecastComb Package. The R Journal. ISSN 2073-4859, 10, 262-281.
[15] Chindia, E. W. (2016). Forecasting Techniques and Accuracy of Performance Forecasting. International Journal of Management Excellence, 7, 813-820.
[16] Qiu, D., and Wang, W. (2014). A Combining Forecasting Modeling and Its Application. 15th International Conference on Informatics and Semiotics in Organisations (ICISO), May 2014, Shanghai, China, 246-252.
[17] Jiang, B., Tian, L., Xu, Y., and Zhang, F. (2016). To Share or Not to Share: Demand Forecast Sharing in a Distribution Channel. Marketing Science, 35, 800-809.
[18] Nikolopoulos, K., Syntetos, A. A., Boylan, J. E., Petropoulos, F., and Assimakopoulos, V. (2011). An aggregate-disaggregate intermittent demand approach (ADIDA) to forecasting: an empirical proposition and analysis. Journal of Operational Reseach Society, 62, 544-554. [19] Syntetos, A. A., Nikolopoulos, K., Boylan, J. E., Fildes, R., and
Goodwin, P. (2009). The effects of integrating management judgment into the intermittent demand forecast. International Journal of Production Economics, 118, 72-81.
[20] Syntetos, A. A., Babai, M. Z., Davies, J., and Stephenson, D. (2010). Forecasting and stock control: a study in a wholesaling context. International Journal of Production Economics, 127, 103-111. [21] Syntetos, A. A., Nikolopoulos, K., and Boylan, J. E. (2010). Judging
the judges through accuracy-implication metrics: The case of inventory forecasting. International Journal of Forecasting, 26, 134-143.
[22] Teunter, R. H., Syntetos, A. A., and Babai, M. Z. (2011). Intermittent demand: Linking forecasting into inventory obsolescence. European Journal of Operational Research, 214, 606-615.
[23] Fildes, R., Ma, S., and Kolassa, S. (2019). Retail Forecasting: research and practice. Management Science Working Paper 2018:04. Management School, Lancaster University.
[24] Mekel, C., Anantadjaya, S. PD., and Lahindah, L. (2014). Stock-Out Analysis: An Empirical Study on Forecasting, Re-Order Point and Safety Stock Level at PT. Combiphar, Indonesia. Review of Integrative Business & Economics Research, 3, 52-64.
[25] Wang, X., & Petropoulos, F. (2016). To select or to combine? The inventory performance of the model and expert forecasts. International Journal of Production Research, 54 (17), 5271-5282. [26] Jordan, S., & Messner, M. (2019). The Use of Forecast Accuracy
Indicators to Improve Planning Quality: Insights from a Case Study. European Accounting Review, 1-23.
[27] Petropoulos, F., Kourentzes, N., Nikolopoulos, K., and Siemsen, E. (2018). Judgmental Selection of Forecasting Models. Journal of Operations Management, 60,34-46
[28] Baecke, P., De Baets, S., and Vanderheyden, K. (2017). Investigating the added of integrating human judgment into a statistical demand forecasting system. International Journal of Production Economics, 19, 85-96.