Effect of shallow subsurface flow pathway networks on corn yield spatial variation
under different weather and nutrient management
Billie J. Morgan1, Craig S.T. Daughtry2, Andrew L. Russ2, Waine P. Dulaney2, Timothy J. Gish2, and Yakov A. Pachepsky1*
1USDA-ARS Environmental Microbial and Food Safety Laboratory, Beltsville, MD, USA 2USDA-ARS Hydrology and Remote Sensing Laboratory, Beltsville, MD, USA
Received December 9, 2018; accepted April 23, 2019
*Corresponding author e-mail: [email protected] © 2019 Institute of Agrophysics, Polish Academy of Sciences A b s t r a c t. Ground water availability can be a major spatially
variable factor of crop yields. In soils with the infiltration-restrict -ing layer, ground water can be organized in the network of channels that conduct water laterally in wet periods and become water storage and water subsidy sources for plants in dry peri-ods. The objective of this work was to quantify the relationships
between the distances to the subsurface flow pathway network
and corn yield for different weather conditions and nutrient management. Corn yield was monitored across the manured and
chemically fertilized fields at the USDA-ARS OPE3 experimen -tal site in Maryland. Data were collected during dry, normal, and above normal years in terms of the amount of precipitation from
planting to physiological maturity. The subsurface flow pathway
network was delineated using ArcGIS from data on topography of
the infiltration-restricting layer found mostly at depths between
one and three meters. The geographically weighted regression
was used. Adjusted determination coefficients of regressions
ranged from 0.485 to 0.655. Decrease of the adjusted
determi-nation coefficients from a dry to normal year and an increase
from the normal to wet year was found. Factoring the subsurface
flow pathway network influence into crop management can be an
important component of precision farming strategies.
K e y w o r d s: subsurface flow pathways, ground penetrating
radar, geographic weighted regression, corn yield
INTRODUCTION
Variability of crop yield within fields receiving the same management has long been a target of precision agriculture. Availability of water, radiation, and nutrients,
as well as pressure from weeds and diseases may signifi -cantly vary across crop fields, a variation in yields follows. Understanding spatial patterns of crop variability factors appears to be necessary to use resources efficiently and to improve the resilience of the farm enterprise Ground water availability can be a major spatially variable factor of crop yields. It was shown for corn that ground water depth less than one meter negatively affects yields, whereas higher yields have been recorded at intermediate (1-3 m) water table depths (Kahlown et al., 2005; Zipper et al., 2015). The portion of total seasonal evapotranspiration supplied from shallow ground water was strongly affected by water-table depth in the work of Kalita et al. (1993).
The spatial organization of shallow ground water depth
is difficult to observe. Yoder et al. (2001) and Gish et al. (2002) applied ground penetration radar (GPR) and
elec-tromagnetic induction surveys at fields with loess and fluvial soils. They concluded that there exists a network of subsurface flow pathways, providing the major lateral flow of subsurface water, that are perched on a layer that restricts vertical flow. Their conceptual model was similar to the model developed in the research of lateral flow at the
downslope over the bedrock surface (Hardie et al., 2001). The spills caused the water movement through a subsur-face network of narrow flow paths for the “channelized” saturated flow. As soil water contents increased, more con -nections between subsurface ponded areas became active. Location of the dynamic subsurface ponds was proposed to be obtained from the topography of the restricting layer, which in turn was inferred from spatially dense ground pen-etration radar data (Gish et al., 2002, Zhu and Lin, 2009).
Weather and nutrient management could alter the effect of the subsurface flow pathway network (SFPN) on spa-tial variation in crop development and yield. In dry years, there should be more time periods when plants above the flow pathway can receive ground water subsidy, whereas plants that are further from the pathways would be in less favorable conditions. This was demonstrated in the study of Walthall et al. (2004), who determined the normalized difference vegetation index (NDVI) for corn fields, where subsurface preferential flow pathways were delineated, had higher NDVI values in the proximity of the pathways themselves. The efficiency of nutrients can depend on the nutrients mobility and soil water contents, which should be different at different distances from the subsurface flow pathway network. Currently, information on the effect of subsurface flow on yields remains scarce.
The objective of this work was to estimate and com-pare effects of subsurface preferential lateral flow pathways on spatial variation in corn yields, with different nutrient management, in years of different water availability. The weighted geographical regression was applied to quantify the effect of the distance to subsurface pathways on the yields.
MATERIALS AND METHODS
The study site is located at the USDA-ARS Henry A. Wallace Beltsville Agricultural Research Center, MD (near 39°01’ 44”N, 76°50’ 46”W). The 21 ha site is part of the Optimizing Production inputs for Economic and Environmental Enhancement (OPE3) study and contains four fields that range in size from 3.6 to 4.2 ha. Each field delimited by earthen berms and drains into a first-order stream and riparian wetland. The soils are variable, but the majority are coarse-loamy, siliceous, mesic typic hap-ludults. Surface soil textures range from sandy loams to loamy sands. Surface slopes vary between 1 and 4%. Depth of the first continuous clay lens, identified using ground-penetrating radar (GPR), ranged from 1 to 3 m (Gish et al., 2002, 2005).
Corn (Zea mays L.) was planted on 17 April 2002, 18 May 2004, and 29 April 2006. It was fertilized using split applications of N, as recommended by the University of Maryland. Field A also received uniform applications of bovine manure that was applied to the soil surface and incorporated prior to planting. To account for N loss, due to ammonia volatilization, additional N fertilizer was applied
(~ 50 kg N ha-1) as needed at 4-5 weeks after planting, based on the pre-side dress nitrate test. Field B received 34 kg N ha-1 at planting, plus an additional uniform appli-cation of N fertilizer with the rate based on the mean PSNT value. Corn grain yields were acquired with a har-vester equipped with a yield monitor and a differential GPS. Measurement errors resulting from the harvester detouring around obstacles in the fields (e.g., soil moisture sensors, sampling wells, and the weather station tower) were removed from the yield data. The weather station, located in Field B, recorded solar radiation, air temperature, wind speed, and precipitation.
The SFPN were obtained using the ‘stream delinea-tion’ tool, from the ArcMap hydrology tool set (Jenson and Domingue, 1988). The input for this tool was the raster of the digital elevation model (DEM) of the restrictive layer, which was obtained by subtracting krigged depth to the restrictive layer from the elevations of the land surface. The depths and elevations were obtained from ground penetration radar and kinematic GPS surveys, respectively (Gish et al., 2005). This DEM of the restrictive layer was used in the ‘flow direction’ tool, in ArcMap, which gener -ated a raster showing the direction of flow out of each cell. Next, the ‘flow accumulation tool’ was used which repre -sented the accumulated flow as the accumulated number of all cells flowing into each downslope cell. Different flow accumulation thresholds (FATs) can be applied to select only those subsurface flow pathway networks that have a number of inflowing cells greater than the threshold. Each delineated subsurface pathway was then converted to a fea-ture using the ‘stream to feafea-ture’ tool.
Geographically weighted regression (GWR) is a spatial regression technique increasingly used in spatial dataset analysis. GWR provides a local linear regression model, that accounts for the distance between locations where independent and dependent variables are measured. These distances are used to create geographical weights for the values of the independent variable (Fotherinham et al., 2003). Weights decrease as the distances increase. The func-tion that relates weights to distances is called kernel. Two types of kernels – fixed and adaptive – are implemented in ArcGIS. We used a fixed kernel, which was preferable, since our data points were regularly distributed rather than clustered, as Moran’s I statistics showed (Charlton and Fotherinham, 2009). The size of the area, where data for GWR are collected, is controlled by the single parameter of the function kernel. This parameter, called bandwidth, is found automatically, to provide the minimum of the value of the corrected Akaike information criterion (AICc), which in turn characterizes the accuracy of the GWR estimates. The adjusted determination coefficient, R2, was utilized to
assess the performance of the GWR.
variable. The ‘near’ tool, in ArcMap, was used on each field yield data, for each year, for various FATs. The tool created values of the distances, which were used in GWR.
RESULTS
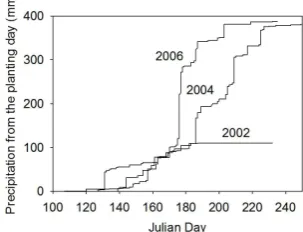
Cumulative precipitation was calculated for each year, for the period from planting to physiological maturity of the crop (Fig. 1). The highest cumulative precipitation (387 mm) was recorded in 2006 and the least precipitation (110 mm) in 2002. Precipitation in 2004 was (377 mm) near the 10- year average. The growing period in 2004 was much longer than in 2006, and the average amount of pre-cipitation per day of the growing season was substantially larger in 2006 compared with 2004. Cumulative probability distributions, for each year and field, are shown in Fig. 2. Both weather and crop management were significant fac -tors. Average yields were 4795, 7720, and 8724 kg ha-1 at the field A and 3998, 7469, and 7983 kg ha-1 at the field B in 2002, 2004, and 2006, respectively. The 2004 weather conditions caused the shape of the yield distributions to be qualitatively different from other years. In this year, a rela-tively large proportion of field area had very low yields. No yield was recorded at about 5% of field area.
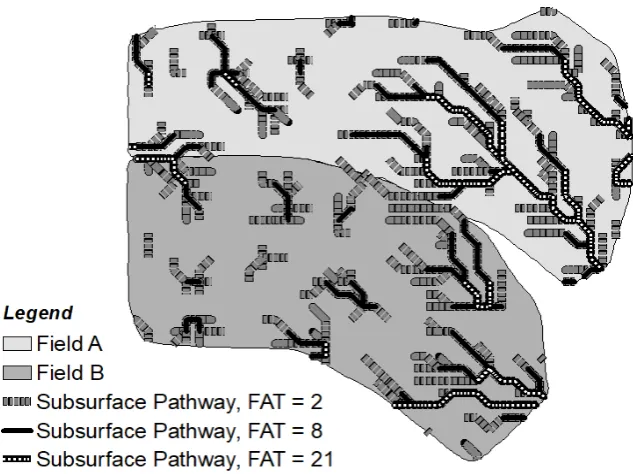
Subsurface flow pathway networks formed branching structures. An example of such structures are shown in Fig. 3. As the FAT increases, the branches become
short-er. The pathways tended to be denser in lower parts of the fields. Densities of the flow pathways were computed as ratios of total length per unit area of the fields; units were m-1. The densities depended on the flow accumulation
threshold. The dependencies followed the inverse power law (Fig. 4). The flow pathways density decreased with the increase of FAT values. The decrease was slightly faster at field B compared with field A. By and large, both fields had similar densities for the same values of the FAT (Fig. 4). As the FAT increases, inspection of the dependencies, shown in Fig. 4, suggested that FAT values 2, 8, and 21 would provide a clear representation of the differences in SFPN density.
Adjusted determination coefficients of GWR, relating yields to the distances from the subsurface flow pathway networks, are collected in Table 1. Increase in the FAT caused the decrease in determination coefficients. At low FATs the determination coefficients were relatively high – from 0.48 to 0.65 – and demonstrated the substantial influ -ence of the pres-ence of subsurface flow pathway networks on the yields. The increase in FAT values led to lower deter-mination coefficients (Table 1).
The strength of relationships, between yields and distances to the SFPN, reflected the wetness of the year (Table 1). For the manured field A, the largest R2 were
obtained in dry 2002, (except FAT 21). For the standard fertilizer application field B, the largest R2 were found in
2006. For both fields the smallest determination coefficients were found in the normal year, 2004.
For given weather conditions, the strength of the ‘yield – SFPN density relationship’ reflected the nutrient man -agement practice (Table 1). In dry 2002, determination coefficients decreased in the sequence ‘manure – standard,’ The opposite was observed in normal and wet years 2004 and 2006, when the determination coefficients decreased in the sequence ‘standard application – manure.’
Fig. 1. Cumulative precipitation during corn crop vegetation period in 2002, 2004 and 2006.
Fig. 2. Cumulative probability distributions of yield values for the observation year across: a – field A, b – field B.
Yield (kg ha-1)
DISCUSSION
The GWR determination coefficients were highly signi-ficant at all years and fields. This supports the idea of a clo-se relation between the distance to the SFPN and yield. The effect of the weather on the strength of the ‘yield-SFPN’ relationship depended on the nutrient management. At the manured field A, coefficients were higher in drought year 2002 and became progressively smaller as years grew wetter. This trend supports the assumption of the water in SFPN segments as a source of water subsidy, i.e. avail-ability of additional water for transpiration from shallow ground water (Lowry and Loheide, 2010). At fields with the standard fertilizer application, the determination coef-ficients increased from the drought year, 2002, to the wet year, 2006. A hypothetic explanation for that, is improved
Table 1. Adjusted determination coefficients of geographically weighted regressions ‘distance to subsurface flow pathway network
vs. corn yield’
Field Year Growing season FAT
2 8 21
A 2002 Dry 0.642 0.655 0.557
A 2004 Normal 0.505 0.482 0.348
A 2006 Wet 0.556 0.558 0.501
B 2002 Dry 0.576 0.580 0.427
B 2004 Normal 0.526 0.538 0.398
B 2006 Wet 0.584 0.592 0.477
Fig. 3. Effect of the flow accumulation threshold (FAT) on the delineation of the subsurface flow pathway networks (SFPNs).
Fig. 4. Dependence of the density of subsurface flow pathway net
-works (SFPN) on the flow accumulation threshold (FAT).
Flow accumulation threshold
Subsurface pathway density (m m
mobility and delivery of chemical fertilizers in the vici- nity of SFPN, where the chemical transport can occur both in saturated and unsaturated conditions of capillary fringe. Substantial lateral transport of solutes in soils was demon-strated (Logsdon, 2007 for review and example). Kung et al. (2000) and Gish et al. (2004) observed chemical tran-sit time decreases as soil water content increases. Kung and Donohue (1991) reported that solution volumes and chemical concentrations were more than 400% larger in the subsurface depression areas identified with GPR.
There may be several reasons why the GWR R2 are only moderately high. First, the procedure of localization of SFPN does not provide the information about the water storage in specific pathway segments. Therefore, the clos -est segment is not necessarily the most important source of water subsidy. Second, there are unavoidable errors in the pathways location that are related to the noise in GPR data. Zhang et al. (2014) demonstrated that this noise increases as the water contents increase, i.e. one has relatively higher noise closer to the pathway segment. Third, it is probably not accurate to assume that water from a SFPN is constantly available based on the plants demand during the whole veg-etation period. Data in Fig. 1 show that precipitation events bring large amounts of water, but occur relatively rarely during the growing season. Therefore, periods should occur when soil water is available all over the field and when even the deepest pathways do not contain water because of a long drought. Influence of SFPNs on crop yields will depend on the duration of these periods and the growth stage of plants during these periods. Finally, the method, used in this and Gish et al. (2005) papers, relies on the FAT parameter. This parameter determines how many grid cells must drain into a cell for it to be designate as part of an SFPN location. This parameter does not quantitatively define what the actual volume of water is in a specific cell (or in neighbor -ing cells). Therefor the distance to SFPN, per se, may not be the only useful predictor of yields.
As soon as the DEM, of the restrictive layer, is deter-mined from GPR data with spatial analysis tools, methods other than GWR can be applied to research the relationship between crop yields and SFPNs. These various statistics will characterize this relationship. Gish et al. (2005) utilized 0 to 5, 5 to 10, and 10 to 15 m buffers around the subsur-face pathways, to determine the strength of the influence of the pathways on corn yield. They used the same GPR dataset and ArcGIS tools as we did in this work, applied block kriging to 1998, 1999, and 2000 yield data, at two scales, and estimated yields, within the buffer bands that covered 85% of the field. The ‘yield-SFPN’ relationship, based on the listed buffers, was demonstrated to be strongly dependent on the distance to the SFPN itself at 85% of the field area. Yet another analysis type suggested by Gish et al. (2005) consisted in relating the depth to the restrictive layer to yields. These authors found a well-defined para -bolic relationship between yields and depths for two dry
years (1998 and 1997). Other data analysis approaches may rely on the ground water flow within the network, which is not defined solely by the two-dimensional representation of the network via the number of cells draining to each other. The quantitative information about flow transport in SFPN provides more information about ground water subsidies across the field.
It is difficult to define exactly the resolution of the SFPN that provides better predictions (Table 1). Networks built from cell draining a large number of other cells (FAT = 21), do not contain enough information to estab-lish a relationship between yields and distance to pathways. The SFPN segments are simply too rare to affect large num-ber of cells. The decrease of the FAT and the corresponding increase in the density of subsurface pathway networks cre-ates better coverage of the fields (Figs 3, 4) and therefore provides more information to analyze the ‘yield-SFPN’ relationship. However, the increase of the network density can potentially include network segments with low water storage and therefore lead to some questionable conclu-sions about the ‘yield-SFPN’ relationship.
We realize that comparison of the nutrient management effect on ‘yield-SFPN’ relationship is not accurate, since the subsurface flow pathway networks can be different across fields A and B. We estimated several metrics of the networks. Dependencies of pathway length, per unit area, on the cumulative flow threshold were similar for the two fields (Fig. 4).
The effect of close subsurface pathways on yield is probably not limited to the water subsidy.
Since plants close to SFPN segments experience bet -ter development year af-ter year, soil structure and root residues should eventually become more favorable for both plant development and yield. This aspect of the pathways presence may constitute an interesting avenue of research. Modeling study of Soylu et al. (2014) indicated that the impact of ground water on surface energy and water bal-ances could be more important than previously recognized. These authors demonstrated that corn plant phenology, emergence, and root development can be substantially altered by shallow ground water.
Shallow ground water or perched water above the re- strictive layer may strongly affect the spatial distribution of crop yields. When such ground water fills a network of channels, the information, from such channels, can be a useful component of the knowledge about the crop yield variability sources.
CONCLUSIONS
2. Subsurface flow pathways were delineated from this DEM using the ArcGIS hydrologic algorithms.
3. Application of the geographically weighted regres- sion revealed relatively strong (0.505 ≤ R2 ≤ 0.642) rela -tionships between corn yield and distances to subsurface flow pathways.
4. Compared with the normal precipitation year, the relationships were stronger in the wet year, when the sub-surface pathways could prevent overwetting, and in the dry year when the pathways could serve as a temporary water storage and.
Conflict of interest: The Authors do not declare con-flict of interest.
REFERENCES
Charlton M. and Fotheringham A.S., 2009. Geographically Weighted Regression. A Tutorial on using GWR in ArcGIS 9.3. National Centre for Geocomputation, National University of Ireland. Maynooth, Ireland. Available at: https://www.arcgis.com/home/item.html?id=9ae34ee00c61 4d10ab086bcb1cce9482
Fotheringham A.S., Brunsdon C., and Charlton M., 2003.
Geographically weighted regression: the analysis of spa-tially varying relationships. John Wiley and Sons.
https://doi.org/10.1111/j.1538-4632.2003.tb01114.x
Gish T.J., Dulaney W.P., Kung K.J., Daughtry C.S.T., Doolittle J. A., and Miller P.T., 2002. Evaluating use of
ground-penetrating radar for identifying subsurface flow pathways.
Soil Sci. Soc. Am. J., 66(5), 1620-1629. https://doi.org/10.2136/sssaj2002.1620
Gish T.J., Daughtry C.S.T., Walthall C.L., and Kung K.J.S., 2004. Quantifying impact of hydrology on corn grain yield using ground-penetrating radar. Paper presented at the Proc. 10th Int. Conf. Ground Penetrating Radar, GPR 2004, 2 493-496.
Gish T.J., Walthall C.L., Daughtry C.S.T., and Kung K.S., 2005. Landscape and watershed processes: Using soil
mois-ture and spatial yield patterns to identify subsurface flow
pathways. J. Environ. Quality, 34(1), 274-286.
Hardie M.A., Doyle R.B., Cotching W.E., and Lisson S., 2012.
Subsurface lateral flow in texture- contrast duplex soils and
catchments with shallow bedrock. Appl. Environ. Soil Sci., 2012, Article ID 861358, 10 pages
https://doi.org/10.1155/2012/861358
Jenson S.K. and Domingue J.O., 1988. Extracting topographic
structure from digital elevation data for geographic infor-mation system analysis. Photogrammetric Engineering and Remote Sensing, 54(11), 1593-1600.
Kahlown M.A. and Ashraf M., 2005. Effect of shallow ground-water table on crop ground-water requirements and crop yields. Agric. Water Manag., 76(1), 24-35.
https://doi.org/10.1016/j.agwat.2005.01.005
Kalita P.K. and Kanwar R.S., 1993. Effect of water-table man-agement practices on the transport of nitrate-N to shallow groundwater. Trans. ASAE, 36(2), 413-422.
https://doi.org/10.13031/2013.28353
Kung K-J.S., Steenhuis T.S., Gish T., Kladivko E., Bubenzer G., and Helling C.S., 2000. Impact of preferential flow on
the transport of adsorptive and non-adsorptive tracers. Soil Sci. Soc. Am. J., 64, 1290-1296.
Kung K.J. and Donohue S.V., 1991. Improved solute-sampling protocol in a sandy vadose zone using ground-penetrating radar. Soil Sci. Soc. America J., 55(6), 1543-1545.
Logsdon S.D., 2007. Subsurface lateral transport in glacial till soils. Trans. ASABE, 50(3), 875-883.
https://doi.org/10.13031/2013.23152
Lowry C.S. and Loheide I.I.S.P., 2010. Groundwater-dependent vegetation: quantifying the groundwater subsidy. Water Resour. Res., 46, W06202.
https://doi.org/10.1029/2009wr008874
Soylu M.E., Kucharik C.J., and Loheide S.P., 2014. Influence
of groundwater on plant water use and productivity: devel-opment of an integrated ecosystem-variably saturated soil
water flow model. Agric. Forest Meteorol., 189, 198-210.
https://doi.org/10.1016/j.agrformet.2014.01.019
Tromp-van Meerveld H.J., and McDonnell J.J., 2006. Thres-
hold relations in subsurface stormflow: 2. The fill and spill
hypothesis. Water Resour. Res., 42, 2. https://doi.org/10.1029/2004wr003800
Walthall C.L., Gish T.J., Chinkuyu A., Dulaney W., Kaul M., and Daughtry C.S., 2004. Analysis of surrogate indicators
for evidence of subsurface preferential flow pathways: impact of subsurface preferential flow on variability of
NDVI. Proc. 2004 IEEE Int. Geoscience and Remote Sensing Symposium, IGARSS’04, 6, 3992-3995.
https://doi.org/10.1109/igarss.2004.1370003
Yoder R.E., Freeland R.S., Ammons J.T., and Leonard L.L., 2001. Mapping agricultural fields with GPR and EMI
to identify offsite movement of agrochemicals. J. Appl. Geophysics, 47(3), 251-259.
https://doi.org/10.1016/s0926-9851(01)00069-6
Zhang J., Lin H., and Doolittle J., 2014. Soil layering and
pref-erential flow impacts on seasonal changes of GPR signals in
two contrasting soils. Geoderma, 213, 560-569. https://doi.org/10.1016/j.geoderma.2013.08.035
Zhu Q., and Lin H.S., 2009. Simulation and validation of
con-centrated subsurface lateral flow paths in an agricultural
landscape. Hydrol. Earth System Sci., 13(8), 1503-1518. https://doi.org/10.5194/hess-13-1503-2009
Zipper S.C., Soylu M.E., Booth E.G., and Loheide S.P., 2015.
Untangling the effects of shallow groundwater and soil tex
-ture as drivers of subfield-scale yield variability. Water