Performance optimization assessment for a proper heat
pump technology functions at low temperature heat
source
Ali H. Tarrad
*Mechatronic Engineering Department, University of Southern Denmark, Sønderborg, Denmark. E-mail: [email protected]
This investigation represents a thermodynamic assessment of thermal performance optimization for a proper heat pump technology suitable for district hot water production at (60-65) °C. The clean energy sources integrated with environment friendly refrigerants were studied to optimize and validate the use of Cascade heat pump technology at various configurations. Three pure, R744, R600a and R134a, and one azeotropic mixture R410A refrigerants were circulated at different cycle arrangements. Two Cascade systems (Three Cycles), single Cascade system (Two Cycles), and compound Cascade system (Three Cycles) were proposed for the present assessment. The low temperature cycle operated at evaporator temperature of (-15 to -2) °C and the high temperature condenser was set at a temperature of (70) °C. The single Cascade heat pump circulating R410A/R134a and the two Cascade R410A/R717/R134a systems showed the best heating coefficient of performance (COP). The former refrigerant pair exhibited higher heating (COP) than that of the latter by (3.6-5) % calculated at (22.5) °C low temperature cycle intermediate temperature for the whole range of test conditions. The lowest (COP) was experienced by the two Cascade heat pump technology circulating R744/R717/R134a and R744/R717/R600a refrigerant pairs. The compound Cascade heat pump is definitely a promising option for low temperature heat source technology on the long term basis due to its low running cost for heating load generation. The heating (COP) showed a range of (2 to 2.7) at (70 %) compressor isentropic efficiency according to the system type, refrigerant pair and operating conditions considered in the present work. Any improvement for the compressor isentropic efficiency provides a valuable augmentation for the heating (COP) of the Cascade heat pump.
Keywords: Compound Cascade Heat Pump, Sustainable Heat Source, Green Environment, COP Optimization
INTRODUCTION
Natural energy resources are available for free and cheap to be utilized and over all that they are clean and have no CO2 emission. Europe has minimized the use of fossil fuel for energy production and implementing refrigerant alternatives which are considered as environment friendly. Denmark is considered as a world leading country in wind energy production and wind turbine production. In 2014 Denmark produced (57.4%) of its net electricity generation from renewable energy
sources which mainly was from wind energy (Energinet, 2014). The use of shallow geothermal energy in Denmark is limited compared to neighboring countries with a lack of know-how and experience with its use (Pedersen et al.,2012). The Danish Energy Agency concluded that at least half of all Danish district heating networks can be provided by implementing heat storage technologies integrated with large-scale heat pumps (Røgen et al., 2015).
It has been concluded that for two heat sources system, at standard operating conditions, source (0)°C and sink (45)°C, efficiency and heating capacity improvements of up to (35%) achieved when the second heat source was at approximately (20) °C (Bertsch et al., 2014). The COP of the Cascade refrigeration system increases when the mass flow rate of higher temperature circuit increases in their test range (Kasi, 2015). The thermal performance of cascade heat pump when using ejectors as a part of the unit arrangement utilizing R134a and R404a refrigerants was studied (Jang and Lee, 2015). The numerical analysis showed that applying ejectors to both the high stage and low-stage cycles exhibited a (26.9%) increase in the COP compared to standard cascade cycles. When the flow rate was doubled from (1) l/min to (2) l/min in a ground heat source system, the average heat transfer rate was augmented by about (21.7%) for standing ground heat exchanger (GHE) and (17.5%) for reclined (GHE) (Ali et al., 2016). Seasonal change of the surrounding ground temperature of GHE has a significant effect on the overall performance of GHE.
The performance of combined R744/R134a and CascadeR744/ R134a systems for space heating was investigated and compared under specific operating conditions (Song et al., 2016). They found that Cascade system performed better at low ambient temperatures and the combined system performed better under conditions of high ambient temperature and high hot water temperature differences between the system inlet and outlet. A thermodynamic analysis was implemented to investigate the optimal intermediate temperature by using R134a and R410A in high and low temperature cycles respectively (Kim et al., 2013). They concluded that the optimal intermediate temperature was determined by the HT condensing temperature, LT evaporating temperature, temperature difference and system efficiency of HT cycle and LT cycle. A Cascade system was developed to provide hot water in Alaska where sea water temperature around (10)°C was used (Baker and Schaefermeyer, 2013). They postulated that the heating (COP) could be ranged between (3.1) and (3.6) from their sea water heat pump. A ground source heat pump system performance with R407C/R134a was investigated (Yrjölä and Laaksonen, 2015). They pointed out that the optimum condensing temperature of the (LT) cycle lies in the range of (35–37) °C, when the evaporating temperature of R407C and condensing temperature of R134a are at (−5) °C and (65) °C respectively.
A compound Cascade system was developed where three cycles in three pressure and temperature levels were integrated with two low temperature heat sources (Tarrad, 2017a).In this study, R717/R134a system exhibited heating COP increase of about (3 %) higher
than that of R410A/R134a system for both of the tested cycle intermediate temperatures. In addition, the specific power consumed by compressors of the proposed system arrangement showed a decrease of up to (3 %) lower than that of the sea water single source Cascade system operating under the same conditions. The performance of different refrigerant pairs under a variety of operating conditions and cycle intermediate temperatures were studied (Tarrad, 2017b, c). R717/R600a and R717/R134a revealed the highest COP and lowest power consumption at (35) °C cycle intermediate temperature and HT condensation of (70) °C. The best performance can be achieved when the cycle intermediate temperature range was close to (33 to 37) °C. He has pointed out that different operating conditions for both systems at the high and low temperature cycles can attain the same thermal performance (Tarrad, 2017c).
The majority of the research work was focused on the addition of some modifications to the standard Cascade heat pump in order to enhance the thermal efficiency of the unit. Such modifications may be accomplished by adding ejectors on the refrigerant flow (Jang and Lee,2015) or two heat sources with different temperature levels (Uhlmann, et al., 2014; Bertsch, 2014; Tarrad, 2017a). The motivation for such researches was to improve the coefficient of performance of the heat pump, to minimize the power consumption and hence the running cost for heating load generation. In the present work, a comparison on the basis of the energy conveying capability with lower power consumption, best heating COP and minimum (ODP) and (GWP) of refrigerant pairs was considered. A two Cascade system (three cycles), a single (two cycles) and the compound Cascade arrangement (three cycles) developed by (Tarrad, 2017a) were investigate when circulating R744, R717, R600a, R134a and R410A in a variety of pairs and operating conditions. On the LT cycle, either R744 or R410A was circulated, R717 at intermediate cycle and either R134a or R600a was circulated at the HT cycle. Low temperature green heat sources such as sea water and ground were implemented with the clean refrigerant having zero Ozone depletion potential (ODP) and low global warming potential (GWP).
CASCADE SYSTEM ARRANGEMENTS
Multi-Cascade Design
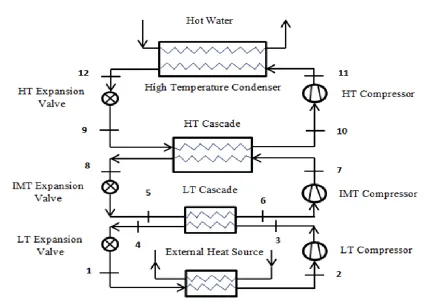
Figure 1: A schematic diagram for two Cascade heat pump design with three cycles.
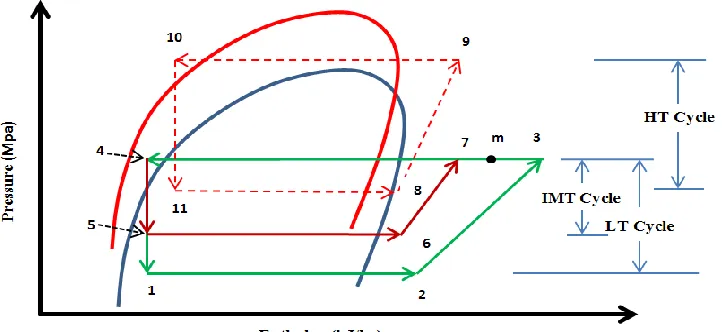
Figure 2: p-h diagram for systems (1, 2, and 3).
exchangers to convey heat from the LT evaporator to the HT cycle.
These heat exchangers work for energy transition from a low to higher temperature levels and the last represents the condenser of the HT cycle. Such system arrangement ensures a smooth progressive temperature and pressure increase.
Figure 3: A schematic diagram for compound Cascade heat pump design (Tarrad, 2017a).
Figure 4: p-h diagram for system (4) (Tarrad, 2017a).
cycle evaporator through the process (9-10) in the HT cascade. The highest temperature through the cycle is represented by the condensation process (11-12) at the HT cycle.
Compound Cascade Design
This design has been postulated and studied by (Tarrad, 2017a); sea water and ground heat sources were implemented. This arrangement is composed of three cycles (single cascade unit) circulating two different refrigerants as shown in Figure 3.
This system has been confirmed to reveal an improved thermal performance than a single Cascade system arrangement. It has been also concluded that the specific
power consumed by compressors of the proposed system showed a decrease of up to (3 %) lower than that of the single source Cascade system. The (p-h) diagram for such system is illustrated in Figure 4 where only one cascade heat exchanger is implemented in such system design.
Single Cascade Design
This is a standard Cascade heat pump arrangement where three heat exchangers, two thermal cycles, two compressors and two individual expansion devices are used as shown in Figure 5.
Figure 5: A schematic diagram for single Cascade heat pump arrangement with two cycles.
Figure 6: Arrangement for systems (5, 6, and 7).
SYSTEMDESIGNATION
The selected refrigerants correspond to different environment friendly groups such as pure and blend; non-Chlorine and non-Halogen with minimum GWP
Table 1: Test system designations according to unit technology and refrigerant pairs
Sys.
No. Unit Arrangement
Refrigerant Pairs Int. Temperature (°C)
LT IMT HT
Fig. No.
(1) Two Cascade System (3 Cycles) R744/R717/R134a 20 22.5 --- --- 35 35 1
(2) Two Cascade System (3 Cycles) R744/R717/R600a 20 22.5 --- --- 35 35 1
(3) Two Cascade System (3 Cycles) R410A/R717/R134a 20 22.5 --- --- 35 35 1
(4) Compound Cascade System (3 Cycles) R410A/R134a 35 35 35 3
(5) Single Cascade System (2 Cycles) R744/R134a 20 22.5 --- --- --- --- 5
(6) Single Cascade System (2 Cycles) R744/R600a 20 22.5 --- --- --- --- 5
(7) Single Cascade System (2 Cycles) R410A/R134a 20 22.5 35 --- --- --- --- --- --- 5
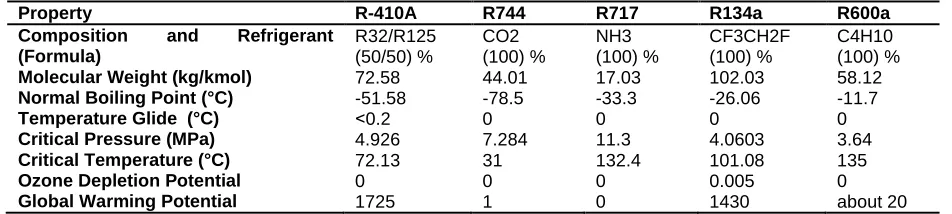
Table 2: Some selected physical properties of the suggested refrigerants
Property R-410A R744 R717 R134a R600a
Composition and Refrigerant
(Formula) R32/R125 (50/50) % CO2 (100) % NH3 (100) % CF3CH2F (100) % C4H10 (100) %
Molecular Weight (kg/kmol) 72.58 44.01 17.03 102.03 58.12
Normal Boiling Point (°C) -51.58 -78.5 -33.3 -26.06 -11.7
Temperature Glide (°C) ˂0.2 0 0 0 0
Critical Pressure (MPa) 4.926 7.284 11.3 4.0603 3.64
Critical Temperature (°C) 72.13 31 132.4 101.08 135
Ozone Depletion Potential 0 0 0 0.005 0
Global Warming Potential 1725 1 0 1430 about 20
showed that the best COP was achieved at LT evaporator temperature of (-2) °C, HT evaporation temperature in the range of (26-34) °C and HT condenser is at (70) °C (Tarrad,2017c). This system revealed that the minimum heating COP was achieved at (-10)°C for the whole range of test cycle intermediate temperature of (28.5-39)°C. It has been confirmed that the best performance can be attained in the range nearby (33 to 37) °CLT cycle intermediate temperature which gives temperature difference range of (6 to 14) °C in the cascade heat exchanger. R744/R717 Cascade heat pump has been proved by (Tarrad, 2017b) to exhibit the best heating COP at (22.5) °C cycle intermediate temperature and (70) °C HT condenser level.
This argument will be implemented for the purpose of the operating conditions and refrigerant pair selection. The test Cascade heat pump arrangements and refrigerant pairs are designated according to unit design technology and circulated refrigerants as shown in Table 1. The refrigerant combinations will take the designation as (LT
cycle/IMT cycle/HT cycle) refrigerants as required throughout this work.
The Cascade systems were examined with the refrigerant pairs listed in Table 2 for performance comparison where some selected operating properties are listed.
In reality all the selected refrigerants behave as pure fluids from the point of view of thermal and heat transfer characteristics. Although R410A contains two refrigerants, (50/50) % by weight of R32/R125, it still behaves as a pure refrigerant with negligible temperature glide of (˂0.2) °C as shown in Table 2.
THERMODYNAMIC ANALYSIS
Heat Exchangers
was estimated from the heating load, energy balance and adiabatic boundary condition as:
𝑚̇𝐿𝑇,𝑟𝑒𝑓 =
𝑄̇𝐿𝑇,𝑒𝑣𝑎𝑝
(ℎ𝑜𝑢𝑡−ℎ𝑖𝑛) (1)
The cascade heat exchanger works as an evaporator for the high temperature (HT) cycle and condenser for the LT cycle. The condensation load of this heat exchanger was estimated as:
𝑄̇𝑐𝑎𝑠𝑐𝑎𝑑𝑒= 𝑚̇𝑟𝑒𝑓× (ℎ𝑖𝑛− ℎ𝑜𝑢𝑡) (2)
For the HT cycle, the evaporator is represented by the cascade heat exchanger where heat is extracted from the condensation of the refrigerant circulated at the lower cycle level. The mass flow rate of the refrigerant circulated in this cycle was estimated from the energy balance through the cascade heat exchanger to give: 𝑚̇𝐻𝑇,𝑟𝑒𝑓 =
𝑄̇𝑐𝑎𝑠𝑐𝑎𝑑𝑒
(ℎ𝑖𝑛−ℎ𝑜𝑢𝑡) (3)
These relations represent the main concept of thermodynamic analysis of the present investigation. They could be applied for all systems described in Figures 1, 3 and 5 by using the proper values of enthalpy across each component.
Power Consumption
The power consumption was calculated for individual and multi compressors for a Cascade heat pump system from:
𝑊̇𝑐𝑜𝑚𝑝= 𝑚̇𝑟𝑒𝑓 (ℎ𝑜𝑢𝑡− ℎ𝑖𝑛) (4) 𝑊̇
𝑡𝑜𝑡𝑎𝑙,𝑐𝑜𝑚𝑝= 𝑊̇𝐿𝑇+ 𝑊̇𝐼𝑀𝑇+ 𝑊̇𝐻𝑇 (5)
Coefficient of Performance (COP)
It represents a measure for the system ability to convey heat from the low temperature level to the higher part of the system. The higher the value of heat output for a given power input is the better thermal performance and economic feasibility will be attained. It is defined as:
𝐶𝑂𝑃𝐻𝑒𝑎𝑡𝑖𝑛𝑔 =
𝑄̇𝐻𝑇,𝑐𝑜𝑛𝑑
𝑊̇𝑡𝑜𝑡𝑎𝑙,𝑐𝑜𝑚𝑝 (6)
The heat load output of the heat pump is corresponding to the condensation load obtained at the HT cycle condenser and the operating temperature there.
Case Study
The following conditions were considered for the purpose of comparison between the postulated systems:
Cascade system with superheat degree in evaporators of (6) °C and subcool degree of (2) °C in condensers for all cycles. Superheat degrees in piping system were (3) °C and (1) °C for the LT and HT cycles respectively were considered. The (HT) evaporation and condensation temperatures were set at (15, 20 or 30) °C and (70) °C
respectively with (LT) or IMT condenser at (25 or 40) °C. Evaporation temperature at the low side evaporator was ranged between (-15) °C and (-2) °C.
The compressors are operating at (70 %) and (80 %) isentropic and volumetric efficiencies respectively with (10 %) heat loss.
The sustainable heat load of (35) kW is extracted from sea water or ground, at (7) °C. Thermal fluid carrier entering temperature at (5) °C to the LT evaporator.
The available code (CoolPack) (Technical University of Denmark, 2001) for vapor compression refrigeration cycles was implemented wherever it is needed to collect the physical properties of the analyzed refrigerants and assessment verification objectives.
RESULTS AND DISCUSSION
The evaluation was based on the performance of the system for a fixed heat load extracted from the low temperature heat source. The basic criterion for the assessment is basically represented by the heating COP of the heat pump. It was focused on the proper refrigerant pairs to be in favor for the low temperature heat source, expected running cost for heating load generation and hence the proper heat pump technology to be selected.
Compressors Power Consumption System-refrigerant combination
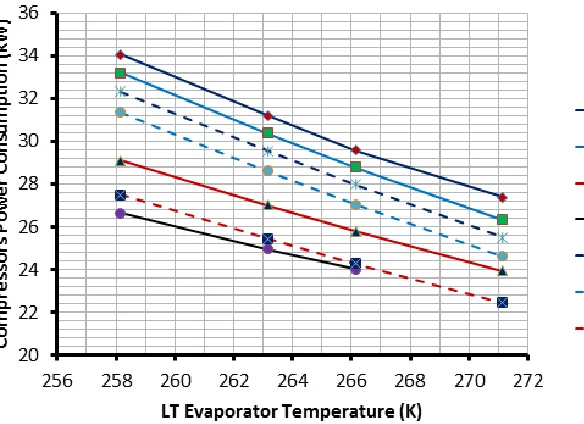
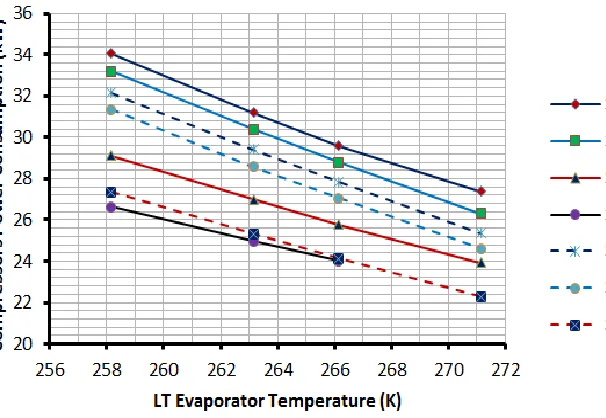
Figure 7 illustrates a comparison for the power consumed by different refrigerant pairs and system arrangements. The power consumed by the implementation of the compound Cascade system (4) revealed the minimum value in the range of (24 to 26.5) kW followed by systems (7) and (3) at (20) °CLT cycle intermediate temperature. The results showed that maximum power consumption was exhibited by system (1) which was ranged between (27 and 34) kW for the whole LT cycle test evaporator temperature range. Other systems occupy the domain of numerical values enclosed between the maximum and minimum values of systems (1) and (4), Figure 7a. At (22.5) °C LT cycle intermediate temperature, the power consumption is ranged between (25 and 32) kW for system (1). At the same LT temperature, the heat pump compressors consumed power in the range (20 and 25)
kW for system (7) exhibited at the whole range of LT cycle evaporator temperature, Figure 7b.
Effect of LT cycle intermediate temperature
Figure 7a: (20)°C LT cycle intermediate temperature.
Figure 7b: (22.5)°C LT cycle intermediate temperature.
Figure 7: Compressor power consumption comparison of all systems at different LT cycle intermediate temperatures.
temperature lift for the high cycle will be lower for the higher cycle intermediate (22.5) °C than that required for the (20)°C. The trend of the data showed a decrease of the consumed power by the Cascade systems with the increase of the LT cycle evaporator temperature. It approaches a minimum at (-2) °C for all of the test systems regardless of its type or heat pump technology arrangement. It is obvious that Cascade systems (3, 4 and 7) which include R410A and R134a exhibited the lower power consumption compared to systems contains R744 in their composition. This is due to the fact that R410A and R134a operate at lower pressure range and
their thermal characteristic criteria at low and moderate temperature level.
Figure 8a: Two Cascade systems compared to compound system.
Figure 8b: Single Cascade systems compared to compound system.
Figure 8: Power consumption comparison at different LT cycle intermediate temperatures.
was the highest among the rest systems; it was about (28%) and (26%) higher than that of system (7) at (22.5) °C for cycle intermediate temperatures of 15) °C and (-2)°C respectively.
R410A systems comparison
The systems that circulate R410A at the LT cycle evaporator include systems (3, 4 and 7) as shown in Table 1. It has been stated that these systems possess the lower compressor power consumption as shown in Figures 7 and 8 above. Figure 9 illustrates a comparison
Figure 9: Power consumption comparison between systems circulating R410A at LT cycle evaporator.
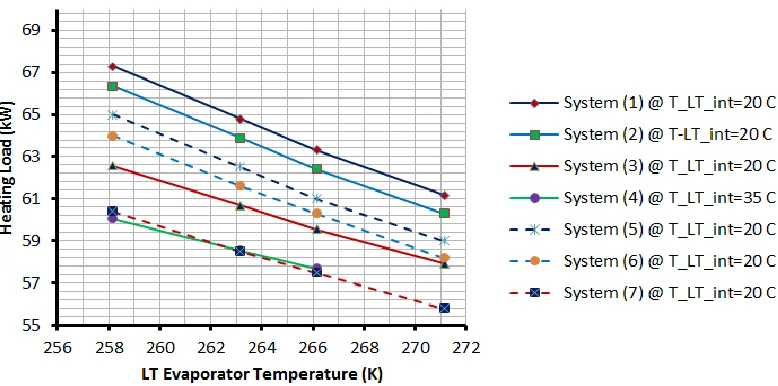
Figure 10: Heat pump heating load comparison of investigated systems at 20 °C LT cycle intermediate temperature.
for system (7) at LT cycle intermediate temperature of (35) °C. It is important to mention that the discrepancy between these systems in the band is only within (2 -4) % for the whole range of LT cycle evaporator and intermediate temperatures. System (3) at (22.5) °C LT cycle intermediate temperature performed as similar as those of system (7) at LT cycle intermediate temperatures of (20 and 35) °C for LT evaporator temperature range (-15 to -7) °C, Figure 9.
Heating Load Output
The heat output of the heat pump depends on the power consumption to convey a certain amount of heat from the
low level to the higher level of temperature in a heat pump. If ideal conditions exist; then the heat load output is described by the following conditions:
𝑄̇𝐻𝑇,𝑐𝑜𝑛𝑑= 𝑄̇𝐿𝑇,𝑒𝑣𝑎𝑝+ 𝑊̇𝑡𝑜𝑡𝑎𝑙,𝑐𝑜𝑚𝑝 (7)
Figure 10 illustrates a comparison for the heat output between the test system arrangements and its variation with the LT cycle evaporator temperature. According to the physical argument related to Equation (7), system (1) revealed the highest heating load output of the heat pump at (20) °C LT cycle intermediate temperature.
Figure 11: Heat pump heating load comparison between systems circulating R410A at LT evaporator.
Figure 12a: (20)°C LT cycle intermediate temperature.
fact that the power consumed at (20) °C is higher than that at (22.5) °C LT cycle intermediate temperature as shown above. The compound Cascade system (4) achieved heating load close to that of system (7) at (20) °C and it is closer to system (3) at (22.5) °C LT cycle intermediate temperature.
Investigating Figure 10 for the heat load variation with LT cycle evaporator temperature showed similar behavior as that of the compressor power consumption. It exhibits the same trend for all of the tested systems with LT evaporator. The heating load showed a decrease with LT evaporator temperature increase, hence the minimum was achieved at (-2) °C and maximum at (-15) °C. The lowest heating load was experienced by system (7) at LT cycle intermediate temperature of (22.5) °C, it was ranged between (54) kW and (58) kW estimated at (-2) °C and (-15) °C LT evaporator temperatures respectively.
R410A Cascade systems (3, 4, and 7), are compared in Figure 11 for different LT cycle intermediate
temperatures. It is obvious that system (7) experienced the lowest numerical values at (22.5) °C LT cycle intermediate temperature and the highest were experienced for system (3) at (20)°C LT cycle intermediate temperature to be within (7 %) discrepancy. Other systems are bounded by close numerical values band between (55) kW and (61) kW at maximum and minimum LT evaporator temperature. This band showed a maximum discrepancy of (2 %) for the whole test ranges of LT cycle evaporator and intermediate temperatures.
Coefficient of Performance (COP)
Systems COP comparison
Figure 12b:(22.5) °C LT cycle intermediate temperature.
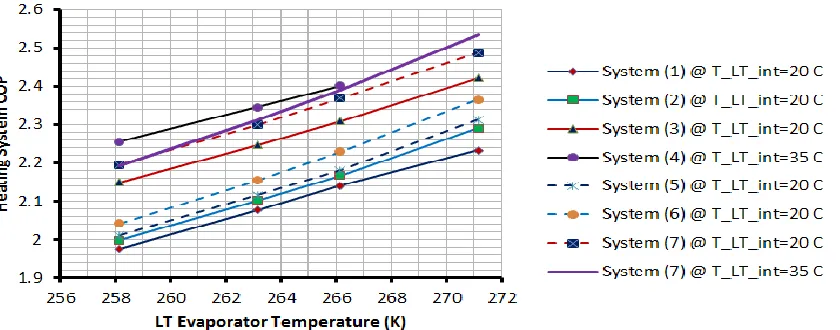
Figure 12: Heat pump heating COP comparison of all systems at different LT cycle intermediate temperatures.
Figure 13a: (20)°C LT cycle intermediate temperature.
parameter on the operating conditions of the system, circulated refrigerant and system arrangement technology. Cycle intermediate temperature is a vital measure that should be considered when the evaluation to be conducted for a Cascade heat pumps (Tarrad, 2017a-c). System (7) showed the highest heating COP ranged between (2.3) and (2.7) followed by system (3) and system (4) at (22.5) °CLT cycle intermediate temperature. The lowest COP was exhibited by system (1) in the range (2) and (2.2) followed by systems (2) and (5) measured at (20) °C LT cycle intermediate temperature. The results of system (7) at (35)°C LT cycle intermediate temperature showed that the heating COP was ranged between (2.3) and (2.5). These values represent the best performance when compared to other systems at (20) °C LT cycle intermediate temperature as shown in Figure 12a. This system also showed a similar
performance to that of system (3) and system (4) at (22.5) °C and at (35) °C intermediate temperatures respectively.
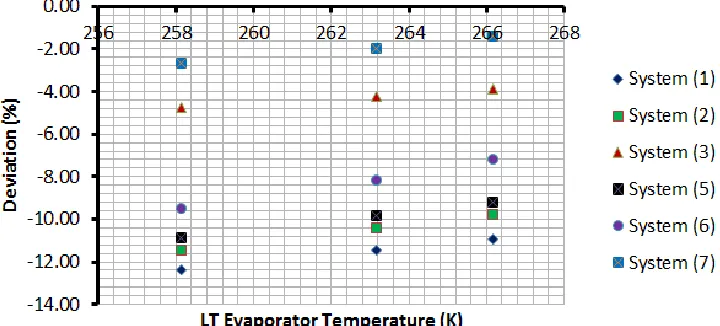
The deviation of the heating COP of different systems was estimated with respect to Cascade heat pump system (4) from:
𝜀 =
𝐶𝑂𝑃𝑆𝑦𝑠𝑡𝑒𝑚−𝐶𝑂𝑃𝑆𝑦𝑠𝑡𝑒𝑚 (4)𝐶𝑂𝑃𝑆𝑦𝑠𝑡𝑒𝑚 (4) (8)
Figure 13b: (22.5)°C LT cycle intermediate temperature.
Figure 13: Systems heating COP deviation with respect to system (4) value at different LT cycle intermediate temperatures.
Figure 14: Heat pump heating COP comparison at different compressor isentropic efficiencies.
and exhibited higher values at (22.5) °C LT cycle intermediate temperature by (3 to 5) % for the whole test range of LT evaporator, Figure 13. System (3) performed the same as system (4) at (22.5) °C LT cycle intermediate temperature and closer than other system at (20) °C LT cycle intermediate temperature in the range of (1 to 2.7) % for the whole test range of LT evaporator.
The lowest COP was revealed by system (1) for both cycle intermediate temperatures, it ranged between (11-12) % and (8-10) % at (20) °C and (22.5) °C LT cycle intermediate temperatures respectively.
Compressor isentropic efficiency
The results of this investigation were based on the lower expected isentropic efficiency of the compressors where
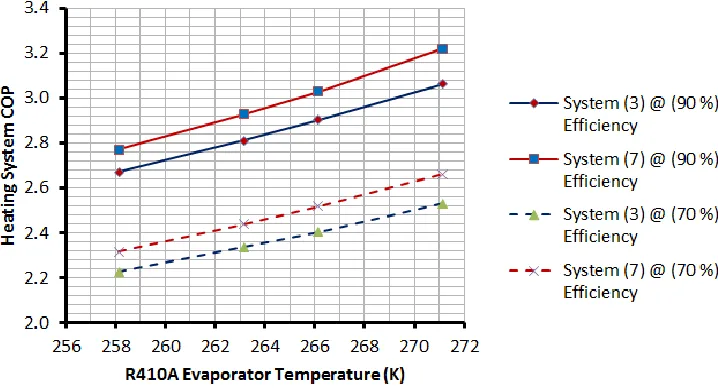
a value of (70 %) was implemented. To investigate the effect of this parameter on the overall performance of the heat pump, the systems which possess the highest heating COP will be examined with (90 %) isentropic efficiency for comparison. Hence systems (3) and (7) operating at (22.5) °C LT cycle intermediate temperature were chosen for this purpose. Figure 14 illustrates a comparison for the heating COP of both systems at two different compressor isentropic efficiencies, (70 %) and (90 %).
Figure 15: Heat pump heating load generation unit price comparison for R410 systems at (22.5) °C and (90 %) compressor isentropic efficiency.
and (3) were (3.2) and (3.1) respectively predicted at (-2) °C LT cycle evaporator temperature and (90 %) compressor is entropic efficiency.
Running cost of heat pump
Although the cost assessment is out of the scope of the present work, but an attempt was considered to assess the running cost of the heat pump. The results of Figure 14 at compressor isentropic efficiency of (90 %) were implemented for comparison with the base compound Cascade system configuration. The price of electricity for industrial utilization was taken as (0.091) €/kWh from the available data base published for European countries (Eurostat-Statistics Explained, 2016a). Figure 15 represents a comparison of the unit price of heating load generation per (kWh) for systems (3, 7 and 4) estimated at the LT cycle evaporator temperature range.
It is obvious that the unit price cost of heating load generation for the compound Cascade system showed the lowest level among other system configurations. It ranges between (0.028 and 0.03) €/kWh for the whole LT cycle analyzed evaporator temperature range. System (3) exhibited the highest unit price cost, it ranges between (0.029 and 0.034) €/kWh estimated at (-2) °C and (-15) °CLT cycle evaporator temperatures respectively.
These values of running costs for heating load generation are equivalent to a mean price of (35 %) of the electrical resistance utilities used for hot water production. Most of the fossil fuel technologies used for hot water production are natural gas firing utility boiler due to its high heat value and almost no solid residuals left while firing. The unit price of heating load generation is obtained to be
(0.039) €/kWh when natural gas is fired (Eurostat-Statistics Explained, 2016b). The unit price for the heat pump technology described here constitutes about (80 %) of the natural gas cost estimated on a mean value basis.
The ground source heat pump can reduce energy bills by at least 26% over a new gas boiler (Green Match, 2014). The high installation cost of a ground and sea water heat sources can be refunded after few years of operation due to its low running cost. This argument explores the idea to use the sustainable energy sources for heating purposes on a long term basis.
CLOSURE STATEMENT
The Cascade system is the best option for low temperature heat sources where hot water at moderate or high temperature is needed. The present work showed that good judgement can be inferred from the operating conditions to select the best system to fulfill the thermal demands. Two Cascade heat pump systems offer smooth and gradual thermal lump motion throughout the heat pump without excessive loading for compressors, Figure 16. Longer working age could be expected for compressors, hence lower operating and maintenance cost for Cascade system than the single Cascade technology will be achieved.
Figure 16: Thermal domain for temperature distribution at the two Cascade heat pump systems.
provides a tremendous enhancement for the heating COP of the Cascade heat pump. This conclusion was confirmed by the previous work of (Tarrad, 2017a-c) as well.
CONCLUSIONS
The combination of system technology arrangement, operating conditions and refrigerant pairs is a difficult task to be handled in the heat pump technology. The single Cascade heat pump unit designated as systems (5, 6 and 7) corresponding to the single Cascade systems R744/R134a, R744/R600a and R410A/R134a refrigerant pairs represent moderate and highest performance achievement. The single Cascade heat pump circulating R410A/R134a and the two Cascade R410A/R717/R134a refrigerant pairs showed the best performance for both of investigated LT cycle intermediate temperatures. Nevertheless, the former refrigerant pair exhibited higher heating COP than that of the latter by only (3.6-5) % estimated at (22.5) °C LT cycle intermediate temperature and test LT evaporator temperature. Systems (1) and (2) showed a discrepancy of about (8-10) % and (6-9) % when compared to system (4) at (22.5) °C LT cycle
intermediate temperature at test LT evaporator temperature. The compound Cascade heat pump designated as system (4) revealed excellent heating COP, it is a promising option at low temperature heat source for heating purpose. The operating environment of the machine is an effective measure to be considered for the heat pump evaluation. Lower operating and maintenance costs for (two Cascade system) arrangement than that of the single Cascade technology will be expected. The running cost of heat pump is lower than that for the fossil fuel utility used for heating load generation. The unit price of the heating load output depends on the operating LT evaporator level, amount of heating load output and compressor isentropic efficiency. When the latter was taken as (90 %), the unit price for heating load generation constitutes about (35 %) and (80 %) of those to be spent for electrical resistance and natural gas utility boilers for hot water production.
ACKNOWLEDGEMENT
The author would like to express his sincere thanks to Mechatronic Engineering Department staff in the University of Southern Denmark (SDU) for providing the facilities to accomplish this work.
NOMENCLATURE
Parameter Definition Subscripts
COP Coefficient of performance cascade Cascade Heat Exchanger
GHE Ground heat exchanger comp Compressor
GWP Global Warming Potential cond Condenser
h Fluid enthalpy (kJ/kg) evap Evaporator
HT High temperature cycle in Inlet port
IMT Intermediate temperature cycle int Intermediate
LT Low temperature cycle out Outlet port
𝑚̇ Mass flow rate (kg/s) ref Refrigerant
ODP Ozone Depletion Potential total Total value
p Pressure (Mpa) Greek Letters
𝑄̇ Heat load (kW) 𝜀 Deviation (%)
T Temperature (°C) or (K)
REFERENCES
Ali M H, Selamat S, Kariya K, Miyara A, (2016).Experimental performance estimations of horizontal ground heat exchangers for GSHPsystem,16thInternational Refrigeration and Air Conditioning Conference, Purdue, Paper 1808, Purdue University, USA,http://docs.lib.purdue.edu/iracc/1808. Baker A, Schaefermeyer D, (2013).Sea water heat pump
project, Alaska Center for Energy and Power (ACEP) Rural Energy Conference Forum.
Bertsch S, Uhlmann M, Heldstab A, (2014). Heat pump with two heat sources on different temperature levels, International Refrigeration and Air Conditioning Conference, Paper 1372,Purdue University, USA, http://docs.lib.purdue.edu/iracc/1372.
Energinet (2014).Environmental Report for Danish electricity and CHP – Summary of the Status year 2014, Papers-4.,Denmark.
Eurostat-Statistics Explained (2016a). “Electricity price statistics”, Data extracted in November 2016. Most recent data: Further Eurostat information, Main tables and Database.
http://ec.europa.eu/eurostat/statistics-explained/index.php/Electricity_price_statistics. Accessed on 25th April, 2017.
Eurostat-Statistics Explained (2016b). “Natural gas price statistics”, Data extracted in November 2016. Most recent data: Further Eurostat information, Main tables and Database.
http://ec.europa.eu/eurostat/statistics-explained/index.php/Natural_gas_price_statistics. Accessed on 25th April, 2017.
Green Match, 2014. “The Running Costs of Heat Pumps”,http://www.greenmatch.co.uk/blog/2014/08/the -running-costs-of-heat-pumps. Accessed on 25th April, 2017.
Jang SW, Lee YL (2015). Study on improving the performance of the Cascade heat pump cycle using ejectors”, Indian Journal of Science and Technology, 8(30), DOI:10.17485/ijst/2015/v8i30/73895.
Kasi P (2015). Simulation of thermodynamic analysis of Cascade refrigeration systems with alternative refrigerants, International Journal of Mechanical Engineering and Technology (IJMET), 6 (1), 71-91. Kim DH, Park HS, Kim MS (2013). Optimal temperature
between high and low stage cycles for R134a/R410A Cascade heat pump based water heater system”, Experimental Thermal and Fluid Sci., 47: 172-179. Pedersen T, Ditlefsen C, Hojberg AL (2012). Shallow
geothermal energy in Denmark, Geological Survey of Denmark and Greenland Bulletin 26, 37–40. Open access: www.geus.dk/publications/bull.
Røgen B, Ditlefsen C, Pedersen T, Nielsen L H, Mahler A,April (2015).Geothermal Energy Use, 2015 Country Update for Denmark, Proceedings World Geothermal Congress, Melbourne, Australia, 19-25.
Song Y, Li D, Yang D, Jin L, Cao F, Wang X, (2016). Performance comparison between the combined R134a/CO2 heat pump and Cascade R134a/CO2 heat pump for pace heating, International Journal of Refrigeration, 74, 592-605, http://dx.doi.org/DOI: 10.1016/j.ijrefrig. 2016.12.001.
Tarrad AH, (2017a). Thermodynamic analysis for hybrid low temperature sustainable energy sources in Cascade heat pump technology, Asian Journal of Engineering and Technology (AJET),5 (2), 29-46. Tarrad AH (2017b). Thermodynamic performance
evaluation for low temperature heat source Cascade system circulating environment friendly refrigerants, International Journal of Energy and Environmental
Science, 2(2): 36-47, DOI:
10.11648/j.ijees.20170202.12.
Tarrad AH (2017c). Thermodynamic evaluation for intermediate temperature optimization in low temperature heat source Cascade heat pump technology, accepted for publication in International Journal of Environmental Science (IJES).
Technical University of Denmark (DTU), (2001). “CoolPack Software: A Collection of Simulation Tools for Refrigeration”, Denmark.
Uhlmann M, Bertsch S, Heldstab A, (2014). Heat pump with two heat sources on different temperature levels, International Refrigeration and Air Conditioning
Conference. Paper no.
1372.http://docs.lib.purdue.edu/iracc/1372.
Yrjölä J, Laaksonen E, (2015). Domestic hot water production with ground source heat pump in apartment
buildings, Energies, 8, 8447-8466,
DOI:10.3390/en8088447.
Accepted 16 May, 2017
Citation: Tarrad AH (2017). Performance optimization assessment for a proper heat pump technology functions at low temperature heat source. International Research Journal of Power and Energy Engineering, 3(1): 019-034.