www.fm.viamedica.pl
Address for correspondence: M. Równiak, Department of Comparative Anatomy, University of Warmia and Mazuria, Plac Łódzki 3, 10–767 Olsztyn, Poland, tel: +48 89 523 32 98, e-mail: [email protected]
A morphometric study of the amygdala
in the rabbit
M. Równiak, A. Robak, S. Szteyn, K. Bogus-Nowakowska, B. Wasilewska, J. Najdzion
Department of Comparative Anatomy, University of Warmia and Mazuria, Olsztyn, Poland
[Received 30 October 2006; Revised 25 January 2007; Accepted 25 January 2007]
Volumetric measurements of the individual nuclei in the amygdala (CA) of the rabbit reveal poor development of the basolateral (BL) and lateral olfactory tract (NLOT) and medial (ME) nuclei. On the other hand, the volumes of the lateral (LA), basomedial (BM), central (CE) and cortical (CO) nuclei are remarkable in this species. A comparison of the densities of neurons in the individual nuclei with the mean numerical density of cells in the rabbit CA indicates that the densities of neurons in LA, BL and BM are significantly lower than the mean (p < 0.05), whereas in CE, CO, ME and NLOT these values are significantly higher than the mean (p < 0.05). It should be noted, however, that of all the nuclei studied those in CE show the greatest similarity in density to CA as a whole. To some extent a similar division of the rabbit CA may be made using the size parameters of the amygdaloid neurons as a marker. The large neurons populate less densely organised CA areas such as LA, BL and BM, whereas the small cells create ME and NLOT, where the neurons are densely arranged. The CE and CO occupy intermediate positions, with the neurons similar in size to the mean for the total rabbit CA.
These morphometric data from CA in the rabbit, when compared with the sim-ilar data for the common shrew and guinea pig (see our previous papers), lead to the conclusion that the amygdalae in all three species are very similar with respect to the distribution of neurons in relation to density and size and that, when volumetric measurements are taken into account, CA in the rabbit is much more similar to that of the guinea pig than that of the common shrew.
Key words: amygdala, rabbit, morphometric analysis, 3-dimensional reconstructions
INTRODUCTION
Our previous morphometric studies in the com-mon shrew [32] and guinea pig [33] have decom-mon- demon-strated some interesting differences in the organi-sation of the amygdala (CA) in the two species. These include the following:
1. Volumetric differences in the relative size of par-ticular nuclei in CA of the common shrew [32] and guinea pig [33]. These are the most interest-ing of the differences observed. For example, the
that a comparison of the total numbers of neurons in the individual CA nuclei in the com-mon shrew [32] and guinea pig [33] respectively confirmed all the changes presented by the volu-metric measurements and made them even clear-er. For example, the percentages of LA and BM neurons in the guinea pig CA [33] are distinctly higher than in the common shrew [32]. More-over, the increases in neuronal population size in both these nuclei are even greater than their vol-ume increases. The marked volvol-ume reduction of BL and NLOT seen in the guinea pig [33] was ac-companied by an even more marked reduction in the total number of neurons in both these nuclei.
2. A clear reduction in density in CA and in all its subdivisions in the guinea pig was revealed by a comparison of the density of neurons in CA of this species [33] and the common shrew [32]. When the difference in the size of CA in the two species is taken into account, the result suggests a negative correlation between the size of CA and the density of cells in it.
3. An increase, however, in the size of the neurons in the guinea pig CA and its subdivisions was re-vealed [33] when compared with the common shrew [32].
In the light of these observations, it is of interest to examine CA in other mammalian species and com-pare it to that of the common shrew [32] and guinea pig [33]. Therefore the aim of this study was to give for the first time detailed morphometric characteris-tics of CA in the rabbit. Since the raw data for the morphometric measurements in the common shrew [32], guinea pig [33] and rabbit (the present paper) were assembled in the same laboratory with the use of the same methods, comparisons between these three species may prove particularly interesting.
MATERIAL AND METHODS
A total of 6 brains were used to study the mor-phometric parameters of CA in the rabbit. All efforts were made to minimise both animal suffering and the number of animals used. The brains were re-moved from the skulls, embedded in paraffin and sectioned on a Leica microtome at a thickness of 50 µm in the coronal plane. The scraps were rehy-drated and stained with the cresyl violet according to the Nissl method.
All sections were analysed cytoarchitectonically and morphometrically with a calibrated image anal-ysis system consisting of a computer equipped with
morphometric software (Multi-Scan 8.2, Computer Scanning Systems, Poland) and a light microscope coupled with a digital camera (CM40P, VideoTronic, Germany). The sequence of operations performed on a single animal is described in detail below.
The three-dimensional reconstructions of the amygdala
The microscopic fields were viewed at low magni-fication through the five-fold objective. The 512 × 512 pixel microscopic images of a single section were digitally recorded by means of a camera coupled to a microscope and a computer. The scans were sub-sequently joined together to form larger areas com-prising the whole CA and adjoining structures (so-called “digital slices”). Every second section in the series of microtome scraps available was taken into account.
The digital slices were registered by means of TPS (F. James Rohlf, State University of New York, Suny at Stony Brook, N.Y., USA) and the Morpheus et al. (Dennis E. Slice, State University of New York, Suny at Stony Brook, N.Y., USA) morphometric software by generalised Procrustes analysis (GPA), which su-perimposes the landmark configurations using the least-squares estimates for the translation and ro-tation parameters [2, 7, 29, 30]. For more detailed information about the registration process used in the present study see our previous paper in this series [32].
All the digital slices of CA recorded from a single animal were incorporated into one multi-sliced 3-D image (a so-called “stack”). In this kind of 3-D data set the digital slices were the consecutive serial sec-tions oriented perpendicular to the long axis of CA, covering its entire rostrocaudal extent. On each dig-ital slice the boundaries of the individual amygda-loid nuclei were outlined in different colours by a mouse-driven cursor. All the outlines were drawn under the control of a light microscope. The definite stack was then composed of the serially aligned raw images with the outlined structures of CA incorpo-rated. With the help of IGL Trace software the 2-D outlines were transformed into 3-D slabs. The 3-D reconstruction of CA for a single animal was simply the sum of all the serially aligned slabs.
Volumetric analysis
volume presented in this study was the sum of the volumes of the 7 amygdaloid nuclei studied, namely the lateral, basolateral, basomedial, central, corti-cal, medial and lateral olfactory tract nuclei.
Numerical density counts
To estimate the numerical density of cells in each of the amygdaloid nuclei, the optical dissector meth-od was implemented using the guidelines described by West et al. [40].
Evaluation of the total number of neurons The total number of neurons in each of the nuclei studied was calculated by multiplying the volume of the nucleus and the numerical density of cells in it [40].
The morphometric parameters of the neurons In each of the individuals studied a morphomet-ric analysis of CA neurons was performed using Multi-Scan 8.2 morphometric software. Each neuron was characterised by a set of morphometric parameters: the length (the long axis of the soma), the width (the short axis of the soma), the size (the sum of both axes) and the shape factor (the ratio of both axes). The test frames were arranged so as to cover the total cross-sectional area of the nucleus studied. In the rabbit 5 cross-sections per nucleus were tak-en into account for a single animal.
Statistical analysis
The statistical analysis was performed using CSS: Statistica v.5.0 (Statsoft, USA). The analysis of vari-ance (ANOVA) was performed followed by the post-hoc tests (Duncan’s post-post-hoc analysis) and planned comparison tests (Student’s paired t-test) between consecutive pairs of means. The level of statistical significance was set at p < 0.05. In order to evalu-ate the precision of all measurements, the coeffi-cient of error was calculated. Values below 0.1 were achieved for all the parameters presented.
RESULTS
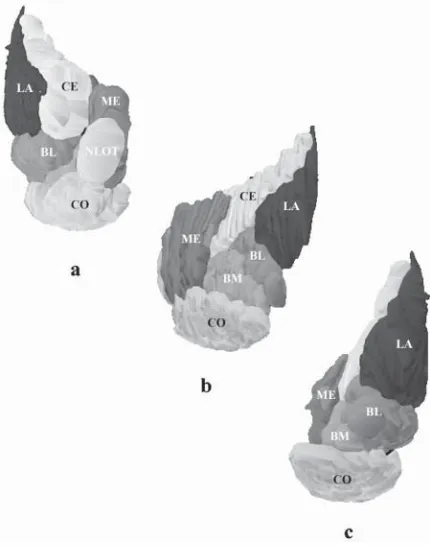
The nuclear pattern of the rabbit amygdala The positions of the various nuclei in the rabbit CA and the pattern delimited by them are shown in Figures 1 and 2, respectively.
As in the other mammalian species, CA of the rab-bit is composed of three groups of nuclei. The largest and the best-differentiated portion of CA is the baso-lateral nuclear group (BLC), consisting of the baso-lateral (LA), basolateral (BL) and basomedial (BM) nuclei. The second is the central group (CC), composed of the
anterior amygdaloid area (AAA) as well as the central (CE) and intercalated nuclei (I). The third portion of CA is the corticomedial group (CMC), formed by the cortical (CO), medial (ME) and lateral olfactory tract (NLOT) nuclei and the amygdalohippocampal area (AHA). Although the borders of CA nuclei in the rab-bit were generally easy to recognise, some regions were poorly delineated against the surrounding nu-clei and so not amenable to precise measurement. Because of general delimitation problems AAA, I and AHA were excluded from the volumetric investigation in the present study. The minor difficulties which were encountered in delineating the boundary between the BM and CO, as well as the rostral borders of ME and CE, were overcome by taking into consideration the borders in the adjacent sections.
The general morphology and cellular structure of the nuclei studied in the rabbit CA and their parcella-tion into the finer parts are very similar to those de-scribed by Krettek and Price [15] in the rat. However, there are also some features peculiar to CA of the rabbit. In brief, on the basis of more subtle differenc-es in density and cell size within LA and BM, they can be further subdivided into the anterior (LAa and BMa) and posterior (LAp and BMp) parts. The BL, which is subdivided into two or three regions in many mam-mals, forms in the rabbit a fairly homogenous mass of cells, which cannot be subdivided into separate parts. Another characteristic feature of the rabbit CA is a very well developed CE, which is formed by the medial (CEm) and lateral (CEl) subdivisions. The CO, which is also prominent in this species, consists of three distinct regions: the anterior cortical nucleus (COa), the periamygdaloid cortex (COc) and the pos-terior cortical nucleus (COp). Finally, it is also possible to distinguish two regions in the ME by according to differences in the densities and sizes of the cells. The anterior part (MEa) forms the rostral and main body of the nucleus, whereas the posterior part (MEp) con-stitutes a small thin caudal portion.
The morphometric parameters of the rabbit amygdala
The morphometric data concerning individual CA nuclei are listed in the respective rows of Table 1. The values for CA as a whole are presented in the last row.
Volume
average volume in the rabbit CA is that of NLOT, while the largest is that of LA. According to the raw measurements and percentages, almost all the nu-clei studied are significantly different from each other (p < 0.05), although CE does not differ statistically from CO (p > 0.05).
Numerical density
The density of neurons in the rabbit CA is smallest in BL, while that in ME it is largest. A comparison of the densities of cells in the individual nuclei with the average for the total CA reveals that the densities of neurons in LA, BL, and BM are significantly lower than the mean (p < 0.05), while in CE, CO, ME and NLOT these values are significantly higher than the mean (p < 0.05). It should be noted that with respect to the density of neurons all the nuclei studied are sig-nificantly different from each other (p < 0.05).
The total number of neurons
The smallest number of neurons in the rabbit CA is in NLOT, while the largest is in CO. Accord-ing to the raw measurements and percentages, almost all the nuclei studied are significantly dif-ferent from each other (p < 0.05), although LA does not differ significantly from CE (p > 0.05) or BL from BM (p > 0.05).
The morphometric parameters of neurons in the amygdala of the rabbit
Since the morphometric parameters of neurons in CA nuclei are listed in Table 2, the most interest-ing results may be summarised here:
1. The smallest neurons according to size (the sum of the length and width of the soma) in the rab-bit CA were found in I, while the cells in BL were the largest.
2. The average sizes of neurons in LA, BL, BM and CE are significantly greater than that of the mean CA neuron (p < 0.05). In I, CO, ME and NLOT they are significantly lower than the mean (p < 0.05). It should be noted however, that the neurons in CE and CO, Figure 2. 3-D reconstruction of the rabbit amygdala: a–c.
Ros-tral, posteromedial and caudal views respectively; BL — baso-lateral nucleus of the amygdala; BM — basomedial nucleus of the amygdala; CE — central nucleus of the amygdala; CO — cortical nucleus of the amygdala; ME — medial nucleus of the amygdala, medial part; NLOT — nucleus of the lateral olfactory tract; LA — lateral nucleus of the amygdala.
Table 1. The morphometric parameters of the individual amygdaloid nuclei of the rabbit amygdala
Nucleus Volume Percentage Numerical Total number Percentage
[mm3] of volume (%) density [N/mm3] of neurons (N) of neurons (%)
LA 5.1 ± 0.57 24.09 ± 1.08 47336.77 ± 1159.3 241237.93 ± 23735 20.54 ± 1.07
BL 3.49 ± 0.39 16.48 ± 0.72 24871.79 ± 697.66 86709.26 ± 8835.7 7.38 ± 0.44
BM 1.96 ± 0.25 9.23 ± 0.5 41152.74 ± 1339.4 80712.98 ± 11779 6.84 ± 0.42
CE 3.8 ± 0.42 17.96 ± 0.77 62101.55 ± 1742 236519.27 ± 31294 20.09 ± 0.96
CO 3.99 ± 0.48 18.82 ± 0.67 70108.7 ± 1757.2 279996.9 ± 36703 23.77 ± 0.9
ME 2.31 ± 0.22 10.91 ± 0.68 91138.81 ± 2556.4 209909.76 ± 15760 17.9 ± 0.83
NLOT 0.53 ± 0.06 2.51 ± 0.1 76827.76 ± 2155 40943.21 ± 5257.4 3.48 ± 0.13
CA 21.19 ± 2.22 100 ± 0 59076.88 ± 843.43 1176029.3 ± 123982 100 ± 0
Table 2. The morphometric parameters of the neurons in the individual amygdaloid nuclei of the rabbit amygdala
Nucleus Length of neurons [µm] Width of neurons [µm] Size of neurons [µm] Shape of neurons
LA 16.72 ± 0.48 12.17 ± 0.3 28.9 ± 0.76 1.37 ± 0.02
BL 20.35 ± 0.85 14.45 ± 0.21 34.8 ± 1.01 1.41 ± 0.05
BM 16.32 ± 0.3 11.39 ± 0.55 27.71 ± 0.37 1.43 ± 0.09
CE 15.9 ± 0.67 10.7 ± 0.64 26.6 ± 1.33 1.49 ± 0.02
CO 15.82 ± 0.48 10 ± 0.23 25.82 ± 0.39 1.58 ± 0.07
I 11.54 ± 0.41 8.22 ± 0.37 19.76 ± 0.55 1.4 ± 0.09
ME 13.37 ± 0.39 8.95 ± 0.16 22.32 ± 0.32 1.49 ± 0.07
NLOT 14.5 ± 0.74 8.92 ± 0.62 23.42 ± 1.36 1.63 ± 0.02
CA 15.57 ± 2.59 10.59 ± 2.05 26.17 ± 4.60 1.475 ± 0.09
BL — basolateral nucleus of the amygdala; BM — basomedial nucleus of the amygdala; CA — amygdala; CE — central nucleus of the amygdala; CO — cortical nucleus of the amygdala; I — intercalated nucleus of the amygdala; ME — medial nucleus of the amygdala, medial part; NLOT — nucleus of the lateral olfactory tract; LA — lateral nucleus of the amygdala
which share similar features in terms of size, occupy intermediate positions in CA evaluations, with size values close to the mean for the total CA.
3. The smallest shape factor (a ratio of the length and width of the soma) was noted in LA, where-as the largest wwhere-as in NLOT.
4. The shape factor values in CO and NLOT were significantly higher than the mean value for the total rabbit CA (p < 0.05). In CE (p > 0.94) and ME (p > 0.27) these values do not differ statisti-cally from the mean. In LA, BL, BM and I they are significantly lower than the mean (p < 0.05). 5. In terms of size all the nuclei studied in CA were
significantly different from each other (p < 0.05), while in terms of shape factor the I does not dif-fer statistically from LA, BL or BM (p > 0.05), nor the CE from ME (p > 0.05).
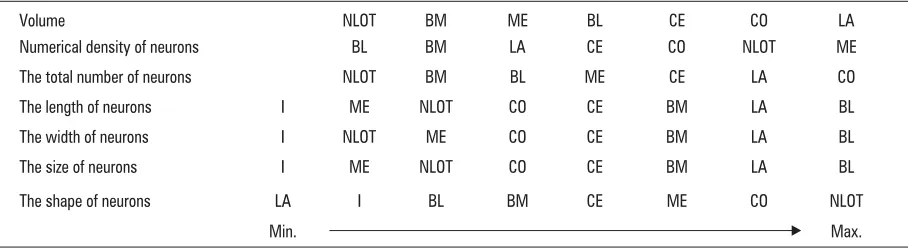
In order to summarise the data presented in this study, the nuclei series of the rabbit CA has been presented in order of increase of the morphometric parameters (Table 3).
DISCUSSION
This is the first investigation to provide a detailed morphometric analysis of the 8 nuclei in the rabbit CA. There have, however, been some morphometric reports which have described selected aspects of the rabbit CA [6, 10, 11]. Examples worth mentioning are the volumetric studies of Jagalska-Majewska et al. [10, 11] and the detailed description of the size of CA neurons by Dziewiątkowski et al. [6]. No mor-phometric data concerning the number and density of the neurons in the rabbit CA have been made avail-able to date.
Volume
The silent finding of this study as far as volumet-ric relationships are concerned was the striking sim-ilarity in the organisation of CA in the rabbit (present results) and guinea pig [33]. Some of these similari-ties are indicated here.
1. The volumetric comparisons of the three parts of CA (basolateral, central and corticomedial) as
Table 3. The rabbit amygdala nuclei series according to the increasing values of the morphometric parameters
Volume NLOT BM ME BL CE CO LA
Numerical density of neurons BL BM LA CE CO NLOT ME
The total number of neurons NLOT BM BL ME CE LA CO
The length of neurons I ME NLOT CO CE BM LA BL
The width of neurons I NLOT ME CO CE BM LA BL
The size of neurons I ME NLOT CO CE BM LA BL
The shape of neurons LA I BL BM CE ME CO NLOT
Min. Max.
drawn up for the common shrew [32], guinea pig [33] and rabbit (present results) indicate the substantial similarity in the size of the basolater-al and corticomedibasolater-al regions in the last two spe-cies. For example, the volumes of BLC in the com-mon shrew, guinea pig and rabbit are 38.66%, 53.06% and 49.8% respectively. The percentag-es of CMC emphasise this similarity even more (43.37%, 32.81% and 32.25% respectively). In conclusion it may be noted that BLC in the guin-ea pig and rabbit shows marked progression in comparison with that region in the common shrew. In contrast, CMC, which was well devel-oped in the common shrew, was seen to be sub-stantially reduced in the guinea pig and rabbit. Since BLC is closely related functionally to the neo-cortex [4, 15, 25, 28, 37], it should be more prom-inent in those animals, such as the guinea pig and rabbit, in which the neocortex is better de-veloped [14]. On the other hand, CMC, which is closely related to olfaction [12, 13, 15, 25, 28, 37], should be especially prominent in the species with a well developed olfactory system. The common shrew, with a poorly developed neocortex [14], a vast olfactory system [35] and a large CMC is the best example.
2. The volumetric comparisons of the individual CA nuclei in the common shrew [32), guinea pig [33] and rabbit (present results) point up even more strongly the similarity in organisation of CA in the last two. For example, the percentages for LA vol-ume in CA of the common shrew, guinea pig and rabbit are 10.78%, 27.9% and 24.09% respective-ly. When BM is compared they are 7.25%, 9.23% and 9.68% respectively. In the case of NLOT the respective volumetric percentages are 9.22%, 2.57% and 2.51%. It is worth mentioning that LA, which is the major recipient region for the senso-ry-related thalamic and cortical inputs directed to CA [15, 25, 28, 37], shows the most marked pro-gression in the guinea pig and rabbit. On the oth-er hand, NLOT, which is especially closely related to the olfactory system [1, 35, 36], displays the largest reduction. These tendencies (a great pro-gression of LA and strong repro-gression of NLOT) are most manifest in primates [35, 36].
3. The extreme enlargement of BLC in the rabbit (present results) and guinea pig CA [33], when compared to that region in the common shrew [32], follows according to LA and BM size pro-gression, since BL is notably reduced in both these species. On the other hand, the decline of CMC
in the rabbit and guinea pig CA is caused first of all by the strong regression of NLOT (compare the present results) [32, 33].
In spite of the remarkable similarity in the organisa-tion of CA in the rabbit and guinea pig [33], there are also some differences. These include the following: 1. The relative size of CC in the rabbit CA is
some-what more similar to that found in the com-mon shrew [32) than that in the guinea pig [33]. The volumetric values of CC in all three species studied are 17.97%, 17.96% and 14.13% re-spectively.
2. The LA in the rabbit, however, while much larg-er than that in the common shrew [32], is less developed in comparison with LA in the guinea pig [33].
3. The ME in the rabbit shows further reduction when compared with the ME in the common shrew [32] and guinea pig [33].
When the volumetric similarities and differences in CA of the common shrew [32], guinea pig [33] and rabbit are taken into account, it is reasonable to state that the pattern of CA in the rabbit is much more similar to that in the guinea pig than that of the common shrew. However, with the reduced LA and very large CE, the rabbit CA seems to be more primitive than that of the guinea pig [33]. Since the rabbit and guinea pig CA are very similar and the guinea pig CA has been discussed extensively in re-lation to various mammals [4, 9, 26, 34, 35, 36, 38] in our previous paper in this series [33], it would not seem necessary to compare the rabbit CA with CA of these species in this report.
Numerical density
In the rabbit and common shrew CA, for example, the nuclei seriate, according to the increasing values of the density of cells, both display the following ar-rangement: BL, BM, LA, CE, CO, NLOT, ME (compare present results) [32]. In the guinea pig [33] this ar-rangement is only slightly different (BL, BM, LA, CE, CO, ME, NLOT). Moreover, in all the three species LA, BL and BM form cellular regions in CA characterised by density values significantly lower than the mean density of cells in CA. In contrast, ME and NLOT rep-resent densely organised CA areas, where the densi-ties of neurons are significantly higher than the mean. The densities of cells in CE and CO in CA of the rabbit, guinea pig and common shrew lie between those of the two previously mentioned regions.
Total number of neurons
In spite of the substantial reduction in density in the neurons of the rabbit CA, the total number of cells in it is significantly higher than in the common shrew [32] and guinea pig [33]. The average size of the cellular population in the rabbit CA is about 1.4 times larger than that in CA of the guinea pig [33] and as much as 7.3 times larger than that in CA of the common shrew [32]. However, the neuronal population size increases differ significantly in the individual CA nuclei, as shown by the percentages of cells in each in relation to the total CA. The com-parisons of these percentages in the rabbit CA with those in the guinea pig [33] display differences rath-er than similarities in CA organisation in the two these species. The following are examples of these: 1. The percentage of BLC neurons in the rabbit CA
is 34.77%, while in the guinea pig [33] this value is higher, reaching as much as 40.73%. It should be noted that the neuronal population size seems to be reduced in BLC of the rabbit, while the dif-ference in BLC volume was not statistically sig-nificant in either species.
2. The same situation can be found when the indi-vidual BLC nuclei are compared. For example, the percentages of BL neurons in CA of the rabbit (present results) and guinea pig [33] are 7.38% and 8.93% respectively. Interestingly, the volume of BL in the rabbit was greater than in the guinea pig [33]. The BM, which was almost identical in the two species in volumetric size, shows signs of regression in the rabbit CA when the total numbers of neurons are compared.
3. The alteration in population size in CO is a fur-ther interesting example of differences in CA of the rabbit and guinea pig [33]. The total number
of neurons in CO of the rabbit shows great de-velopment when compared with that of the guin-ea pig [33]. It is noteworthy that CO volumes were similar in both these species.
In conclusion, CA in the rabbit, although much better developed than in the common shrew [32], shows some signs of regression when compared to that structure in the guinea pig [33]. The best con-firmation of this may be the clear reduction in pop-ulation size in BLC of the rabbit and its marked de-velopment in CO of this species.
Neuronal structure
In all the nuclei of the rabbit CA the average siz-es of the neurons are significantly greater than in the homologous regions of the common shrew [32] and guinea pig CA [33]. The size of the average neu-ron in the common shrew, guinea pig and rabbit CA is 18.78 µm, 24.1 µm and 26.17 µm respectively. All these differences in neuronal size are statistically sig-nificant (p < 0.05). A positive correlation between the size of the brain structure and the size of the neurons in it was referred to by Morgane et al. [27] but this has never been verified statistically. On the other hand Kowiańska [14] could find no similar cor-relation in comparative studies of the neuronal struc-ture in the claustrum of mammals. In spite of pro-gression in size, the distribution of neurons accord-ing to size in the rabbit CA is very similar to that described in the common shrew [32] and in the guin-ea pig [33]. In all three species the large neurons in CA occupy less densely populated nuclei such as LA, BL and BM, whereas the smallest cells make up ME and NLOT, where the neurons are densely arranged. The CE and CO are populated by the medium-sized cells and the packing densities in both these struc-tures lie between the previously mentioned regions. It should be noted that the negative correlation be-tween the size of the neurons in the amygdaloid nuclei studied and their packing densities in these regions was described previously for the common shrew [32] and guinea pig CA [33]. This feature also seems to be also present in the rabbit CA.
Functional remarks
When all the characteristic features of the rabbit CA are taken into consideration, the question arises as to the functional consequences when CA is orga-nised as found in the rabbit.
It appears to be the major site of convergence for all the non-olfactory sensory modalities, namely the vi-sual [19, 24], auditory [16, 18, 19, 23, 31] and so-matosensory [17, 19, 39]. The BM, which also has close interconnections with the sense-related tha-lamic and cortical areas [3, 17, 28], seems to be asso-ciated more with contextual information [19, 21, 22]. Since, as in the guinea pig [33], LA and BM in the rabbit are much better developed than in the com-mon shrew [32], it is reasonable to state that non-olfactory information processed by the cortex be-comes more widely represented inside CA of this species. This may suggest that CA of the rabbit is probably less influenced by olfaction than that of the shrew [32]. This does not seem to be the case. Since ME and, especially, CO, that include the sec-ondary olfactory and vomeronasal areas [12, 13, 37], showed only a small reduction in size in the rabbit CA in comparison with that of the common shrew [32], it would seem that olfaction is still very impor-tant in CA of this species. Moreover, the strong rep-resentation of CO in the rabbit CA, in conjunction with the slight regression of LA in relation to the guinea pig [33], suggests that olfaction in the rabbit is even more important than in the guinea pig CA.
In summary, the data for the common shrew [32], guinea pig [33] and rabbit (present report), when compared, demonstrate that the nuclear pattern and distribution of neurons according to size and densi-ty are very similar in CA of all three species. On the other hand, when the nuclear volumes are compared, CA in the rabbit is much more similar to that of the guinea pig than that of the common shrew. The rea-son for such similarity is that LA and BM underwent a similar development in CA of the guinea pig and rab-bit, while ME and, especially, NLOT became consider-ably reduced in both species. It is worth mentioning that such results fit well with the general impression reported by Crosby and Humphrey [5] that “when the amygdala of the common shrew and human are com-pared, the lateral, basal and accessory basal nuclei occupy proportionately a much larger part of the human amygdaloid area. On the contrary the medial nucleus and nucleus of the lateral olfactory tract are relatively considerably reduced in man”.
REFERENCES
1. Breathnach AS, Goldby F (1988) The amygdaloid nuclei, hippocampus and other parts of the rhinencephalon in the porpoise (Phocaena phocaena). Anatomy, 88: 267–288. 2. Bookstein FL (1986) Size and shape spaces for
land-mark data in two dimensions. Statistical Science, 1: 181–222.
3. Canteras NS, Swanson LW (1992) Projections of the ventral subiculum to the amygdala, septum and hy-pothalamus: A PHAL anterograde track-tracing study in the rat. J Comp Neurol, 324: 180–194.
4. Crosby EC, Humphrey T (1941) Studies on the verte-brate telencephalon. II. The nuclear pattern of olfac-tory nucleus, tuberculum olfactorium and the amygda-loid complex in adult man. J Comp Neurol, 74: 309– –352.
5. Crosby EC, Humphrey T (1944) Studies on the verte-brate telencephalon. III. The amygdaloid complex in the shrew (Blarina brevicauda). J Comp Neurol, 81: 285–305.
6. Dziewiątkowski J, Berdel B, Kowiański P, Kubasik--Juraniec J, Bobek-Bilewicz B, Moryś J (1998) The amygdaloid body of the rabbit. A morphometric study using image analyser. Folia Morphol, 57: 93–103. 7. Gower JC (1975) Generalized Procrustes analysis.
Psy-chometrika, 40: 33–51.
8. Gundersen HJG, Jensen EB (1987) The efficiency of sys-tematic sampling in sterology and its prediction. J Microsc, 147, 229–263.
9. Humphrey T (1936) The telencephalon of the bat. I. The non-cortical nuclear masses and certain pertinent fiber connections. J Comp Neurol, 65: 603–711. 10. Jagalska-Majewska H, Luczynska A, Wojcik S,
Dzie-wiatkowski J, Kurlapska R, Morys J (2003) Develop-mental changes of morphology in the basolateral com-plex of the rabbit amygdala. Folia Morphol, 62: 227– 230.
11. Jagalska-Majewska H, Wojcik S, Dziewiatkowski J, Luczynska A, Kurlapska R, Morys J (2003) Postnatal development of the basolateral complex of rabbit amygdala: a stereological and histochemical study. J Anat, 203: 513–521.
12. Kevetter GA, Winans SS (1981) Connections of the corticomedial amygdala in the golden hamster. I. Ef-ferents of the “vomeronasal amygdala”. J Comp Neu-rol, 197: 81–98.
13. Kevetter GA, Winans SS (1981) Connections of the corticomedial amygdala in the golden hamster. II. Ef-ferents of the “olfactory amygdala”. J Comp Neurol, 197: 99–111.
14. Kowiańska J (1997) Anatomia porównawcza przed-murza wybranych gatunków ssaków. Akademia Me-dyczna, Gdańsk, pp. 1–107.
15. Krettek JE, Price JL (1978) A description of the amygda-loid complex in the rat and cat with observations on intra-amygdaloid axonal connections. J Comp Neurol, 178: 255–280.
16. LeDoux JE, Farb C, Ruggiero DA (1990) Topograph-ic organization of neurons in the acoustTopograph-ic thala-mus that project to the amygdala. J Neurosci, 10: 1043–1054.
17. LeDoux JE, Cicchetti P, Xagoranis A, Romanski LM (1990) The lateral amygdaloid nucleus: sensory inter-face of the amygdala in fear conditioning. J Neurosci, 10: 1062–1069.
19. LeDoux JE (2000) Emotion circuits in the brain. Annu Rev Neurosci, 23: 155–184.
20. Mayhew TM (1992) A review of recent advances in stereology for quantifying neural structures. J Neuro-cytol, 21: 313–328
21. Majidishad P, Pelli DG, LeDoux JE. (1996) Disruption of fear conditioning to contextual stimuli but not to a tone by lesions of the accessory basal nucleus of the amygdala. Soc Neurosci Abstr, 22: 1116.
22. Maren S, Fanselow MS (1995) Synaptic plasticity in the basolateral amygdala induced by hippo-campal formation stimulation in vivo. J Neurosci, 15: 7548–7564.
23. Mascagni F, McDonald AJ, Coleman JR (1993) Corti-coamygdaloid and corticocortical projections of the rat temporal cortex: a Phaseolus vulgaris leucoagglu-tinin study. Neuroscience, 57: 697–715.
24. McDonald AJ, Jackson TR (1987) Amygdaloid connec-tions with posterior insular and temporal cortical ar-eas in the rat. J Comp Neurol, 262: 59–77.
25. McDonald AJ, Mascagni F, Guo L (1996) Projections of the medial and lateral prefrontal cortices to the amygdala: A Phaselous vulgaris leucoaggulutinin study in the rat. Neuroscience, 71: 55–75.
26. Maksymowicz K (1963) Amygdaloid complex of the dog. Acta Biol Exp Vars, 23: 63–73.
27. Morgane PJ, McFarland WL, Jacobs MS (1982) The lim-bic lobe of the dolphin brain: a quantitative cytoarchi-tectonic study. J. Hirnforsch, 23: 465–552.
28. Pitkänen A, Jolkkonen E, Kemppainen S (2000) Ana-tomical heterogeneity of the rat amygdaloid complex. Folia Morphol, 59: 1–23.
29. Rohlf FJ, Slice DE (1990) Extensions of the Procrustes method for the optimal superimposition of landmarks. Systematic Zool, 39: 40–59.
30. Rohlf FJ (1999) Shape statistics: Procrustes superim-positions and tangent spaces. J Classification, 16: 197– –223.
31. Romanski LM, LeDoux JE (1993) Information cas-cade from primary auditory cortex to the amygda-la: corticocortical and corticoamygdaloid projec-tions of temporal cortex in the rat. Cereb Cortex, 3: 515–532.
32. Równiak M, Szteyn S, Robak A (2004) A morphomet-ric study of the amygdala in the common shrew. Folia Morphol, 63: 165–176.
33. Równiak M, Szteyn S, Robak A (2005) A morphomet-ric study of the amygdala in the guinea pig. Folia Mor-phol, 64: 165–176.
34. Salter CF (1975) A morphological study of the lateral olfactory areas of the telencephalon in the Mongolian Gerbil, Meriones unguiculatus. J Hirnforsh, 16: 223– –244.
35. Stephan H, Andy OJ (1977) Quantitative comparisons of the amygdala in insectivores and primates. Acta Anat, 98: 130–153
36. Stephan H, Frahm H, Baron G (1987) Comparisons of brain structure volumes in insectivora and primates. VII amygdaloid body. J Hirnforsh, 28: 571–584. 37. Swanson LW, Petrovich GD (1998) What is the
amygda-la? Trends Neurosci, 21: 323–331.
38. Śmiałowski A (1965) Amygdaloid complex of the macaque. Acta Biol Exp Vars, 25: 77–89.
39. Turner BH, Zimmer J (1984) The architecture and some of the interconnections of the rat’s amygdala and lateral periallocortex. J Comp Neurol, 227: 540– –557.