www.biogeosciences.net/10/7161/2013/ doi:10.5194/bg-10-7161-2013
© Author(s) 2013. CC Attribution 3.0 License.
Biogeosciences
Macrofaunal colonization across the Indian margin oxygen
minimum zone
L. A. Levin1, A. L. McGregor1, G. F. Mendoza1, C. Woulds2,*, P. Cross1, U. Witte3, A. J. Gooday4, G. Cowie2, and H. Kitazato5
1Center for Marine Biodiversity and Conservation and Integrative Oceanography Division, Scripps Institution of Oceanography, La Jolla, CA 92093-0218, USA
2School of Geosciences, The University of Edinburgh, Edinburgh EH9 3JW, UK 3Oceanlab, University of Aberdeen, Newburgh, Aberdeenshire AB41 6AA, UK 4National Oceanography Centre, Southampton, SO14 3ZH, UK
5Japan Agency for Marine-Earth Science and Technology, Natsushima 2-15, Yokosuka, Kanagawa 237-0061, Japan *now at: School of Geography, University of Leeds, Leeds, LS2 9JT, UK
Correspondence to: L. A. Levin ([email protected])
Received: 7 May 2013 – Published in Biogeosciences Discuss.: 13 June 2013
Revised: 26 September 2013 – Accepted: 10 October 2013 – Published: 12 November 2013
Abstract. There is a growing need to understand the ability
of bathyal assemblages to recover from disturbance and oxy-gen stress, as human activities and expanding oxyoxy-gen mini-mum zones increasingly affect deep continental margins. The effects of a pronounced oxygen minimum zone (OMZ) on slope benthic community structure have been studied on ev-ery major upwelling margin; however, little is known about the dynamics or resilience of these benthic populations. To examine the influence of oxygen and phytodetritus on short-term settlement patterns, we conducted colonization exper-iments at 3 depths on the West Indian continental margin. Four colonization trays were deployed at each depth for 4 days at 542 and 802 m (transect 1–16◦580N) and for 9 days at 817 and 1147 m (transect 2–17◦310N). Oxygen concentra-tions ranged from 0.9 µM (0.02 mL L−1)at 542 m to 22 µM (0.5 mL L−1) at 1147 m. All trays contained local defau-nated sediments; half of the trays at each depth also con-tained13C /15N-labeled phytodetritus mixed into the sedi-ments. Sediment cores were collected between 535 m and 1140 m from 2 cross-margin transects for analysis of ambi-ent (source) macrofaunal (>300 µm) densities and composi-tion. Ambient macrofaunal densities ranged from 0 ind m−2 (at 535–542 m) to 7400 ind m−2, with maximum values on both transects at 700–800 m. Macrofaunal colonizer densities ranged from 0 ind m−2at 542 m, where oxygen was lowest, to average values of 142 ind m−2at 800 m, and 3074 ind m−2
at 1147 m, where oxygen concentration was highest. These were equal to 4.3 and 151 % of the ambient community at 800 m and 1147 m, respectively. Community structure of set-tlers showed no response to the presence of phytodetritus. In-creasing depth and oxygen concentration, however, signifi-cantly influenced the community composition and abundance of colonizing macrofauna. Polychaetes constituted 92.4 % of the total colonizers, followed by crustaceans (4.2 %), mollusks (2.5 %), and echinoderms (0.8 %). The majority of colonizers were found at 1147 m; 88.5 % of these were
Capitella sp., although they were rare in the ambient
commu-nity. Colonists at 800 and 1147 m also included ampharetid, spionid, syllid, lumbrinerid, cirratulid, cossurid and sabel-lid polychaetes. Consumption of13C /15N-labeled phytode-tritus was observed for macrofaunal foraminifera (too large to be colonizers) at the 542 and 802/817 m sites, and by metazoan macrofauna mainly at the deepest, better oxy-genated sites. Calcareous foraminifera (Uvigerina,
Hoeglun-dina sp.), capitellid polychaetes and cumaceans were among
settlement on the continental slope as the world’s oxygen minimum zones expand.
1 Introduction
Oxygen minimum zones (OMZs), areas with O2 concentra-tions<0.5 mL L−1(=22 µM), blanket a significant fraction of the upper bathyal zone along the eastern Pacific, western Africa and north Indian Ocean continental margins, cover-ing over 1 million square km of seafloor (Helly and Levin, 2004). There is now recognition that as the planet warms, the oxygen content of the world ocean is declining, a phe-nomenon termed ocean deoxygenation (Keeling et al., 2010). One consequence is that the world’s oxygen minimum zones are expanding (Stramma et al., 2008, 2010) and upper OMZ boundaries are shoaling (Bograd et al., 2008; McClatchie et al., 2010). This means that increasingly larger areas of the continental margin will experience hypoxia or anoxia. Thus, understanding the influence of oxygen on benthic commu-nity structure and function will take on added significance. Information about community dynamics and resilience is also of growing importance as margin ecosystems are in-creasingly subject to direct human disturbance (Ramirez-Llodra et al., 2011). Physical disturbance from bottom trawl-ing, seabed mining (e.g., of diamonds, phosphates, sulfides, and sand), and chemical disturbance from hydrocarbon spills are current or looming sources of disturbance to bathyal margin ecosystems.
Early studies of OMZs revealed distinct global patterns in which macrofaunal assemblages were characterized by re-duced densities at the lowest oxygen levels and density max-ima in the lower OMZ transition zone (reviewed in Levin, 2003). Worldwide, OMZs exhibit a high proportion of an-nelids and low representation of echinoderms (Levin, 2003) with strong diversity shifts linked to oxygen gradients (e.g., Levin et al., 2009). Within the Indian Ocean, these patterns have been reported for the Oman (Levin et al., 2000) and Pakistan (Hughes et al., 2009; Levin et al., 2009) margins, as well as on the W. Indian margin (Ingole et al., 2010; Hunter et al., 2011, 2012) and in the Bay of Bengal (Gooday et al., 2010; A. Raman, unpubl.). In the Arabian Sea investigations, oxygen has been shown to be an important factor limiting the density, body size and taxonomic groups of macrofauna found in OMZs. At OMZ margins in both the Pacific and Indian Oceans, macrofaunal species richness exhibits a posi-tive correlation with bottom-water oxygen concentration, al-though organic carbon content exerts strong control on even-ness and dominance (Levin and Gage, 1998; Levin et al., 2009; A. Raman, personal communication, 2012).
Most studies of OMZ macrobenthos are based on sin-gle (or sometimes two) cross-margin transects that provide a static picture of community structure. They do not pro-vide information about whether the structural attributes of
OMZ assemblages described above are generated at settle-ment, nor information about species interactions and differ-ential mortality that occurs after settlement. Short-term colo-nization studies can be used to examine settlement potential and preferences as well as successional trends. This approach has been adopted frequently with fouling panels in shallow water (e.g., Pacheco et al., 2010), but is less common in the deep sea.
Deep-water colonization was originally shown to be a rel-atively slow process compared to shallow depths (Levin and Smith, 1984; Desbruyeres et al., 1985; Grassle and Morse-Porteous, 1987; Smith and Hessler, 1987). The stability of different patches in the deep sea was thought to allow for more specialization than in shallow water and to promote succession (Snelgrove et al., 1994). Longer-term (6 months to>1 yr) colonization experiments in the deep sea have been performed to determine which taxa are the most efficient colonizers in a given area and to observe the effect of vari-able food type (Grassle and Morese-Porteous, 1987), organic matter quantity and quality (Snelgrove et al., 1992, 1994, 1996; Menot et al., 2009), hydrodynamics/current and ter-rain, (Levin and DiBacco, 1995), and sulfide present in sedi-ments (Levin et al., 2006; Menot et al., 2009).
In contrast to the results of early studies, recent work indicates that macrofaunal colonization rates on productive margins or in the presence of enhanced organic matter can be rapid. In situ experiments involving deposition of 13 C-labeled phytodetritus demonstrated rapid utilization of or-ganic matter on margins (Blair et al., 1996; Levin et al., 1997, 1999; Witte et al., 2003, Aberle and Witte, 2003; Hunter et al., 2012; Pozatto et al., 2013). In the Northwest Atlantic, en-riched colonization trays exhibited higher densities than both ambient sediments and unenriched trays (Desbruyères et al., 1980). On the W. African margin, macrofaunal response to the addition of organic matter in colonization trays varied as a function of depth and location, with greater effects of organic enrichment observed at bathyal than abyssal depths (Menot et al., 2009). The type of food present also affected colo-nization. In the Atlantic, trays containing the diatom
Tha-lassiosira attracted significantly more colonists than those
containing the seaweed Sargassum (Snelgrove et al., 1992, 1994). On the Pakistan margin, consumers of phytodetritus varied as a function of oxygen regime (Woulds et al., 2007, 2009), with protists dominating phytodetritus consumption at O2concentrations below 0.1 mL L−1(4 µM) and macro-fauna dominating at slightly higher oxygen levels. Given the strong influence of oxygen on macrofaunal community struc-ture and trophic functions, we hypothesized that (1) oxygen availability should influence the rate of colonization and (2) oxygen may alter the influence of phytodetritus on coloniza-tion and the processing of phytodetritus by colonizers.
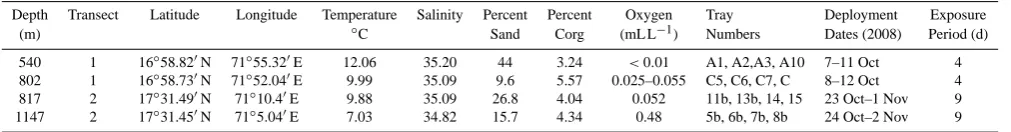
Table 1. Depth, location, physical characteristics and colonization tray deployment information for experiments conducted on the W. Indian
margin. Temperature, salinity and % POC data are taken from Hunter et al. (2012); these authors made measurements at identical study sites at the same time.
Depth Transect Latitude Longitude Temperature Salinity Percent Percent Oxygen Tray Deployment Exposure
(m) ◦C Sand Corg (mL L−1) Numbers Dates (2008) Period (d)
540 1 16◦58.820N 71◦55.320E 12.06 35.20 44 3.24 <0.01 A1, A2,A3, A10 7–11 Oct 4 802 1 16◦58.730N 71◦52.040E 9.99 35.09 9.6 5.57 0.025–0.055 C5, C6, C7, C 8–12 Oct 4 817 2 17◦31.490N 71◦10.40E 9.88 35.09 26.8 4.04 0.052 11b, 13b, 14, 15 23 Oct–1 Nov 9 1147 2 17◦31.450N 71◦5.040E 7.03 34.82 15.7 4.34 0.48 5b, 6b, 7b, 8b 24 Oct–2 Nov 9
seamounts (Levin and DiBacco, 1995), increased quantity of organic matter (Levin and Smith, 1984; Menot et al., 2009), and preferred food types (Snelgrove et al., 1992). Six-month exposures of defaunated sediments on seamount and slope habitats in the NE Pacific have shown recovery rates of 50 to 75 % of ambient densities, with most individuals belonging to taxa present in ambient cores (Levin et al., 2006; Levin and DiBacco, 1995), whereas sediment trays collected after only 7 weeks yielded densities as low as 6 % of ambient levels in coarse-grained seamount sediments (Levin and DiBacco, 1995). Colonization experiments in the low-oxygen Santa Catalina Basin also yielded assemblages containing a signifi-cant proportion of ambient fauna (Levin and Smith, 1984). In contrast, early colonization tray experiments in the Atlantic revealed abundant, opportunistic colonizers that were often rare in ambient sediments (Desbruyères et al., 1980; Grassle and Morse-Porteous, 1987; Snelgrove et al., 1992). These in-cluded capitellid, hesionid, dorvilleid, spionid, and sigalionid polychaetes, cumaceans and leptostracans.
This study examines the effects of oxygen and water depth, as well as the presence of phytodetritus on macrobenthos dis-tributions and colonization patterns across the Indian margin OMZ. It is the first to document the initial steps of recol-onization at different oxygen levels across an OMZ. Trays were deployed on the sea floor for 4 and 9 days while most other deep-water experiments left trays out for 6 months or longer. In this experiment we tested the null hypotheses for macrofauna that (1) oxygen and depth are not correlated with colonizer abundance, composition, diversity and lifestyle; and that (2) the type and abundance of animals colonizing the trays is unaffected by the presence of phytodetritus. Our alternative hypotheses were that the abundance of organisms would increase with oxygen concentration and depth, there would be a significant difference in community composition between different depths and oxygen concentrations, and that trays containing phytodetritus would support more coloniz-ers. Both macrofaunal and foraminiferal uptake of phytode-tritus was examined through the introduction of13C-labeled diatoms in a subset of colonization trays deployed across an oxygen gradient. Depending on the nature of seafloor dis-turbance, early colonists (in nature) may experience locally enhanced availability of phytodetritus (e.g., accumulating in pits) or a decrease due to removal of surficial sediments or diminished surface production. These experiments explore
both the influence of phytodetritus on the colonization pro-cess and the extent to which a “disturbance”-adapted fauna may function to process carbon. We also examined the den-sity and composition of macrofauna in ambient sediments along two cross-margin transects to better understand the source assemblages available to colonize the trays.
2 Methods
2.1 Field conditions
Studies were conducted on the Indian margin in October and November 2008 aboard the RV Yokosuka with the sub-mersible Shinkai 6500. Site characteristics are presented in Table 1 and reviewed in Hunter et al. (2011; 2012). Salin-ity and temperature data were obtained with a Seabird SBE 19 CTD. Temperature near the seabed ranged from 7.03 to 12.06◦C and salinity near the seabed ranged from 34.82 to 35.20. Oxygen concentrations were measured with an Aan-deraa Optode 3830 mounted on the Shinkai 6500; calibra-tion procedures are described in Hunter et al. (2011). Oxy-gen ranged from 0.35 µM at 530 m to 21.1 µM at 1147 m (see Table 1). Sediments were coarsest (44.5 % sand) with lowest organic C content (3.24 %) at the 542 m (transect 1) site and finest (9.6 % sand) with highest organic C content (5.71 %) at 802 m on transect 1. The 817 and 1147 m sites on transect 2 had sand content (26.8 and 15.7 %) and organic C content (4.04–4.35) that were intermediate between those of the tran-sect 1 sites.
In the study region megafauna and macrofauna are rare at 500–600 m where oxygen concentration is lowest. Megafauna (animals visible in video imagery) exhibit maxi-mum densities at 800 m and decline at greater depths; how-ever, mega-infauna and lebensspuren are common only be-low 1100 m on both transects (Hunter et al., 2011, 2012).
2.2 Colonization experiments
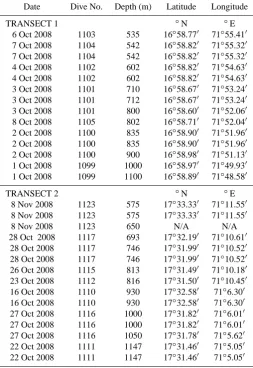
Table 2. Date, dive number, depth and location of background sediment cores collected for macrofaunal analysis. Each row reflects
a single core.
Date Dive No. Depth (m) Latitude Longitude
TRANSECT 1 ◦N ◦E
6 Oct 2008 1103 535 16◦58.770 71◦55.410 7 Oct 2008 1104 542 16◦58.820 71◦55.320 7 Oct 2008 1104 542 16◦58.820 71◦55.320 4 Oct 2008 1102 602 16◦58.820 71◦54.630 4 Oct 2008 1102 602 16◦58.820 71◦54.630 3 Oct 2008 1101 710 16◦58.670 71◦53.240 3 Oct 2008 1101 712 16◦58.670 71◦53.240 3 Oct 2008 1101 800 16◦58.600 71◦52.060 8 Oct 2008 1105 802 16◦58.710 71◦52.040 2 Oct 2008 1100 835 16◦58.900 71◦51.960 2 Oct 2008 1100 835 16◦58.900 71◦51.960 2 Oct 2008 1100 900 16◦58.980 71◦51.130 1 Oct 2008 1099 1000 16◦58.970 71◦49.930 1 Oct 2008 1099 1100 16◦58.890 71◦48.580
TRANSECT 2 ◦N ◦E
8 Nov 2008 1123 575 17◦33.330 71◦11.550 8 Nov 2008 1123 575 17◦33.330 71◦11.550
8 Nov 2008 1123 650 N/A N/A
28 Oct 2008 1117 693 17◦32.190 71◦10.610 28 Oct 2008 1117 746 17◦31.990 71◦10.520 28 Oct 2008 1117 746 17◦31.990 71◦10.520 26 Oct 2008 1115 813 17◦31.490 71◦10.180 23 Oct 2008 1112 816 17◦31.500 71◦10.450 16 Oct 2008 1110 930 17◦32.580 71◦6.300 16 Oct 2008 1110 930 17◦32.580 71◦6.300 27 Oct 2008 1116 1000 17◦31.820 71◦6.010 27 Oct 2008 1116 1000 17◦31.820 71◦6.010 27 Oct 2008 1116 1050 17◦31.780 71◦5.620 22 Oct 2008 1111 1147 17◦31.460 71◦5.050 22 Oct 2008 1111 1147 17◦31.460 71◦5.050
24 October to 2 November at 817 m (Table 1). The coloniza-tion trays consisted of an 11.1 cm diameter central cup (9 cm deep) lined with 20 µm mesh, surrounded by a flat delrin ny-lon collar 40 cm in diameter. The design of the cony-lonization trays is described by Levin and DiBacco (1995) and is iden-tical to those used by Snelgrove et al. (1992, 1994, 1996) in the Atlantic Ocean and Levin et al. (2006, 2013) in the Pacific Ocean. The broad collar is designed to reduce turbu-lent flow over the central cup and prevent scour. Trays were nestled into sediments such that the sediment surface of the cup and the collar were flush with the surrounding sediment. Trays were covered with water-tight lids during deployment and recovery to prevent loss of sediment.
Among the 4 colonization trays deployed at each depth, two each received additions of freeze-dried phytodetritus, made from the diatom Thalassiosira weissflogii labeled with 13C and15N (see Hunter et al., 2012 for preparation details); the other two had no algae added. In preparing the coloniza-tion trays, sediments were collected from the study sites by
scoop and stored on board ship at −80 to−20◦C for 1–3 days. They were then thawed on deck at 30◦C and sonicated for 5 min to destroy foraminifera and metazoans. Algae were mixed in 50 cc tubes with∼50 cc of mud and spread on the tray surface immediately before deployment in a 0.25 mm thick surface layer. The trays contained additions equivalent to∼500 mg C m−2, roughly the C input for a single year at the 500 m site. These doses were similar to those used in ex-periments on the Pakistan margin (e.g., Woulds et al., 2007) and reflect the pulsed nature of natural organic matter deliv-ery in the Arabian Sea. Sediment-filled trays were recovered and the cup contents were sectioned vertically at 0–1, 1–2, 2–3, and 3–5 cm. All samples were preserved in 8 % buffered formalin.
2.3 Ambient faunal collection
Fig. 1. Location of transects 1 and 2 with colonization trays (red
tri-angles) and ambient cores (green circles) on the W. Indian margin.
Shinkai 6500 (Table 2). Samples from transect 1 (16◦580N, 71◦550E) were collected roughly 100 km southeast of tran-sect 2 (17◦310N, 71◦100E) (Fig. 1). Pairs of cores were taken by the Shinkai 6500 at a range of depths between 500 and 1150 m (Table 2). Tube core sediments were sectioned ver-tically on board ship at 0–1, 1–2, 2–3, 3–5, and 5–10 cm in-tervals and fauna were preserved in 8 % buffered formalin. All fractions were sieved in the laboratory through a 300 µm mesh and macrofauna were removed from retained sediments under a dissecting microscope. Animals were counted and identified to the lowest taxon possible.
2.4 Shipboard and laboratory analyses
The upper fractions were sieved in the laboratory through a 300 µm mesh to separate out macrofauna and through a 45 µm mesh to retain smaller organisms for later meiofaunal studies. Macrofauna were sorted under a binocular micro-scope, counted, and identified to the lowest taxon possible. Colonization tray samples were sorted to consecutive 1 cm depth fractions until no more animals were present. All trays from transect 1 and the 800 m trays from transect 2 were thus sorted to only 2 cm, as no animals were present below 1 cm. The 1147 m trays from transect 2 were sorted to 3 cm (2 trays) and 5 cm (2 trays.) Stable isotope analysis was per-formed on the organisms found in trays containing labeled algae to determine which taxa consumed phytodetritus.
2.5 Statistical testing
[image:5.595.47.289.62.252.2]Multivariate community analysis was performed using Primer software V. 6. Bray–Curtis similarity indices were used to create similarity matrices from untransformed fam-ily abundance values. Differences in community composition
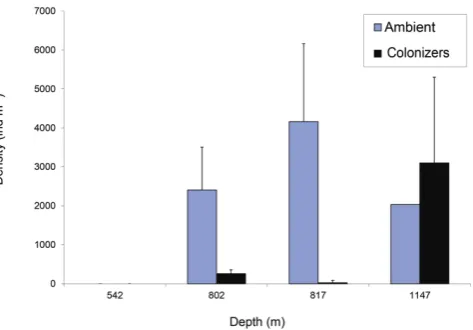
Fig. 2. Comparison of metazoan macrofaunal ambient and colonizer
average density (±1 SD) on the W. Indian margin. See Table 1 for tray deployment periods and locations.
are presented in MDS plots. ANOSIM and SIMPER were used to measure sources and statistical significance of the dif-ferences in community composition between colonizer and ambient communities, colonizers at higher vs. lower oxygen concentration, and colonizers of trays with and without la-beled phytodetritus. The differences between the proportion of polychaetes and densities between colonizer and ambient fauna at a given depth were measured by performing one tailedttests using JMP software.
2.6 Stable isotope analyses
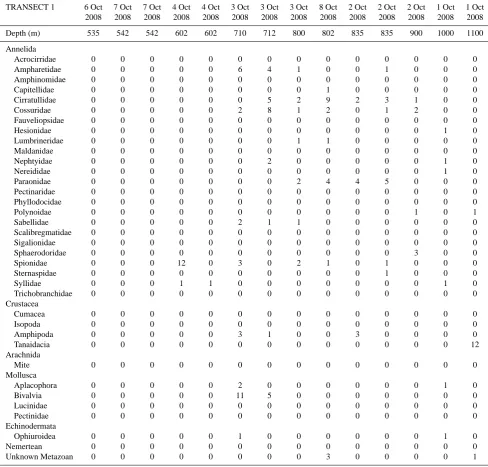
Table 3a. Background macrofaunal densities (no. per 8.3 cm diameter core), transect 1 (see Table 1 for locations).
TRANSECT 1 6 Oct 7 Oct 7 Oct 4 Oct 4 Oct 3 Oct 3 Oct 3 Oct 8 Oct 2 Oct 2 Oct 2 Oct 1 Oct 1 Oct
2008 2008 2008 2008 2008 2008 2008 2008 2008 2008 2008 2008 2008 2008
Depth (m) 535 542 542 602 602 710 712 800 802 835 835 900 1000 1100
Annelida
Acrocirridae 0 0 0 0 0 0 0 0 0 0 0 0 0 0
Ampharetidae 0 0 0 0 0 6 4 1 0 0 1 0 0 0
Amphinomidae 0 0 0 0 0 0 0 0 0 0 0 0 0 0
Capitellidae 0 0 0 0 0 0 0 0 1 0 0 0 0 0
Cirratullidae 0 0 0 0 0 0 5 2 9 2 3 1 0 0
Cossuridae 0 0 0 0 0 2 8 1 2 0 1 2 0 0
Fauveliopsidae 0 0 0 0 0 0 0 0 0 0 0 0 0 0
Hesionidae 0 0 0 0 0 0 0 0 0 0 0 0 1 0
Lumbrineridae 0 0 0 0 0 0 0 1 1 0 0 0 0 0
Maldanidae 0 0 0 0 0 0 0 0 0 0 0 0 0 0
Nephtyidae 0 0 0 0 0 0 2 0 0 0 0 0 1 0
Nereididae 0 0 0 0 0 0 0 0 0 0 0 0 1 0
Paraonidae 0 0 0 0 0 0 0 2 4 4 5 0 0 0
Pectinaridae 0 0 0 0 0 0 0 0 0 0 0 0 0 0
Phyllodocidae 0 0 0 0 0 0 0 0 0 0 0 0 0 0
Polynoidae 0 0 0 0 0 0 0 0 0 0 0 1 0 1
Sabellidae 0 0 0 0 0 2 1 1 0 0 0 0 0 0
Scalibregmatidae 0 0 0 0 0 0 0 0 0 0 0 0 0 0
Sigalionidae 0 0 0 0 0 0 0 0 0 0 0 0 0 0
Sphaerodoridae 0 0 0 0 0 0 0 0 0 0 0 3 0 0
Spionidae 0 0 0 12 0 3 0 2 1 0 1 0 0 0
Sternaspidae 0 0 0 0 0 0 0 0 0 0 1 0 0 0
Syllidae 0 0 0 1 1 0 0 0 0 0 0 0 1 0
Trichobranchidae 0 0 0 0 0 0 0 0 0 0 0 0 0 0
Crustacea
Cumacea 0 0 0 0 0 0 0 0 0 0 0 0 0 0
Isopoda 0 0 0 0 0 0 0 0 0 0 0 0 0 0
Amphipoda 0 0 0 0 0 3 1 0 0 3 0 0 0 0
Tanaidacia 0 0 0 0 0 0 0 0 0 0 0 0 0 12
Arachnida
Mite 0 0 0 0 0 0 0 0 0 0 0 0 0 0
Mollusca
Aplacophora 0 0 0 0 0 2 0 0 0 0 0 0 1 0
Bivalvia 0 0 0 0 0 11 5 0 0 0 0 0 0 0
Lucinidae 0 0 0 0 0 0 0 0 0 0 0 0 0 0
Pectinidae 0 0 0 0 0 0 0 0 0 0 0 0 0 0
Echinodermata
Ophiuroidea 0 0 0 0 0 1 0 0 0 0 0 0 1 0
Nemertean 0 0 0 0 0 0 0 0 0 0 0 0 0 0
Unknown Metazoan 0 0 0 0 0 0 0 0 3 0 0 0 0 1
3 Results
3.1 Colonizer and ambient densities
Rates of macrofaunal colonization were greater where oxy-gen was higher on both transects. On transect 1 after 4 days exposure, no metazoan macrofaunal individuals were found in trays at 542 m depth; this is consistent with the absence of metazoan macrofauna at a comparable depth in ambi-ent sedimambi-ents (Figs. 2, 3). Average colonizer density was 258.3 ind m−2 at 802 m on transect 1 after 4 days and an order of magnitude lower (25.8 ind m−2) at 817 m on
Table 3b. Background macrofaunal densities (no. per 8.3 cm diameter core), transect 2 (see Table 1 for locations).
TRANSECT 2 8 Nov 8 Nov 8 Nov 28 Oct 28 Oct 28 Oct 26 Oct 23 Oct 16 Oct 16 Oct 27 Oct 27 Oct 27 Oct 22 Oct 22 Oct 2008 2008 2008 2008 2008 2008 2008 2008 2008 2008 2008 2008 2008 2008 2008
Depth (m) 575 575 650 693 746 746 800 816 930 930 1000 1000 1050 1147 1147
Annelida
Acrocirridae 0 0 0 1 0 0 0 0 0 0 0 0 0 0 0
Ampharetidae 0 0 12 8 0 1 2 2 0 0 0 0 0 0 0
Amphinomidae 0 1 1 0 0 0 0 0 0 0 0 0 0 0 0
Capitellidae 0 0 0 0 0 0 0 0 1 1 0 0 0 0 0
Cirratullidae 0 0 1 1 2 4 5 3 0 0 0 0 0 0 0
Cossuridae 0 0 0 0 0 0 2 0 0 0 0 0 0 0 1
Fauveliopsidae 0 0 0 3 0 0 2 0 1 0 0 0 0 0 0
Hesionidae 0 0 0 2 0 0 0 0 0 0 0 0 0 0 0
Lumbrineridae 0 0 0 0 0 0 0 0 0 0 1 0 0 0 0
Maldanidae 0 0 0 0 0 0 1 0 2 0 0 0 0 0 0
Nephtyidae 0 0 0 0 0 0 0 0 0 0 0 0 0 1 0
Nereididae 0 0 0 0 0 0 0 1 0 0 0 0 0 0 0
Paraonidae 0 0 0 0 0 0 2 3 0 0 0 1 0 0 3
Pectinaridae 0 0 0 0 2 0 0 0 0 0 0 0 0 0 0
Phyllodocidae 0 0 0 0 0 0 0 0 0 1 0 0 0 0 0
Polynoidae 0 0 0 1 0 0 0 0 0 0 0 0 0 0 0
Sabellidae 0 0 2 2 1 1 1 0 1 0 1 0 0 0 1
Scalibregmatidae 0 0 0 1 0 0 0 0 0 0 0 0 0 0 0
Sigalionidae 0 0 0 0 0 0 0 0 0 0 0 0 0 0 1
Sphaerodoridae 0 0 0 0 0 0 0 0 0 0 0 0 0 0 0
Spionidae 5 3 4 0 0 0 0 0 0 1 2 1 1 0 1
Sternaspidae 0 0 0 0 0 0 0 0 0 0 0 0 0 0 0
Syllidae 1 2 0 6 0 0 0 0 1 0 0 2 0 4 0
Trichobranchidae 0 0 0 2 0 0 0 0 0 0 0 1 0 0 0
Crustacea
Cumacean 0 0 0 0 0 0 0 0 1 0 0 0 0 0 0
Isopod 0 0 0 0 0 0 0 0 0 0 0 0 0 1 0
Amphipoda 0 0 0 1 0 0 2 2 0 0 0 0 1 2 0
Tanaid 0 0 0 0 0 0 0 0 1 0 0 0 0 2 0
Ampeliscid 0 0 0 2 2 1 0 1 0 0 0 0 0 0 0
Stenothoidae 0 0 0 0 0 0 1 0 0 0 0 0 0 0 0
Phoxocephalidae 0 0 0 0 0 0 0 0 0 0 0 0 0 0 2
Arachnida 0 0 0 0 0 0 0 0 0 0 0 0 0 0 0
Mite 0 0 1 0 0 0 0 0 0 0 0 0 0 0 1
Mollusca
Aplacophora 0 0 0 1 0 0 0 0 0 0 0 0 0 0 0
Bivalvia 0 0 0 0 0 3 10 0 0 1 0 1 0 0 1
Lucinidae 0 0 0 5 0 0 0 0 0 0 0 0 0 0 0
Pectinidae 0 0 0 1 0 0 0 0 0 0 0 0 0 0 0
Echinodermata
Ophiuroidea 0 0 0 3 0 0 2 2 0 0 0 0 0 0 0
Nemertean 0 0 0 0 0 0 1 0 0 0 0 0 0 0 0
Unknown Metazoan 0 0 0 0 0 1 0 0 0 0 2 0 0 1 0
declined with fairly constant low levels from 900–1050 m (ind m−2)(Fig. 3). Ambient metazoan macrofaunal densities at the colonization tray depths were 2405±506 ind m−2at 800–835 m on transect 1, 4163±1572 ind m−2at 800–816 m on transect 2 and 2035±0 ind m−2at 1147 m on transect 2. General density trends with depth across the two transects were similar (Fig. 3).
3.2 Colonizer and ambient composition
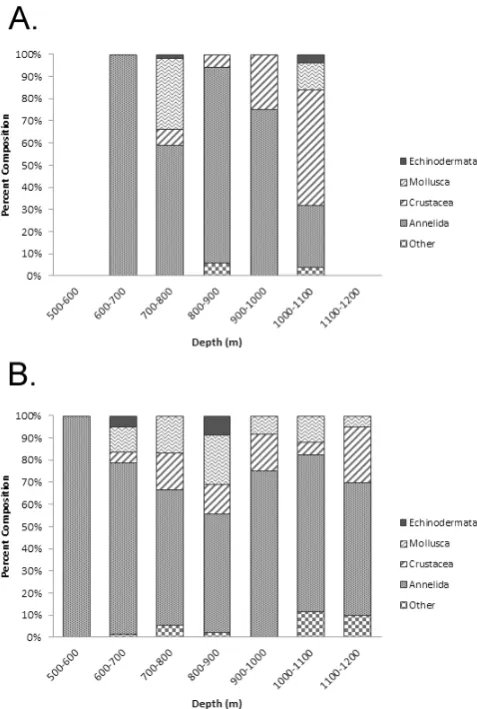
Polychaetes were the dominant taxon in ambient sediments at all depths from 575 to 1150 m (Table 3). They comprised 100 % of the fauna at 575 m and declined in proportion to only 50 % at 800–900 m, where Mollusca, Crustacea and Echinodermata became abundant (Fig. 4).
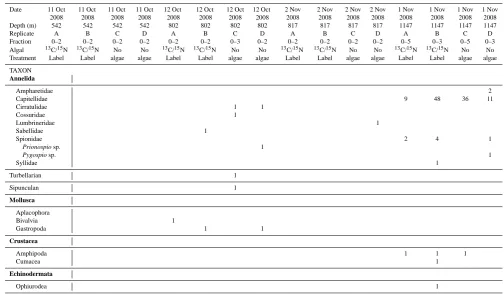
Polychaetes comprised the majority (93.8 %) of the 151 colonizers documented in this study (Table 4). The remain-ing colonizers were mollusks (2.3 %), crustaceans (3.1 %), echinoderms (0.8 % ) and a single turbellarian and sipuncu-lan (Table 3) . Of the colonizing polychaetes, 85 % were in the family Capitellidae; all of these were found at 1147 m. This family of polychaetes was not collected from ambi-ent sedimambi-ents at 1147 m, but was presambi-ent at low densities (103.3 ind m−2)in ambient sediments at 802 m on transect 1 and at 930 m on transect 2.
Table 4. Macrofauna colonizing sediment trays deployed on the W. Indian margin.
Date 11 Oct 11 Oct 11 Oct 11 Oct 12 Oct 12 Oct 12 Oct 12 Oct 2 Nov 2 Nov 2 Nov 2 Nov 1 Nov 1 Nov 1 Nov 1 Nov
2008 2008 2008 2008 2008 2008 2008 2008 2008 2008 2008 2008 2008 2008 2008 2008
Depth (m) 542 542 542 542 802 802 802 802 817 817 817 817 1147 1147 1147 1147
Replicate A B C D A B C D A B C D A B C D
Fraction 0–2 0–2 0–2 0–2 0–2 0–2 0–3 0–2 0–2 0–2 0–2 0–2 0–5 0–3 0–5 0–3
Algal 13C/15N 13C/15N No No 13C/15N 13C/15N No No 13C/15N 13C/15N No No 13C/15N 13C/15N No No Treatment Label Label algae algae Label Label algae algae Label Label algae algae Label Label algae algae
TAXON
Annelida
Ampharetidae 2
Capitellidae 9 48 36 11
Cirratulidae 1 1
Cossuridae 1
Lumbrineridae 1
Sabellidae 1
Spionidae 2 4 1
Prionospio sp. 1
Pygospio sp. 1
Syllidae 1
Turbellarian 1
Sipunculan 1
Mollusca
Aplacophora
Bivalvia 1
Gastropoda 1 1
Crustacea
Amphipoda 1 1 1
Cumacea 1
Echinodermata
Ophiurodea 1
individuals that had taken up labeled13C and15N were pre-sumably alive. No macrofauna were recovered in trays or sediments at 542 m (Table 3).
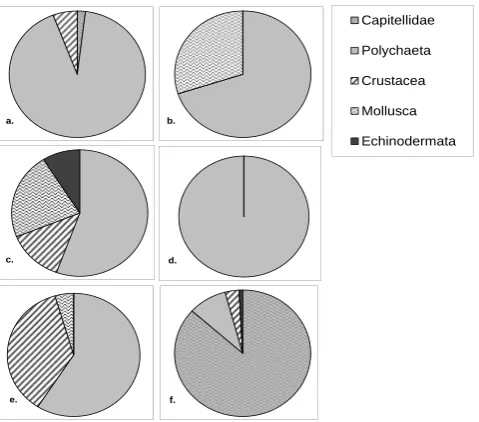
Colonizers at 802–817 m exhibited extremely low densi-ties and diversidensi-ties in this experiment. Of the 10 macrofaunal animals present in the 802 m colonization trays on transect 1, five were polychaetes, one was a turbellarian, one a sipuncu-lan and the other three were mollusks (Fig. 5b; Table 4). Two of the polychaetes in these four trays were cirratulids. The other three polychaetes at this site each represented a differ-ent family. Only a single polychaete specimen was presdiffer-ent in the 817 m colonization trays on transect 2 (Table 4). Thus, in total, seven polychaete families, most represented by a single individual, were represented in the eight 800 m trays; none of these was found in sediment trays at 1147 m (Fig. 6). In ambient sediments at 800–835 m, polychaetes (55.6 %), mollusks (22.2 %), crustaceans (13.3 %), and echinoderms (8.9 %) were all well represented (Fig. 5c).
Over 95 % of the 120 individuals colonizing sediment trays at 1147 m were polychaetes. Although the proportion of polychaetes was higher than in the ambient sediments (59 %), densities were not significantly greater (P =0.115) (Fig. 4). Of the colonizing polychaetes at this depth, Capitel-lidae accounted for 90.4 % (Fig. 6). Also present were Spi-onidae (7 %), Ampharetidae (1.7 %), and Syllidae (0.9 %). Most of the polychaete families found in colonization trays were also present in ambient sediments at this depth;
Capitella was a notable exception. Ambient sediments at
1147 m contained 36.4 % crustaceans, compared to only 3.33 % crustaceans in colonization trays (Fig. 5).
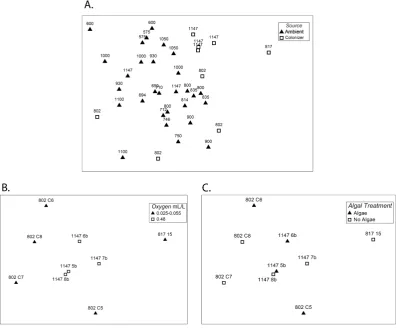
Multidimensional scaling analysis of tray colonizers re-vealed a significant difference in community composition be-tween colonizers at the sites with lower oxygen (802/817 m) and those where oxygen was higher (1147 m site). (ANOSIM R=0.50;P =0.024) (Fig. 7b); Because the same result is obtained with a presence/absence analysis (ANOSIMR= 0.347;P =0.04), we can attribute this different to composi-tion rather than density effects. There was a significant dif-ference in composition between colonization tray and ambi-ent fauna (Fig. 7a), based on both faunal counts (R=0.263: P =0.002) and presence/absence (R=0.148,P =0.038).
Fig. 3. Metazoan macrofaunal densities in ambient core samples
(54 cm2×10 cm deep) along two transects across the W. Indian margin.
3.3 Phytodetritus effects
The presence of 13C-labeled phytodetritus did not appear to influence the density, composition, or species richness of macrofaunal colonizers (Table 4, Fig. 8a, b; ANOSIM based on presence/absenceR= −0.06 P =0.698). At 802 m on transect 1, faunal density in trays without labeled phytode-tritus was double that of trays with labeled phytodephytode-tritus, however, at 817 m on transect 2, the single colonizer entered a tray with no labeled phytodetritus. At 1147 m on transect 2, trays with labeled phytodetritus exhibited a density 1.3 times that of trays without phytodetritus (Fig. 8a). In all in-stances sample size (n=2 per treatment at each depth) was too small to evaluate the significance of phytodetritus pres-ence. Notably, Capitella sp. did not respond positively to the phytodetritus.
[image:9.595.47.290.65.211.2]Two of the three animals found in trays with labeled phy-todetritus at 802 m on transect 1 were mollusks and one was a polychaete. These numbers compare with four polychaetes, one turbellarian, one sipunculan and one gastropod in the two trays without added algae. At 1147 m, polychaetes rep-resented 94.1 % (n=68) of the fauna in trays with labeled phytodetritus and 98.1 % (n=52) in trays without labeled phytodetritus. Crustaceans comprised 4.4 % and 1.9 % of col-onizers in trays with and without labeled phytodetritus, re-spectively (Table 4, Fig. 8b). Trays with phytodetritus col-lected fewer species than trays without phytodetritus at 802– 817 m (3 vs. 7 species) but had similar richness at 1147 m (6 vs. 5 species) (Table 4). There were no significant differences in species richness between trays with and without phytode-tritus but sample sizes were small. Notably, cumaceans and ophiuroids appeared only at the deepest station, in trays with phytodetritus.
Fig. 4. Metazoan macrofaunal composition in ambient sediments
sampled across the W. Indian margin along transect 1 (A) and tran-sect 2 (B).
3.4 Phytodetritus ingestion by colonizers
The stable isotope signature of the phytodetritus added to colonization trays was δ13C=50 626 ‰ and δ15N=57 190 ‰. Although no metazoan macrofauna colonized trays with algae at 542 m, several species of calcareous foraminifera, which were too large to have been colonizers, appeared to have consumed labeled phytodetri-tus in colonization trays at this depth (Table 5). Greatest uptake at 542 m was by Hoeglundina sp. (δ13C= −11.6 ‰, δ15N=712 ‰; n=1) and Uvigerina sp. (δ13C= −13.5 ‰ and δ15N=368; n=3), with little evidence of phy-todetritus uptake by Lenticularia sp. (δ13C= −8.1 ‰, δ15N= −1.44 ‰; n=2) (Fig. 9a). However, Lenticularia sp. and several other taxa, including Hoeglundina sp.,
Chilostomella, and/or Globobulimina and an unidentified
b. a.
d. c.
f. e.
b.
Capitellidae
Polychaeta
Crustacea
Mollusca
Echinodermata
Fig. 5. Composition of higher macrofaunal taxa in ambient and
col-onization trays on the W. Indian margin. (a) Ambient fauna at 800 to 835 m on transect 1; (b) colonizers at 802 m on transect 1; (c) am-bient fauna at 800 to 814 m on transect 2; (d) colonizers at 817 m on transect 2; (e) ambient fauna at 1148 m on transect 2; and (f) colonizers at 1147 m on transect 2.
For metazoan macrofauna colonizing trays with la-beled algae, the consumption of lala-beled phytodetritus and thus the departure from ambient isotopic signatures was greater at 1147 m than at the 802 m station (Table 5; Fig. 9B). The mean (+1 SE) isotopic signatures of ambi-ent macrofauna at 802 m wasδ13C= −18.98+2.87 ‰ and δ15N=7.1+4.1 ‰. In 802 m trays without phytodetritus, the mean isotopic signature of colonizers was−23.4+0.9 ‰ and 4.0+1.3 ‰ for δ13C and δ15N, respectively. In trays with phytodetritus, the respective macrofaunal signatures wereδ13C= −21.0±4.2 ‰ and δ15N=5.6±0.65 ‰. The 802 m trays with algae only had a gastropod and sabellid polychaete; these did not appear to take up any algae (Ta-ble 5). The one specimen colonizing at 817 m was not as-sayed for stable isotopes. Of the colonizers examined from 1147 m trays, 89 % hadδ15N above ambient levels and 44 % hadδ13C above ambient levels (Table 5). Mean isotopic sig-natures of colonizers at 1147 m wereδ13C=980.3±1845.5 and δ15N=1439.4±3382.7 for trays containing labeled phytodetritus, andδ13C= −22.4±1.3 andδ15N=8.8±2.6 for trays without phytodetritus. All of the colonizing capitel-lid polychaetes tested from trays with phytodetritus had δ13C signatures above ambient levels. The highest label up-take was by a capitellid (δ13C=5384.5 ‰) and a cumacean (δ13C=2530.4 ‰). Two spionids and an amphipod did not take up labeled phytodetritus in trays at 1147 m.
0% 10% 20% 30% 40% 50% 60% 70% 80% 90% 100%
Transect 1 ‐ 802 m Transect 2 ‐ 817 m Transect 2 ‐ 1148 m
Percent
Composition
Syllidae
Spionidae
Sabellidae
Lumbrineridae
Cossuridae
Cirratulidae
Capitellidae
[image:10.595.48.288.62.273.2]Ampharetidae
Fig. 6. Annelid family composition in colonization trays on the W.
Indian margin. See Table 1 for tray deployment periods and loca-tions.
4 Discussion
In this experiment we examined how colonizer density and composition differed at three water depths and oxygen lev-els, and explored the possible influence of phytodetritus on the type and abundance of colonizing invertebrates. We ini-tially hypothesized that the abundance of organisms would increase with oxygen and depth, there would be a significant difference in community composition among stations, and that trays containing phytodetritus would support more colo-nizers. Our limited results suggest that oxygen exerts a strong effect on macrofaunal abundance and community composi-tion, with core OMZ values of 0.7 µM O2at 542 m (transect 1) inhibiting macrofaunal colonization completely. Coloniz-ers were more abundant, with higher species richness at the better-oxygenated 1147 m station than at 802–817 m. While the labeling experiments indicate that many colonizers are capable of consuming phytodetritus, the presence of the al-gae did not unidirectionally affect density or composition of tray colonizers.
Sample sizes in this study were very small and experi-mental duration was very short. These parameters were con-strained by limited dive time and access to the sites. How-ever, they provide a first glimpse into the dynamics of recol-onization over very short periods in oxygen minimum zones.
4.1 Density: ambient vs. colonizing fauna
[image:10.595.308.546.64.224.2]Table 5. Carbon and nitrogen stable isotopic signatures for colonizers of trays with and without labeled phytodetritus (algae) added.
Back-ground data are also given for sediments and protistans. BackBack-ground data for macrofauna are given in Hunter et al. (2012) (Fig. 4).
Depth (m) Treatment Major Taxon Taxon ID No. Individuals δ13C (V-PDB) δ15N (AIR)
542 13C/15N Algae Algae Algae, labeled N/A 50 625.6 57 190.12
542 13C/15N Algae Protista Lenticularia sp. 1 −4.29 1.59
542 13C/15N Algae Protista Lenticularia sp. 12 −11.9 −4.47
542 13C/15N Algae Protista Uvigerina sp. 34 −9.4 652.3
542 13C/15N Algae Protista Hoeglundina sp. 23 −11.6 711.86
542 13C/15N Algae Protista Uvigerina sp. 40 −12.74 415.76
542 13C/15N Algae Protista Uvigerina sp. 30 −18.31 36.02
802 No Algae Polychaeta Cirratulidae 1 −22.79 3.04
802 No Algae Polychaeta Cossuridae 1 −24.02 4.96
802 13C/15N Algae Molluska Gastropoda 1 −18.06 5.14
802 13C/15N Algae Molluska Sabellidae 1 −24.02 6.06
802 13C/15N Algae Molluska Bivalve 1 −3.49 12.85
802 13C/15N Algae Ascidiacea Ascidian 1 235.3 2059.63
802 13C/15N Algae Protista Lenticularia sp. 10 15.61 1712
802 13C/15N Algae Protista Hoeglundina sp. 16 −17.36 271.28
802 13C/15N Algae Tube Protozoa 16.9 131.44
802 13C/15N Algae Protista Chilostomella sp. and, 6 −18.13 255.43
Globobulimina sp.
802 13C/15N Algae Tube Polychaete 1 −10.72 7.48
1147 No Algae Polychaeta Ampharetidae 1 −23.14 11.48
1147 No Algae Polychaeta Capitellidae 2 −24.48 3.09
1147 No Algae Crustacea Amphipoda 1 −22.62 8.45
1147 No Algae Polychaeta Spionidae 1 −24.32 8.98
1147 No Algae Polychaeta Pygospio 1 −22.47 7.88
1147 No Algae Polychaeta Capitellidae 2 −21.7 7.89
1147 No Algae Polychaeta Capitellidae 3 −20.55 12.2
1147 No Algae Polychaeta Capitellidae 3 −21.25 10.74
1147 No Algae Polychaeta Capitellidae 3 −21.8 7.62
1147 No Algae Polychaeta Capitellidae 2 −21.59 9.73
1147 13C/15N Algae Polychaeta Spionidae 1 −11.62 14.46
1147 13C/15N Algae Polychaeta Spionidae 2 −4.29 237.91
1147 13C/15N Algae Polychaeta Capitellidae 1 348.58 167.19
1147 13C/15N Algae Polychaeta Capitellidae 3 614.48 207.40
1147 13C/15N Algae Polychaeta Capitellidae 1 −22.21 111.37
1147 13C/15N Algae Polychaeta Capitellidae 3 5384.46 10 335.71
1147 13C/15N Algae Polychaeta Capitellidae 2 −15.14 67.34
1147 13C/15N Algae Crustacea Amphipoda 1 −2.04 20.56
1147 13C/15N Algae Crustacea Cumacea 1 2530.38 1792.31
835 Background Protista Globobulimina sp. and, 15 −9.34 5.46
Chilostomella sp.
900 Background Protista Reophax sp. 3 −21.71 3.02
800 Background Protista Allogromid 1 −20.21 3.72
800 Background Protista Nonionella sp. 7 −22.01 3.59
540 Background Sediment −20.38 5.53
800 Background Sediment −20.41 6.20
814 Background Sediment −20.22 6.02
1145 Background Sediment −20.59 7.49
6 months in similar colonization trays (Levin et al., 2006). Short-term experiments deployed for 7 weeks on Fieberling Guyot in the eastern Pacific Ocean (585–635 m) had
Fig. 7. Multidimensional scaling plot for metazoan macrofaunal community composition comparing (A) ambient fauna (closed symbols)
and colonizers (open symbols), ANOSIM:R=0.263,p=0.002; (B) tray colonizers in high oxygen (open square) and low oxygen (closed triangle) stations, ANOSIM:R=0.500,p=0.024; and (C) trays with labeled phytodetritus (closed symbols) and without phytodetritus (open symbols), ANOSIM:R= −0.084,p=0.81
.
recovery rates at these sites were 49 % (∼700 ind m−2) and 75 % (∼1250 ind m−2)of ambient densities (Levin and DiBacco, 1995).
However, other deep-sea studies have recorded density overshoots by colonizers. A 6 month study in the Bay of Bis-cay recorded colonizer densities 5 times higher than those in ambient sediment (Desbruyères et al., 1980, 1985). The am-bient density in the Indian margin was notably lower than in the Bay of Biscay experiments. Other relatively short-term colonization experiments using a similar tray apparatus have yielded a variety of results. In a 23 day experiment in the Northwest Atlantic, macrofaunal densities in Thalassiosira and Sargassum-enriched trays reached 66 450 ind m−2 and 16 000 ind m−2, respectively, greatly exceeding ambient den-sities (Snelgrove et al., 1994, 1996). However, the unen-riched controls did not exhibit the same ambient density overshoot seen in the enriched trays (Snelgrove, 1994, 1996). Macrofauna in the Indian margin exhibited a density over-shoot at 1147 m but it was not correlated with the presence
of phytodetritus and the overshoot was not as extreme as that observed in previous studies.
We observed slow recovery rates at the shallower, oxygen-deprived depths of 802 m (1.2 µM O2) and 817 m (2.2 µM O2). Densities were 10.7 % and 0.62 % of ambient densities, respectively. Trays left at 802 m were deployed for only 4 days, a duration much shorter than in other studies. With only one exception (Snelgrove et al., 1994, 1996), no other pub-lished study has tested colonization trays in the deep sea for less than a month. This short duration is one factor that could explain the low colonizer density relative to the ambient con-ditions. Low oxygen is another factor that may explain this. Further studies are needed to understand the timescales at which oxygen interacts with other environmental attributes to influence assemblage resilience and recovery potential.
4.2 Composition
Fig. 8. (A) Comparison of average metazoan macrofaunal density in
colonization trays with and without13C /15N-labeled phytodetritus on the W. Indian margin. (B) Comparison of metazoan macrofaunal composition in colonization trays with and without phytodetritus on the W. Indian margin. Each bar reflects data combined for 2 trays. See Table 1 for tray deployment periods and locations.
depths. Colonization trays at 802 m on transect 1 contained 1 bivalve and 2 gastropods that accounted for 30 % of the 10 animals colonizing. However, no mollusks were collected in ambient sediment at that depth, although sampling was limited. The proportion of polychaetes was 92 % in ambi-ent sedimambi-ent and 70 % (7 individuals) in colonization trays. This resembles the trends obtained by Levin at al. (2006) at a methane seep at the northern California margin, where poly-chaetes represented 57 % of ambient and only 27 % of colo-nization tray fauna. The ambient fauna obtained at 817 m on transect 2 was among the most diverse and abundant of any depth (Table 3). In contrast, within all 4 colonization trays only a single adult lumbrinerid was found. At 1147 m, trays were strongly dominated by juvenile capitellid polychaetes. Other colonizers were of mixed size reflecting both adult and juvenile stages.
Capitellids alone reached an average density of 2,686 ind m−2 in 1147 m trays, whereas macrofauna in ambient sediments at that depth were dominated by syllid and paraonid polychaetes, amphipods, and tanaids, and contained no Capitellidae. Capitella is an opportunistic genus and will rapidly colonize disturbed sediments (Grassle and Grassle, 1976). Off the W. African margin, Capitellidae appeared at 1300 and 4000 m in enriched colonization trays, but were not exceptionally dominant (Menot et al.,
Fig. 9. (A) Dual isotope plot of foraminifera in colonization trays
with13C /15N labeled phytodetritus added on transect 1 (Squares: 542 m trays; Circles: 800 m trays) and in ambient sediments (Dia-mond: 800 m). (B) Dual isotope plot of metazoan macrofaunal col-onizers in colonization trays with13C /15N-labeled phytodetritus added (closed symbols=with phyto) and those without (open sym-bols=no phyto) from 802 m on transect 1 and 1147 m on transect 2.
2009). In an experiment in the northwest Atlantic (900 m), capitellids accounted for half the animals in algae-enriched colonization trays after 23 days, but were absent in un-enriched trays (Snelgrove et al., 1996). Capitellidae were also dominant in an experiment conducted south of New England (USA) at 1800 and 3600 m. They were among the three most consistent colonizers and proved to be the most responsive to organic enrichment after 2 months (Grassle and Morse-Porteous, 1987). On the West Indian margin we did not observe the same discrepancy between trays with phytodetritus and without. Capitellidae represented 83.8 % of the macrofauna in trays with algae and 90.4 % in trays without (Fig. 8).
[image:13.595.308.545.62.345.2] [image:13.595.47.288.64.311.2]and higher oxygen levels (Hunter et al., 2011) may have fa-vored subsurface feeders like Capitella sp.
4.3 Phytodetritus consumption
Algae labeled with13C and15N was added to colonization trays to determine which animals consume phytodetritus. The greatest uptake occurred at 1147 m where oxygen was highest; capitellid and spionid polychaetes and a cumacean ingested labeled phytodetritus, withδ13C values as high as +5384.5 ‰ observed after 9 days (Fig. 9b). But not all taxa took up the isotopic label; one spionid and an amphipod did not. In other studies, annelids exposed to labeled phytode-tritus on the North Carolina (USA) slope at 850 m exhibited δ13C= −10 to +3,870 ‰, values significantly higher than that of ambient sediments (δ13C= −17.4 to−23.5 ‰) (Blair et al., 1996), but non-annelid metazoans were slower to con-sume phytodetritus (Levin et al., 1999).
Our study, like others (Snelgrove et al., 1994, 1996), re-vealed a large response from cumaceans. In the NE Atlantic, Aberle and Witte (2003) found that the primary families to take up the labeled phytodetritus were Cirratulidae and Spi-onidae. The elevated role of these animals in the consumption of phytodetritus was attributed to their surface-deposit feed-ing lifestyle. The Capitellidae that were so abundant in our study are traditionally considered to be subsurface-deposit feeders. However, Levin et al. (2006) demonstrated that capitellid polychaetes can readily obtain carbon from labeled plant phytodetritus in shallow water. On the North Carolina (USA) slope (850 m), only 25 % of capitellids showed an in-crease inδ13C after 14 months of exposure to13C labeled phytodetritus, while 100 % of cirratulids showed a response after the same amount of time (Levin et al., 1999). A similar result was also found in a Norwegian Fjord (688 m) where capitellid polychaetes showed little algal consumption after exposure to labeled algae for 2 to 14 days (Sweetman and Witte, 2008). While most of the capitellid individuals in our study exhibited an increased13C /12C ratio, all Capitellidae had even more elevated15N /14N ratios (Table 5). This sug-gests that15N might be a more sensitive and reliable tracer for phytodetritus use than13C; possibly it leaches from detri-tus into the dissolved organic matter pool and is quickly used by heterotrophic bacteria and then consumed by Capitella sp. Alternatively, C may be respired more readily than N, which could be sequestered within tissues. At 1147 m, one of the spionids had an elevated15N /14N ratio but the other was not significantly different than those in macrofauna from ambi-ent sedimambi-ents or unlabeled trays. A high degree of variation in mean isotopic signatures among taxa and even families is typical for phytodetritus labeling experiments (Levin et al., 1997, 1999; Aberle and Witte, 2003; this study).
During our cruise (YK08-11), comparable replicated iso-tope tracing experiments (n=3) using the same labeled phytodetrital material were carried out directly on sediment in order to investigate rates and pathways of OM
process-ing by the established macrofaunal community (Hunter et al., 2012). In these experiments, macrofauna was absent at 540 m, and polychaetes were the most abundant taxon at the other three stations, with cirratulids and sabellids most abun-dant at 800 m on transect 1, and oweniids and cirratulids most abundant at 800 m and 1100 m on transect 2. In con-trast to the colonizer community, C and N uptake by the es-tablished macrofauna community was dominated by cirrat-ulids at both 800 m stations. At the 1100 m station, the ma-jority of C and N uptake was spread more evenly among three polychaete families. In this study, only one individual of the genus Capitella was found in the mature community at 800 m on transect 1 (Hunter et al., 2012), suggesting that patterns of OM processing are likely to differ significantly during the transition from a pioneering to mature community.
Research by Woulds et al. (2007, 2009) on the Pak-istan margin has shown significant effects of oxygen on the taxa responsible for phytodetritus processing. Protists (foraminifera) dominate phytodetritus consumption at oxy-gen concentrations below 5 µM whereas metazoan macro-fauna dominate at higher oxygen levels. Protists were not quantified in our experiments, but they were present in trays at 542 m and 802 m and clearly took up labeled N and C, whereas metazoan phytodetritus uptake was sig-nificant only at higher oxygen levels (Fig. 9). Where the foraminifera in the recolonization trays originated from is un-clear. They are relatively large calcareous species that were retained on a 300 µm mesh sieve. Macrofauna-sized agglu-tinated foraminifera were reported from colonization trays by Kaminski et al. (1988), but these experiments were con-ducted over a 9-month time period. It would be impossi-ble for individuals of this size to develop from colonizing propagules or juveniles within a period of days. There are several other possible explanations: the foraminifera may have crawled into the trays across the flat collar, been resus-pended and wafted into the trays during submersible oper-ations, or they survived freezing at−20◦C and sonication. Whatever their origin, the fact that they took up the label from phytodetritus demonstrates that they were alive during the experiment.
4.4 Effects of phytodetritus on density and composition
that communities under natural disturbances would exhibit high colonization rates driven by opportunistic species able to maintain populations in patchily distributed, disturbed ar-eas. In our experiments, additions were designed to detect phytodetritus consumption rather than enhance organic mat-ter availability. Thus, the addition of phytodetritus repre-sented a <1 % enrichment of carbon in the surface 1 cm of sediment. Nevertheless, similar organic matter additions have prompted benthic community responses in previous studies (e.g., Menot et al., 2009). This may have been partly due to the freshness or high “food quality” of added organic matter compared to that which normally arrives at the deep-sea floor (e.g., Woulds et al., 2007). The lack of response to phytodetritus observed in our colonization trays is consistent with findings at an oligotrophic setting at 4000 m on the W. African margin, where macrofaunal densities were not posi-tively correlated with organic enrichment, but different from those at 1300 m where 0.3 and 1 % enrichment yielded en-hanced macrofaunal densities (Menot et al., 2009).
4.5 Factors influencing colonization
As shown by Grassle and Morse-Porteous (1987), experi-ment deployexperi-ment time may be critical in determining the density and composition of the colonizers. Colonizers that respond rapidly to organic enrichment may be present after 2 months but could get out-competed after 10 months. The time range of 4 to 9 days does not reveal the complete suc-cessional response.
Recolonization of natural sediment has been shown to oc-cur more readily than in trays with prefrozen sediment and also to attract an assemblage of macrofauna more similar to ambient assemblages (Smith, 1985). The heavy colonization of the 1147 m trays by Capitella is consistent with past ob-servations of Capitella as a disturbance opportunist (Grassle, Morse-Porteous, 1987; Snelgrove et al., 1994, 1996) that is rare in undisturbed ambient sediments in deep water. In a 6 month experiment, colonization of trays containing coastal sediment was 1/3 that of trays with sediment from the abyssal depths where the experiment took place, despite higher OM content in the coastal sediment (Desbruyères et al., 1980). Colonization trays have been posited to cause al-tered hydrodynamics and isolation, as well as having an ar-bitrary size (Smith, 1985). Although the trays used here are hydrodynamically unbiased and scour was limited, the tray design may exclude species that “crawl” within a limited area and preferentially select those settling or advected from the water column. This may contribute to differences between ambient fauna and colonizers.
5 Conclusions
This study was the first to examine the effects of reduced oxygen concentration on continental slope early colonization
and to draw comparisons to ambient density and composi-tion. Few colonization experiments have been conducted in the Indian Ocean; most experiments of this type have been conducted in the Pacific and Atlantic oceans. This study was also unusual in that deployment times were shorter than in any other reported deep-water colonization exper-iment. Results indicate the potential for rapid colonization by opportunists if oxygen is sufficient, but little colonization when it is not. As little as 9 days is enough time to over-shoot ambient density by 150 % at oxygen concentrations of around 0.5 mL L−1(22 µM). Most of the colonizing taxa were present in ambient sediments.
The type of information generated in this study is rel-evant to understanding consequences for benthic ecosys-tems exposed to or recovering from declining oxygen lev-els. Increased extent of both anthropogenic dead zones (Diaz and Rosenberg, 2008) and natural oxygen minimum zones (Stramma et al., 2008; 2010) are exposing more shelf and slope communities to hypoxic conditions (Bograd et al., 2008; Chan et al., 2008). Colonization by benthos will oc-cur following hypoxia-induced mortality on shelves.
Understanding of colonization dynamics and ensuing suc-cession is also important for management of areas subject to direct human disturbance. Trawling, oil spills, or seabed mining can all create scenarios in OMZs where coloniza-tion occurs following disturbance. Phosphate mining is being considered within several OMZs globally. We note that the small scales on which we studied colonization are not likely to paint a true picture of colonization dynamics following a large-scale mining or trawling disturbance. Thus, despite the fact that we saw rapid colonization at 1150 m off W. India within a week, this cannot be used as evidence for rapid col-onization of seafloor habitats. Additional research is needed to address subsequent changes in colonizer assemblages over longer time periods and larger spatial scales. Further explo-ration of colonization trends across hydrographic gradients and their consequences for ecosystem services is warranted.
Acknowledgements. We thank the captain and crew of the RV Yokosuka and the pilots and staff of the Shinkai 6500 for their
assis-tance with the field operations. We thank the scientists participating in cruise number YK08-11 for their assistance at sea and in making auxiliary measurements, especially Kazumasa Oguri, Will Hunter, and Hidetaka Nomaki. We thank Ray Lee for assistance with stable isotope analyses and we thank L. Menot and two anonymous reviewers for their insightful comments on an earlier draft of the manuscript. This research was supported by JAMSTEC and grant no. ERI 008427 from The Carnegie Trust (to UW).
Edited by: S. W. A. Naqvi
References
pulse-chase experiments using13C-labelled phytodetritus, Mar. Ecol. Prog. Ser., 251, 37–47, 2003.
Blair, N. E., Levin, L. A., DeMaster, D. J., and Plaia, G.: The short-term fate of fresh algal carbon in continental slope sediments. Limnol. Oceanogr., 41, 1208–1219, 1996.
Bograd, S. J., Castro, C. G., Di Lorenzo, E., Palacios, D. M., Bailey, H., Gilly, W., and Chavez, F. P.: Oxygen declines and the shoaling of the hypoxic boundary in the California Current, Geophys. Res. Lett., 35, L12607. doi:10.1029/2008GL034185, 2008.
Buhring, S. I., Lampadariou, N.: Moodley, L., Tselepides, A., and Witte, U., Benthic microbial and whole-community responses to different amounts of 13C-enriched algae: in situ experi-ments in the deep Cretan Sea (Eastern Mediterranean), Limnol. Oceanogr., 51, 157–165, 2006.
Chan, F., Barth, J. A., Lubchenco, J., Kirincich, A., Weeks, H., Pe-terson, W. T., and Menge, B. A.: Emergence of anoxia in the California Current large marine ecosystem, Science, 319, p. 920, 2008
Desbruyeres, D., Bevas, J., and Khripounoff, A.: Un cas de colo-nization rapide d’une sediment profound, Oceanol. Acta, 3, 285– 291, 1980.
Desbruyeres, D., Deming J.W., Dinet, A., and Khripounoff, A.: Re-actions de l’ecosysteme benthique profound aux perturbations: noveaux resultants experimenteaux, in: Peuplements profonds du Golfe de Gascogne, edited by: Laubier, L. and Monniot, C., Insti-tute Franceais de Recherche pour l’Exploration de la Mer, 193– 209, 1985.
Díaz, R. J. and Rosenberg, R.: Spreading dead zones and conse-quences for marine ecosystems, Science, 321, 926–929, 2008. Gooday, A. J., Bett, B. J., Escobar, E., Ingole, B., Levin, L. A.,
Neira, C., Raman, A. V., and Sellanes, J.: Habitat heterogeneity and its relationship to biodiversity in oxygen minimum zones, Mar. Ecol., 31, 125–147, 2010.
Grassle, J. P. and Grassle, J. F.: Sibling species in the marine pol-lution indicator Capitella (Polychaeta), Science, 19, 567–569, 1976.
Grassle, J. F. and Morse-Porteous, L. S.: Macrofaunal colonization of disturbed deep-sea environments and the structure of deep-sea communities, Deep Sea Res., 34, 1911–1950, 1987.
Helly, J. and Levin, L. A.: Global distribution of naturally occurring marine hypoxia on continental margins, Deep Sea Res., 51, 1159-1168, 2004.
Hughes, D. J., Lamont, P. A., Levin, L. A., Packer, M. and Gage, J. D.: Macrofaunal community structure and bioturbation across the Pakistan margin oxygen minimum zone, north-east Arabian Sea, Deep Sea Res. II., 56, 434–448, 2010.
Hunter, W. R., Levin, L. A., Kitazato, H., and Witte, U.: Macroben-thic assemblage structure and organismal stoichiometry control faunal processing of particulate organic carbon and nitrogen in oxygen minimum zone sediments, Biogeosciences, 9, 993–1006, doi:10.5194/bg-9-993-2012, 2012.
Ingole, B. S., Sautya, S., Sivadas, S., Singh, R., and Nanajkar, M.: Macrofaunal community structure in the western Indian conti-nental margin including the oxygen minimum zone, Mar. Ecol., 31, 148–166, doi:10.1111/j.1439-0485.2009.00356.x, 2010. Kaminski, M. A., Grassle, J. F., and Whitlach, R. B.: Life
his-tory and recolonization among agglutinated foraminifera in the Panama Basin, in: Second Workshop on Agglutinated Foraminifera, edited by: Gradstein, M. F. and Rögl, F.,
Abhand-lungen der Geologischen Bundesanstalt, Wien, 41, 229–243, 1988.
Keeling, R. F., Kórtzinger, A., and Gruber, N.: Ocean deoxygena-tion in a warming world, Annu. Rev. Mar. Sci., 2, 199–229, 2010. Levin, L. A.: Oxygen minimum zone benthos: adaptation and com-munity response to hypoxia, Oceanogr. Mar. Biol. Ann. Rev., 41, 1–45, 2003.
Levin, L. A., Blair, N., DeMaster, D. J., Plaia, G., Fornes, W., Mar-tin, C. and Thomas, C.: Rapid subduction of organic matter by maldanid polychaetes on the North Carolina slope, J. Mar. Res., 55, 595–611, 1997.
Levin, L. A, Blair, N., Martin, C., DeMaster, D., Plaia, G., and Thomas, C.: Macrofaunal processing of phytodetritus at two sites on the Carolina margin: In situ experiments using 13 C-labeled diatoms, Mar. Ecol. Progr. Ser., 182, 37–54, 1999. Levin, L. A. and DiBacco, C.: The influence of sediment transport
on short-term recolonization by seamount infauna, Mar. Ecol. Progr. Ser., 123, 163–175, 1995.
Levin, L. A. and Gage, J. D.: Relationships between oxygen, or-ganic matter and the diversity of bathyal macrofauna, Deep Sea Res., 45, 129–163, 1998.
Levin, L. A. and Smith, C. R.: Response of fauna to disturbance and enrichment in the deep sea: a sediment tray experiment, Deep Sea Res., 31, 1277–1285, 1984.
Levin L. A., Gage J. D., Martin C., and Lamont P. A.: Macrobenthic community structure within and beneath the oxygen minimum zone, NW Arabian Sea, Deep Sea Res. II, 47, 189–226, 2000. Levin, L. A., Ziebis, W., Mendoza, G. F., Growey-Cannon, V., and
Walther, S.: Recruitment response of methane-seep macrofauna to sulfide-rich sediments: An in situ experiment, J. Exp.. Mar. Biol. Ecol., 330, 132–150, 2006.
Levin L. A., Whitcraft, C., Mendoza, G. F., Gonzalez, J. P., and Cowie, G.: Oxygen and organic matter thresholds for benthic faunal activity: a case study across the Pakistan margin oxygen minimum zone (700–1100 m), Deep Sea Res. II, 56, 449–471, 2009.
Levin, L. A., Ziebis, W., Mendoza, G. F., Bertics, V. J., Washington, T., Gonzalez, J., Thurber, A. R., Ebbe, B., and Lee, R. W.: Eco-logical release and niche partitioning under stress: Lessons from dorvilleid polychaetes in sulfidic sediments at methane seeps, Deep Sea Res. II, 92, 214–233, 2013.
McClatchie, S., Goericke, R., Cosgrove, R., Auad, G., & Vetter, R. Oxygen in the Southern California Bight: Multidecadal trends and implications for demersal fisheries, Geophys. Res. Lett., 37, L19602. doi:10.1029/2010GL044497, 2010.
Menot, L., Crassous, P., Desbruyeres, D., Galeron, J., Khripounoff, A., and Sibuet, M.: Colonization patterns along the equatorial West African margin: Implications for functioning and diversity maintenance of bathyal and abyssal communities, Deep Sea Res. II, 56, 2313–2325, 2009.
Pacheco, A. S., Laudien, J., Thiel, M., Oliva, M., and Heilmayer, O.: Succession and seasonal onset of colonization in subtidal hard-bottom communities off northern Chile, Mar. Ecol., 32, 75–87, doi:10.1111/j.1439-0485.2010.00398.x, 2011.
Rabalais, N. N., Díaz, R. J., Levin, L. A., Turner, R. E., Gilbert, D., and Zhang, J.: Dynamics and distribution of natural and human-caused hypoxia, Biogeosciences, 7, 585–619, doi:10.5194/bg-7-585-2010, 2010.
Ramirez-Llodra, E., Tyler, P. A., Baker, M. C., Bergstad, O. A., Clark, M. R., Escobar, E., Levin, L. A., Menot, L., Rowden A. A., Smith, C. R., and Van Dover, C. L.: Man and the last great wilder-ness: Human impact on the deep sea, PLoS ONE, 6, e22588, doi:10.1371/journal.pone.0022588, 2011
Smith, C. R.: Colonization studies in the deep sea: are results biased by experimental designs?, in: Nineteenth European Marine Biol-ogy Symposium, edited by: Gibbs, P. E., Cambridge University Press, Cambridge, 183–190, 1985.
Smith, C. R. and Hessler, R. R.: Colonization and succession in deep-sea ecosystems, Trends Ecol. Evol., 2, 359–363, 1987. Snelgrove, P. V. R. and Smith, C. R.: A riot of species in an
environ-mental calm: the paradox of the species-rich deep sea, Oceanogr. Mar. Biol. Ann. Rev., 40, 311–342, 2002.
Snelgrove, P. V. R., Grassle, J. F., and Petrecca, R. F.: The role of food patches in maintaining high deep-sea diversity: field experi-ments using hydrodynamically unbiased colonization trays, Lim-nol. Oceanogr., 37, 1543–1550, 1992.
Snelgrove, P. V. R., Grassle, J. F., and Petrecca, R. F.: Macrofaunal response to artificial enrichments and depressions in a deep-sea habitat, J. Mar. Res., 52, 345–369, 1994.
Snelgrove, P. V. R., Butman, C. A., and Grassle, J. F.: Potential flow artifacts associated with benthic experimental gear: deep-sea mudbox examples, J. Mar. Res., 53, 821–845, 1995.
Snelgrove, P. V. R., Grassle, J. F., and Petrecca, R. F.: Experimen-tal evidence for aging of food patches as a factor contributing to high deep-sea macrofaunal diversity, Limnol. Oceanogr., 41, 605–614, 1996.
Stramma, L., Johnson, G. C., Sprintall, J., and Mohrholz, V.: Ex-panding oxygen-minimum zones in the tropical oceans, Science, 320, 655–658, 2008.
Stramma, L., Schmidt, S., Levin, L. A., and Johnson, G. C.: Ocean oxygen minima expansions and their biological impacts, Deep Sea Res., 210, 587–595, 2010.
Sweetman A. and Witte U.: Macrofaunal response to phytodetritus in a bathyal Norwegian fjord, Deep Sea Res., 155, 1503–1514, 2008.
Witte, U., Aberle, N., Sand, M., and Wenzhofer, F.: Rapid response of deep-sea benthic community to POM enrichment: an in situ experimental study, Mar. Ecol. Prog. Ser., 51, 27–36, 2003. Woulds, C., Cowie, G. L., Levin, L. A., Andersson, J. H.,
Middel-burg, J. J., Vandewiele, S., Lamont, P. A., Larkin, K. E., Gooday, A. J., Schumacher, S., Whitcraft, C., Jeffreys, R., and Schwartz, M.: Oxygen as a control on sea floor biological communities and their roles in sedimentary carbon cycling, Limnol. Oceanogr., 52, 1698–1709, 2007.