InTrans Project Reports Institute for Transportation
7-2016
Developing Green, Highly Flowable, Rapid Set,
High-Performance Concrete for Pavement Patch
Repair
Kejin Wang
Iowa State University, [email protected] Gilson Lomboy
Iowa State University, [email protected]
Follow this and additional works at:http://lib.dr.iastate.edu/intrans_reports Part of theCivil Engineering Commons
This Report is brought to you for free and open access by the Institute for Transportation at Iowa State University Digital Repository. It has been accepted for inclusion in InTrans Project Reports by an authorized administrator of Iowa State University Digital Repository. For more information, please [email protected].
Recommended Citation
Wang, Kejin and Lomboy, Gilson, "Developing Green, Highly Flowable, Rapid Set, High-Performance Concrete for Pavement Patch Repair" (2016).InTrans Project Reports. 214.
Developing Green, Highly Flowable, Rapid Set, High-Performance
Concrete for Pavement Patch Repair
Abstract
A high-performance mortar (HPM) containing a large amount of industrial by-products such as fly ash, silica fume, and limestone fines was developed for rapid repair of concrete pavements. The HPM development included three major steps.
1. Development of the mortar mixture proportion based on the optimal hydration of binder and particle packing of the mortar system. In this step of the study, all mortar materials were systematically proportioned, and the obtained mixtures were tested for flowability, rate of hydration, set time, and strength development. The optimal mixture proportion was then selected as the HPM, as it displayed good self-consolidating ability and achieved 1-day compressive strengths greater than 6,000 psi.
2. Investigation of the mechanical properties of the new HPM, including compressive and flexural strength, elastic modulus, and slant shear and pull-off strengths of patch-substrate bonds tested at 1, 3, 7, and 28 days. In this step, the properties of the HPM were evaluated in comparison with those of a commercial repair material: the rapid-set concrete (RSC). Two types of substrates representing old concrete were used for patching repair. One was made of a typical pavement mixture (C-3WR-C20), and the other was a high-strength pavement concrete mixture (O-4WR).
3. Investigation of the durability properties of the newly developed HPM compared to those of the RSC. Durability properties included cyclic freeze-thaw (F-T) resistance, permeability, and shrinkage behavior.
The results indicated that the newly developed HPM possesses excellent self-consolidating ability: highly flowable and non-segregating. Although there was delayed setting, the compressive strength of the HPM exceeded 6,000 psi at 1 day, approximately 25 percent higher than that of the RSC. At 28 days, the HPM reached 10,000 psi, while the RSC was about 7,000 psi. The HPM also displayed extremely low chloride permeability (18 coulombs) compared to the RSC (2,550 coulombs) and excellent F-T durability without the requirement for air entrainment. The F-T durability factor of HPM was kept around 100% throughout the standard F-T test, while the F-T durability factor of RSC reduced to 80% at the end of the F-T test. However, the HPM exhibited noticeably higher autogenous shrinkage and slightly lower free drying shrinkage than the C-3WR-C20 mixture, while the RSC had a little/no shrinkage during the 56-day test period. Addition of a small amount of micro-steel fibers (70 pcy) slightly reduced the shrinkage of the HPM.
Further studies on fatigue and shrinkage cracking behavior of the HPM are recommended.concrete.
Keywords
concrete pavement patches, high-performance mortar, limestone fines, rapid repair, patching mortar, mortar, silica fume, high performance concrete, fresh concrete
Comments
For this and other reports, see the Midwest Transportation Center project page at
http://www.intrans.iastate.edu/mtc/index.cfm/research/project/project/231283870and the InTrans website athttp://intrans.iastate.edu/
Developing Green, Highly Flowable,
Rapid Set, High-Performance Concrete
for Pavement Patch Repair
About MTC
The Midwest Transportation Center (MTC) is a regional University Transportation Center (UTC) sponsored by the U.S. Department of Transportation Office of the Assistant Secretary for Research and Technology (USDOT/OST-R). The mission of the UTC program is to advance U.S. technology and expertise in the many disciplines comprising transportation through the mechanisms of education, research, and technology transfer at university-based centers of excellence. Iowa State University, through its Institute for Transportation (InTrans), is the MTC lead institution.
About InTrans
The mission of the Institute for Transportation (InTrans) at Iowa State University is to develop and implement innovative methods, materials, and technologies for improving transportation efficiency, safety, reliability, and sustainability while improving the learning environment of students, faculty, and staff in transportation-related fields.
About the National CP Tech Center
The mission of the National Concrete Pavement Technology (CP Tech) Center is to unite key transportation stakeholders around the central goal of advancing concrete pavement technology through research, tech transfer, and technology implementation.
ISU Non-Discrimination Statement
Iowa State University does not discriminate on the basis of race, color, age, ethnicity, religion, national origin, pregnancy, sexual orientation, gender identity, genetic information, sex, marital status, disability, or status as a U.S. veteran. Inquiries regarding non-discrimination policies may be directed to Office of Equal Opportunity, Title IX/ADA Coordinator, and Affirmative Action Officer, 3350 Beardshear Hall, Ames, Iowa 50011, 515-294-7612, email [email protected].
Notice
The contents of this report reflect the views of the authors, who are responsible for the facts and the accuracy of the information presented herein. The opinions, findings and conclusions expressed in this publication are those of the authors and not necessarily those of the sponsors.
This document is disseminated under the sponsorship of the U.S. DOT UTC program in the interest of information exchange. The U.S. Government assumes no liability for the use of the information contained in this document. This report does not constitute a standard, specification, or regulation.
The U.S. Government does not endorse products or manufacturers. If trademarks or
manufacturers’ names appear in this report, it is only because they are considered essential to the objective of the document.
Quality Assurance Statement
Technical Report Documentation Page
1. Report No. 2. Government Accession No. 3. Recipient’s Catalog No.
4. Title and Subtitle 5. Report Date
Developing Green, Highly Flowable, Rapid Set, High-Performance Concrete for Pavement Patch Repair
July 2016
6. Performing Organization Code
7. Author(s) 8. Performing Organization Report No.
Kejin Wang and Gilson R. Lomboy
9. Performing Organization Name and Address 10. Work Unit No. (TRAIS)
National Concrete Pavement Technology Center Iowa State University
2711 South Loop Drive, Suite 4700 Ames, IA 50010-8664
11. Contract or Grant No.
DTRT13-G-UTC37
12. Sponsoring Organization Name and Address 13. Type of Report and Period Covered
Midwest Transportation Center 2711 S. Loop Drive, Suite 4700 Ames, IA 50010-8664
Civil, Construction, & Environmental Engineering, Iowa State University 394 Town Engineering,
Ames, IA 50011
U.S. Department of Transportation Office of the Assistant Secretary for Research and Technology
1200 New Jersey Avenue, SE Washington, DC 20590
Final Report
14. Sponsoring Agency Code
15. Supplementary Notes
Visit www.intrans.iastate.edu for color pdfs of this and other research reports.
16. Abstract
A high-performance mortar (HPM) containing a large amount of industrial by-products such as fly ash, silica fume, and limestone fines was developed for rapid repair of concrete pavements. The HPM development included three major steps.
1. Development of the mortar mixture proportion based on the optimal hydration of binder and particle packing of the mortar system. In this step of the study, all mortar materials were systematically proportioned, and the obtained mixtures were tested for flowability, rate of hydration, set time, and strength development. The optimal mixture proportion was then selected as the HPM, as it displayed good self-consolidating ability and achieved 1-day compressive strengths greater than 6,000 psi.
2.Investigation of the mechanical properties of the new HPM, including compressive and flexural strength, elastic modulus, and slant shear and pull-off strengths of patch-substrate bonds tested at 1, 3, 7, and 28 days. In this step, the properties of the HPM were evaluated in comparison with those of a commercial repair material: the rapid-set concrete (RSC). Two types of substrates representing old concrete were used for patching repair. One was made of a typical pavement mixture (C-3WR-C20), and the other was a high-strength pavement concrete mixture (O-4WR).
3.Investigation of the durability properties of the newly developed HPM compared to those of the RSC. Durability properties included cyclic freeze-thaw (F-T) resistance, permeability, and shrinkage behavior.
The results indicated that the newly developed HPM possesses excellent self-consolidating ability: highly flowable and non-segregating. Although there was delayed setting, the compressive strength of the HPM exceeded 6,000 psi at 1 day,
approximately 25 percent higher than that of the RSC. At 28 days, the HPM reached 10,000 psi, while the RSC was about 7,000 psi. The HPM also displayed extremely low chloride permeability (18 coulombs) compared to the RSC (2,550 coulombs) and excellent F-T durability without the requirement for air entrainment. The F-T durability factor of HPM was kept around 100% throughout the standard F-T test, while the F-T durability factor of RSC reduced to 80% at the end of the F-T test. However, the HPM exhibited noticeably higher autogenous shrinkage and slightly lower free drying shrinkage than the C-3WR-C20 mixture, while the RSC had a little/no shrinkage during the 56-day test period. Addition of a small amount of micro-steel fibers (70 pcy) slightly reduced the shrinkage of the HPM.
DEVELOPING GREEN, HIGHLY FLOWABLE,
RAPID SET, HIGH-PERFORMANCE CONCRETE
FOR PAVEMENT PATCH REPAIR
Final Report July 2016
Principal Investigator Kejin Wang, Professor
Civil, Construction, and Environmental Engineering, Iowa State University
Co-Principal Investigator
Gilson R. Lomboy, Postdoctoral Research Associate
Civil, Construction, and Environmental Engineering, Iowa State University
Research Assistants
Jiaxi Ren, Jennifer Davis, Lian Bo, and Wenjing Cai
Authors
Kejin Wang and Gilson R. Lomboy
Sponsored by
Midwest Transportation Center, U.S. Department of Transportation
Office of the Assistant Secretary for Research and Technology, and Civil, Construction, and Environmental Engineering
at Iowa State University
A report from
National Concrete Pavement Technology Center and Institute for Transportation
TABLE OF CONTENTS
ACKNOWLEDGMENTS ... ix
1 INTRODUCTION ...1
1.1 Background ...1
1.2 Objectives ...3
1.3 Scope ...3
2 MATERIALS AND MIXING METHODS ...4
2.1 Materials ...4
2.2 Mixing Methods ...6
3 SELECTION OF MIXTURE ...8
3.1 Flowability and Compressive Strength ...8
3.2 Particle Packing Analysis ...10
3.3 Heat of Hydration and Setting Time ...13
4 MECHANICAL PROPERTIES ...17
4.1 Compressive Strength and Elastic Modulus ...17
4.2 Modulus of Rupture ...18
4.3 Slant Shear Strength ...19
4.4 Direct Pull-off Strength...22
5 DURABILITY PROPERTIES...29
5.1 Cyclic Freezing and Thawing ...29
5.2 Shrinkage ...31
5.3 Permeability ...36
6 CONCLUSIONS AND RECOMMENDATIONS ...38
6.1 Conclusions ...38
6.2 Recommendations ...39
vi
LIST OF FIGURES
Figure 1. Single size particle packing (left) and three size particle packaging (right) ...2
Figure 2. Force transfer in normal strength concrete (left) and in ultra-high-performance concrete (right) ...2
Figure 3. Particle size distribution of portland cement, fly ash, and limestone fines ...4
Figure 4. Particle size distribution of SF tested by laser diffraction under three degrees of dispersion: no dispersion – tested as is, partially dispersed – sonicated with surfactant, and well dispersed – sonicated for 180 seconds with surfactant ...5
Figure 5. Gradation of coarse aggregates for substrates C-3WR-C20, O-4WR, and fine aggregates ...5
Figure 6. Filling of mold with rapid repair mixture ...9
Figure 7. Flow of rapid repair mixture...9
Figure 8. Compressive strength of mixtures with different amounts of SF replacement ...10
Figure 9. Particle size distribution of combined powders containing PC, SF, and LF for Mixes 1 through 4 and the A&A model...12
Figure 10. Particle size distribution of combined powders containing PC, SF, FA, and LF for Mix 2, Mixes 5 through 7, and the A&A model with magnified region inset ...13
Figure 11. Rate of heat generation of pastes from rapid repair materials in the HPM with and without limestone fines, RSC, and conventional concrete C-3WR-C20 at 20°C ...15
Figure 12. Penetration resistance of the HPM, RSC, and C-3WR-C20, indicating initial set time (IS = 500 psi) and final set time (FS = 4,000 psi) ...16
Figure 13. Compressive strengths of the HPM without and with steel fibers, RSC, and C-3WR-C20 at 1, 3, 7, and 28 days ...17
Figure 14. Elastic modulus of the HPM, HPM-f, RSC, and C-3WR-C20 at 1, 3, 7, and 28 days ...18
Figure 15. Modulus of rupture of the HPM without and with steel fibers, RSC, and C-3WR-C20 at 1, 3, 7, and 28 days ...19
Figure 16. Slant shear sample composed of sandblasted substrate (left) and substrate (lighter color) and patch material combined as a 4 by 8 in. sample (right) ...20
Figure 17. Slant shear strength of HPM without and with steel fibers and RSC at 1, 3, 7, and 28 days ...21
Figure 18. Typical slant shear failure modes: bond interface failure with the two halves separating at the interface (left) and substrate failure where the substrate cracks and breaks (right) ...21
Figure 19. Sandblasting of samples for bond test: slant shear substrates on a pallet that is bordered with 4×6×21 in. substrate slabs (left) and actual sandblasting of substrates (right)...22
Figure 20. Slab surfaces: sandblasted surface (left) and troweled surface without sandblasting (right) ...23
Figure 21. Direct pull-off test with loading device (Proceq DY-2 model) mounted on sample slab ...23
Figure 23. Testing of epoxy: steel disk epoxied to an uncut concrete surface (left), epoxy failure after direct-pull off test (center), and concrete failure due to good epoxy
bond (right) ...25 Figure 24. Pull-off strength of rapid repair mixtures with sandblasted but not grouted
C-3WR-C20 substrates where (a) shows substrate failure and (b) shows bond
failure ...26 Figure 25. Pull-off strength of rapid repair mixtures with sandblasted and grouted
C-3WR-C20 substrates where (a) shows substrate failure and (c) shows repair
material failure ...27 Figure 26. Pull-off strength of rapid repair mixtures with O-4WR substrates showing
(a) substrate failure and (b) bond failure ...28 Figure 27. Durability factor of concrete prisms under cyclic F-T test ...29 Figure 28. Percent mass loss of concrete prisms under cyclic F-T test ...30 Figure 29. Prisms after 300 F-T cycles: HPM (upper left), HPM-f (upper right), RSC
(lower left), and C-3WR-C20 (lower right) ...30 Figure 30. Corrugated plastic tubes used in autogenous shrinkage device...31 Figure 31. Length change due to autogenous shrinkage of the HPM, HPM-f, RSC, and
C-3WR-C20 ...32 Figure 32. Drying shrinkage samples ...33 Figure 33. Length change due to free drying shrinkage of the HPM, HPM-f, RSC, and
C-3WR-C20 ...33 Figure 34. Weight change due to drying of the HPM, HPM-f, RSC, and C-3WR-C20 ...34 Figure 35. Total change in length change due to moist curing followed by free drying
shrinkage of the HPM, HPM-f, RSC, and C-3WR-C20 ...34 Figure 36. Total weight change due to moist curing and drying of the HPM, HPM-f,
RSC, and C-3WR-C20 ...35
LIST OF TABLES
Table 1. Mix proportions of substrates (mature concrete to be patched) ...6 Table 2. Mix proportions, flow, and 1-day compressive strength ...8 Table 3. Distribution modulus for Pt that gives a minimum RSS for the Pt-actual of a mix
and the corresponding RSS...12 Table 4. Rapid chloride permeability and surface resistivity of substrate and rapid repair
ACKNOWLEDGMENTS
The authors would like to thank the Midwest Transportation Center, the U.S. Department of Transportation Office of the Assistant Secretary for Research and Technology, and the Civil, Construction, and Environmental Engineering Department at Iowa State University for
sponsoring this research. The authors would also like to acknowledge the special technical and administrative support of the National Concrete Pavement Technology (CP Tech) Center at Iowa State University’s Institute for Transportation throughout the entire project.
1 INTRODUCTION
1.1 Background
The United States has an aging transportation infrastructure that is requiring extensive maintenance. According to a survey by The Road Information Program, 32 percent of major roads in the US are in either poor or mediocre condition (TRIP 2012). Rapid repair of the deteriorated roads is essential to avoiding the inconvenience of commuters and disruption of daily business. The repaired pavements must be strong and durable to meet service requirements and extend their service lives. For these demands, use of high-performance concrete (HPC) as a repair material is a very attractive option.
HPC has been increasingly used for transportation structures, and especially bridge decks. HPC features the following qualities: high early strength (approximately 4,000 psi at 24 hours), high workability, and high durability.
Recently, research has revealed that strength concrete (UHSC) or ultra-high-performance concrete (UHPC) can be produced using quartz and quartzite powders. Such concrete has very good flowability and excellent strengths (22,000 psi at 28 days).
Unfortunately, the existing UHPC is often specially formulated and packaged with particular materials, and it is expensive and difficult to be directly produced by users. In addition, most existing UHPC is not designed to have features for concrete repair, which includes not only rapid set and early compressive strength but also excellent workability, bond strength, shrinkage, and freeze-thaw (F-T) resistance.
Research has shown that limestone powders can benefit concrete in many ways: (1) chemically, by supplying ions that modify the kinetics of hydration and the morphology of hydration
products (Daimon and Sakai 1998) while very fine limestone particles can act as nucleation sites, thereby accelerating strength development (Sato and Diallo 2010); (2) physically, by assisting cement grain dispersion and enhancing packing density, thus reducing the interstitial voids and permeability (Hornain 1995) and increasing concrete fluidity (Moir and Kelham 1997); (3) economically, because limestone fine-based HPC can reduce the life-cycle cost by using less cement and increasing strength and durability (Baron and Douvre 1987); and (4) ecologically, because using less cement can decrease carbon dioxide and mono-nitrogen oxide emissions and save fossil fuels and mineral resources (Bonavetti et al. 2003).
2
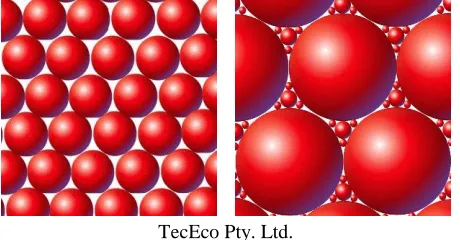
[image:17.612.193.423.72.192.2]TecEco Pty. Ltd.
Figure 1. Single size particle packing (left) and three size particle packaging (right)
Such particle packing helps the uniform distribution of cementitious materials, thereby
accelerating their hydration. As shown in Figure 2, instead of the skeleton where the forces are transmitted at the aggregate interfaces in normal strength concrete (NSC), small aggregate particles for ultra-high-performance concrete become inclusions in a continuous matrix.
Walraven 2002
Figure 2. Force transfer in normal strength concrete (left) and in ultra-high-performance concrete (right)
The stress at the aggregate interface is greatly reduced and the forces are transmitted more uniformly (Richard and Cheyrezy 1995, Schmidt et al. 2003, Schmidt and Fehling 2005) to produce stronger concrete.
In this research, we developed high-performance mixtures utilizing limestone fines (LF), a by-product from the aggregate industry, as a pavement repair material. Our approach to the development of a new high-performance mixture was based on the chemical interactions and particle packing of concrete materials. The materials studied mainly included portland cement (PC), fly ash (FA), limestone fines (LF), silica fume (SF), and river sand (RS). In addition, a high-range water reducer (HRWR) was used to improve the self-consolidating ability of the concrete. Our rationale was that these individual materials have different chemistry and particle size distributions and could integrate and compensate each other to form a new material with optimal chemistry and density. Through synergizing these materials and tailoring their mix
[image:17.612.185.424.307.456.2]proportions, the new high-performance mixture has the ability to self-consolidate, has high early strength, excellent bond strength with substrates, and long-term durability.
1.2 Objectives
Our approach to the above-mentioned limestone fines-based, rapid set, high-performance mortar (HPM) development is based on the chemical interactions and particle packing of materials. In this study, the focus was mixture design development and laboratory performance evaluation. The following specific objectives were pursued in the study:
1. To study the chemical and physical interactions between limestone fines, cementitious materials, and chemical admixtures
2. To develop a mix design methodology for a HPM, based on the optimization of the chemical and physical particle interactions
3. To evaluate the key mechanical and durability properties of the HPM
4. To investigate the applicability and performance of the HPM for concrete repair
1.3 Scope
4
2 MATERIALS AND MIXING METHODS
2.1 Materials
[image:19.612.182.429.198.403.2]The materials considered for the development of the HPM are Type I portland cement, silica fume, Class F fly ash, limestone fines, and river sand. The particle size distributions of the fine materials measured by laser diffraction are shown in Figure 3.
Figure 3. Particle size distribution of portland cement, fly ash, and limestone fines
In the case of silica fume particles, their very small size makes them susceptible to
agglomeration. This makes the measured size distribution dependent on the degree of dispersion achieved. The size distributions of the SF used in this study, at three different degrees of
Figure 4. Particle size distribution of SF tested by laser diffraction under three degrees of dispersion: no dispersion – tested as is, partially dispersed – sonicated with surfactant, and
well dispersed – sonicated for 180 seconds with surfactant
The first test involved measuring without applying any dispersion method on the SF sample (no dispersion). The second test was sonicated with a surfactant (partially dispersed). The third was sonicated for 180 seconds (well dispersed). The average particle size of the SF is often reported as 0.1 m. The average particle sizes measured with no dispersion, partially dispersed, and well-dispersed conditions are 34.25 m, 5.92 m, and 0.115 m, respectively.
6
Two types of substrates representing old concrete to be patched were used in this study. One substrate was C-3WR-C20, which is a typical pavement mixture (w/b=0.42). Another type of substrate used was O-4WR, which is a high-strength concrete mixture (w/b=0.33) used for bridge decks. The coarse aggregate for the substrates was crushed limestone. C-3WR-C20 has a 1 in. nominal maximum size aggregate (NMSA) meeting size number 57, as described in ASTM C33, while O-4WR aggregates have a 1/2 in. NMSA that meet Gradation No. 6 in the Iowa Department of Transportation Specifications. The particle size distributions of the coarse aggregates are given in Figure 5. The mix proportions of the substrates are given in Table 1. Except for Class C fly ash in the C-3WR-C20, the types of cementitious materials and fine aggregate used in the substrates are the same as those in the developed rapid repair mixture.
Table 1. Mix proportions of substrates (mature concrete to be patched)
Cement (pcy) Fly Ash (pcy) Water (pcy) River Sand (pcy) Coarse Aggregates (pcy) AEA (fl oz/cwt) NRWR (fl oz/cwt)
C-3WR-C20 455.0 113.8 244.9 1363.1 1707.3 0.50 3.0
O-4WR 824.6 269.3 1381.3 1418.0 0.75 3.5
High-range water reducers, normal-range water reducers (NRWRs), and air entraining admixture (AEA) were used in the different mixtures in this research. The HRWR and NRWR used was the Glenium 7500 and Pozzolith 322N by BASF Master Builders Solutions, respectively. The air entraining admixture was AEA 92 by Euclid Chemicals. The high-range water reducer was used in the development of the rapid repair concrete. The normal range water reducer and air
entraining admixture were part of the substrate mixtures.
Rapid-set concrete (RSC) mix from the CTS Cement Manufacturing Corporation was used to compare the new mixture to a commercial rapid repair material. RSC is a product that meets the Iowa Department of Transportation Materials I.M. 491.20 requirements for rapid set patch material for concrete repair. It is composed of 20 to 35 percent calcium sulfoaluminate cement and 65 to 80 percent silica sand. The recommended water for 60 pounds of RCS is 3.3 to 4.2 liters and 3.75 liters was used.
To complement the high compressive strength and improve volume stability of the newly developed rapid repair material, the addition of micro-steel fiber was explored. The micro-steel fibers were cold drawn with electroplated high-carbon steel wires and cut to form copper-coated steel straight fibers (13 mm in length and 0.2 mm in diameter) with a tensile strength of ≥ 2.85 GPa. Typical dosages range from 50 to 185 pounds of fiber per cubic yard of concrete.
2.2 Mixing Methods
material, or high-performance mortar, which was mainly composed of fine powders and had a low water-to-binder ratio (w/b) ratio. A three-stage mixing method was developed for this new rapid repair material mixture to ensure homogeneity. The third mixing method is for the RSC. RSC begins to lose its plasticity after a few minutes of being in contact with water and therefore has to be mixed quickly. These different mixing methods are presented below.
The mixer used for preparing C-3WR-C20 and O-4WR was a 3-cf drum mixer. The mixing procedure is as follows:
1. Combine the admixtures with 3/4 of the mixing water in a container
2. Place the coarse aggregates and the 3/4 of the mixing water with admixture in the mixer 3. Start the mixer rotation to create foam for air entrainment and rotate for about 30 seconds 4. Turn off the mixer and place the fine aggregates in the mixer
5. With the mixer rotating, scoop the cementitious materials into the mixer 6. Add the remainder of the mixing water
7. After having all the ingredients in the mixer, keep the mixer rotating for 3 minutes 8. Turn off the mixer for 3 minutes and cover the open end of the mixer with a damp cloth 9. Turn on the mixer again for a final mixing of 2 minutes
The mixer for the new rapid repair material can be either a mortar power mixer or a 5-gallon pan mixer. When a mortar power mixer was used, the motor was set at 180 revolutions per minute (rpm). The mixing procedure is as follows:
1. Combine the admixtures with 3/4 of the mixing water in the mixer
2. Place the cementitious materials in the mixer with the water and admixture 3. Start the mixer and let it run for 1 minute (Stage 1)
4. Stop the mixer and add the limestone fines
5. Start the mixer and let it run for 1 minute (Stage 2) 6. Stop the mixer and add the fine aggregates
7. Start the mixer and slowly add the remaining water and, if present, slowly add steel fibers into the mixture (Stage 3)
8. When all the ingredients of the mixture are in the mixer, run mixer for 3 minutes 9. Stop the mixer for 3 minutes and cover the open end of the mixer with a damp cloth 10.Turn on the mixer again for a final mixing of 2 minutes
8
3 SELECTION OF MIXTURE
3.1 Flowability and Compressive Strength
The proportion of the materials in the mixture was optimized based on flowability and 1-day compressive strength. The combinations of materials tested for optimization are given in Table 2.
Table 2. Mix proportions, flow, and 1-day compressive strength
No. Cement
Silica Fume Fly Ash River Sand Limestone Fines HRWR (ml/g)* Flow (in.) fc-1d (psi)
1 0.88 0.12 0.00 0.654 0.654 0.056 8.82 3173
2 0.84 0.16 0.00 0.654 0.654 0.066 7.95 3528
3 0.81 0.19 0.00 0.654 0.654 0.070 7.13 3130
4 0.77 0.23 0.00 0.654 0.654 0.069 6.89 2381
5 0.81 0.15 0.04 0.654 0.654 0.056 7.83 4000
6 0.77 0.15 0.08 0.654 0.654 0.056 8.31 4268
7 0.73 0.15 0.12 0.654 0.654 0.056 7.87 2998
*g is gram of total cementitious
The amounts of the materials are given in proportion to the total amount of binders (PC, SF, and FA) in the mixture. The water-to-binder ratio of the mixtures was 0.25, and both the RS-to-binder ratio and limestone fines-to-RS-to-binder ratio were 0.654. The first group, Mixes 1 through 4, had an increasing SF replacement for PC. The second group, Mixes 5 through 7, had a constant SF replacement but increasing FA replacement for PC. The optimal amount of SF was then determined based on the results of flowability and compressive strength results, as discussed below.
Figure 6. Filling of mold with rapid repair mixture
The mortar was so sufficiently flowable and self-leveling that consolidation by tamping was not required. After cleaning the sides of the mold and plate of any mortar spill or drippings, the mold was lifted in a continuous vertical motion (see Figure 7). When the spread of the flowing mortar on the plate stopped, the diameter of the mortar was measured by taking the average of two perpendicular directions.
Figure 7. Flow of rapid repair mixture
[image:24.612.208.403.384.583.2]10
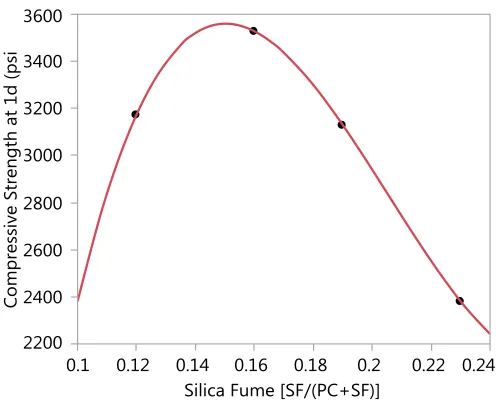
[image:25.612.181.430.70.271.2](compressive strength at 1d (psi) = 5780.3363 - 13754.167×silica fume - 197142.86×(silica fume-0.175)^2 + 2166666.7×(silica fume-0.175)^3)
Figure 8. Compressive strength of mixtures with different amounts of SF replacement
As shown in Table 2, the dosage of HRWR used in Mixes 1 through 4 increased with the increasing SF replacement. However, the flow of the mixtures still decreased with increasing replacement of SF. It is possible that the reduced strength of Mixes 3 and 4, in comparison to that of Mix 2, may be related to their reduced flowability for self-consolidation. This confirmed that the mix with 15 percent SF is considered optimal for both 1-day strength and flowability.
As SF replacement was kept as 15 percent, the effects of the amount of FA on 1-day strength and flowability on the mortar mixture were further investigated. Results from Mixes 5 through 8 in Table 2 show that further replacement of PC with FA can further increase the strength. The optimum amount of FA was found to be 8 percent, in combination with 15 percent SF replacement. The flow results were also found to be highest with the same combinations of cementitious materials. Based on the results of the compressive strength and flow tests, Mix 6 was selected for further testing as a candidate of the rapid repair material. Mix 6 is also re-designated as HPM in the rest of the report.
3.2 Particle Packing Analysis
Optimal packing of particles in cement-based mixtures generally provide the cement system with minimal porosity. In the case of concrete, an optimum packing of aggregate particles can
It should be noted that sufficient lubrication should also be present between the particles to reduce interparticle friction and collision and obtain good flowability. For concrete, this lubrication between aggregate particles can result from the properties and amount of paste
(binder and water). For the paste, it would be the amount of water. Since binder particles are very small and easy to agglomerate, dispersants such as a HRWR can help release the water that is trapped in the agglomerates and contribute to lubrication.
The particle packing model used in our analysis of the rapid repair mixture was the modified Andreasen & Anderson (A&A) model (Funk and Dinger 1994). The continuous packing model, expressed as the percent of volume of particles (Pt) smaller than particle size d while dmax and
dmin denote maximum and minimum particle sizes, is shown in the following equation:
mi n
max mi n
q q
t q q
d d P d d (1)
Exponent q (the distribution modulus) controls the character of the generated mix regarding its fineness of grain. The value for q typically ranges from 0.4 to 0.5. Increasing the value of q
generates an ideal packing distribution for particles with a greater number of larger-sized particles, and the opposite is true for a smaller q. When analyzing the packing of particles, the difference between the Pt-actual (actual particle size distribution curve) and the A&A model curve (expressed as Pt) should be minimal to have optimum packing. The difference can be quantified
by taking the sum of the squares of the residuals between the two curves. This can be expressed as the following equation:
2t actual t
RSS
P P (2)In the packing analysis of Mixes 1 through 7 in Table 2, the maximum particle size is taken as the nominal maximum size of the combined materials/particles. The nominal maximum size is typically the particle size within range of 95 to 85 percent of Pt. The actual nominal maximum
size of the actual material is thus taken as the size at 90 percent of Pt-actual.
12
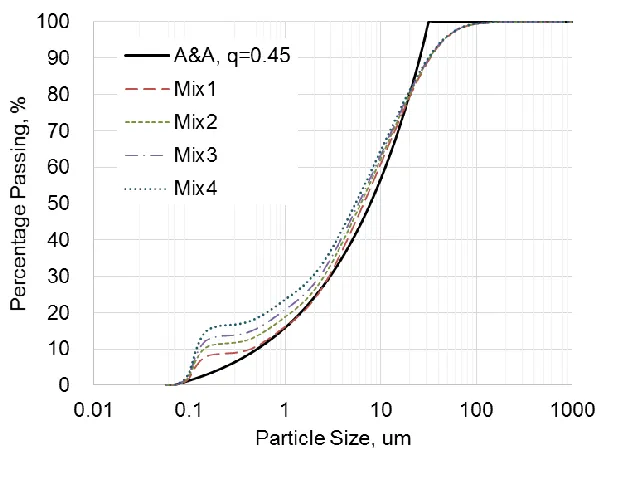
Figure 9. Particle size distribution of combined powders containing PC, SF, and LF for Mixes 1 through 4 and the A&A model
Using the A&A model curve where q=0.45 as a reference distribution, it can be observed that the increase in SF replacement causes an upward shift in the Pt-actual curve due to an increase in finer particles. It can be reasoned that as Pt-actual shifts upward, it may fit a better distribution when Pt
has a lower q (e.g., q<0.45). Thus, Table 3 lists the distribution modulus for Pt that gives a minimum residual sum of squares (RSS) for the Pt-actualof a mix and the corresponding RSS.
Table 3. Distribution modulus for Pt that gives a minimum RSS for the Pt-actual of a mix and
the corresponding RSS
Mix No. q RSS
1 0.42 592
2 0.38 710
3 0.34 862
4 0.30 1139
5 0.39 667
6 0.39 659
7 0.39 654
This infers that the high compressive strength at 16 percent SF replacement is mainly due to SF’s high pozzolanic reactivity, rather than contributions from the particle packing.
[image:28.612.151.464.162.392.2]The particle size distribution curves of Mix 2 and Mixes 5 through 7 with the A&A model curve (q=0.39) are shown in Figure 10.
Figure 10. Particle size distribution of combined powders containing PC, SF, FA, and LF for Mix 2, Mixes 5 through 7, and the A&A model with magnified region inset
The distribution modulus that leads to a minimum RSS for Mixes 5 through 7 is equal to 0.39. The RSS values for Mixes 5 through 7 are also in Table 3. It can be seen that the inclusion of FA in the mortar mixtures (Mixes 5 through 7) decreased RSS (as compared with Mix 2). It shall be noted that although the increased FA replacement in the mixtures only made small changes in the particle size distribution curve and RSS values, as shown in Figure 10 and Table 3, such small increases in packing may have contributed to the increase in 1-day compressive strength of Mixes 5 and 6 when compared to Mix 2 (see Table 2). Although having good particle packing, Mix 7 had much lower 1-day strength when compared to Mixes 5 and 6, probably due to the slow hydration of the larger amount of FA in the mix. As a result of the particle packing study, Mix 6 is considered as the final HPM.
3.3 Heat of Hydration and Setting Time
14
The first two mixtures selected for the isothermal calorimetry tests were the paste from the HPM (Mix 6 in Table 2 without river sand), with and without LF. The comparison of these two
mixtures gives insight to the role of LF on HPM’s hydration process. The effects of
supplementary cementitious materials (SF and FA) on heat of hydration were not studied since they have already been well-documented (Ma et al. 1994, Wang et al. 2006). The third mixture was the paste from the C-3WR-C20, the proportion of which is given in Table 1, with the fine and coarse aggregates excluded. The result from the C-3WR-C20 serves as a base for
comparison between the rapid repair mixes and conventional pavement concrete mix. The fourth mixture was the mortar sieved from the RSC (but note that the mortar was used in the test since the paste was unable to be obtained from this pre-packed commercial mix).
The calorimeter used was an 8-channel isothermal calorimeter manufactured by Thermometric Inc. Enclosed in a temperature control chamber, each channel measures heat flow from an individual sample independently. When a sample is placed in the calorimeter, the heat produced by the sample flows to the aluminum sample holder and towards a heat flow detector. The difference in heat detected between the sample sensor and the reference sensor created a voltage signal proportional to the heat flow. The voltage signal is then converted to the rate of heat evolution by applying a calibration factor. The calibration factor was obtained following the procedure described by Wang et al. (2007).
To perform the test for a given paste/mortar mix, 50 grams (g) of dry materials and the
corresponding amount of water and admixtures were prepared for each measurement. The dry and liquid ingredients were placed in separate cups and placed in the calorimeter for 24 hours to condition them to the designed initial temperature (20°C). It is expected that after 24 hours, the temperature in the chamber should be 20°C and there shall be no heat flow from the samples in the chambers. After the conditioning, the dry and liquid samples were taken from the
calorimeter, mixed, and placed quickly back into the calorimeter. Data from the sample heat generation was then recorded for at least 48 hours. The rate of heat generation in mW per gram of cement (mW/g) was calculated using the following equation: where R is the calorimeter data reading in mV, B is the calibrated base line in mV, CF is the calibration factor in mW/mV ranged between 14.21 to 16.16 mW/mV, ws is the mass of sample in grams, c is the mass of cementitious materials in grams, and w is the mass of water in grams.
1
R B CF P w ws c
(3)
Figure 11. Rate of heat generation of pastes from rapid repair materials in the HPM with and without limestone fines, RSC, and conventional concrete C-3WR-C20 at 20°C
The peak rate of heat generated by the HPM is seen to be lower than the C-3WR-C20. This is likely due to the lower w/b ratio (RILEM 42-CEA 1981, Byfors 1980) and slightly higher percentage of supplementary cementitious materials. Paste with a higher w/b ratio has greater microstructural space and a larger amount of water available for hydration, thereby facilitating heat generation of hydration. It can also be seen in Figure 11 that the addition of LS into HPM reduces the time to reach the peak rate of heat generation. Research has shown that fine LS can have a nucleating effect on the hydration process and can also react with FA, thus increasing the rate of hydration (Bentz, et al. 2015). This demonstrates that the use of LS is beneficial to the development of a rapid repair material. For the mortar sample sieved for the RSC, the rate of heat generation can be described as a surge, which is 10 times higher than that of the C-3WR-C20 or HPM at a very early age and with a very short duration. The first peak rate of heat generation of the RSC is at 25 minutes after mixing, and the second and higher peak occurs at 120 minutes. This coincides with the rapid setting and strength gain of RSC, which sets at about 25 minutes after mixing.
Set times of the HPM, RSC, and C-3WR-C20 were measured according to ASTM C403.
Samples tested were mortars sieved from freshly mixed concrete using a #4 mesh size sieve. The mortar samples were then placed in a cylindrical vessel and covered with a wet cloth between readings. Penetration readings were taken in given time intervals until the final set was reached. The initial setting (IS) time is the time when the penetration resistance of the tested sample equals 500 psi, and the final setting (FS) time is the time when the resistance reaches 4,000 psi. The test results are given in Figure 12.
0 10 20 30 40 50 0 1 2 3 4 5
0 6 12 18 24 30 36 42 48 RSC
Rate of Heat
G enerati on Rat e o f Hea t Gen e ra ti o n (mW /g) Time (hrs) C-3WR-C20
HPM no LS
16
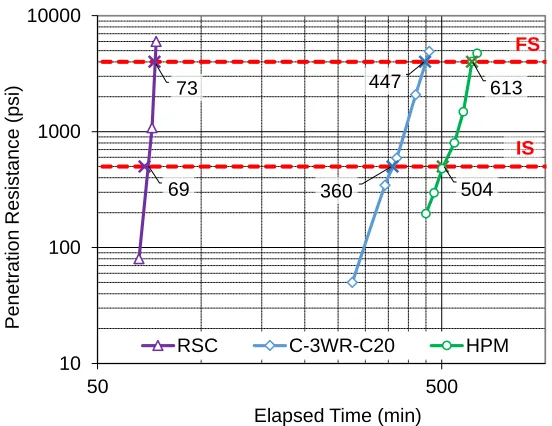
Figure 12. Penetration resistance of the HPM, RSC, and C-3WR-C20, indicating initial set time (IS = 500 psi) and final set time (FS = 4,000 psi)
As seen in Figure 12, the order of set time, form fast to slow, of the tested samples is the RSC, C-3WR-C20, and HPM. The IS and FS times were 504 and 613 minutes (8.40 and 10.22 hours), respectively, for the HPM, while for the C-3WR-C20 the times were 360 and 447 minutes (6.00 and 7.45 hours). That is, there was about a 2.5 hour delay in set times for the HPM when
compared with the C-3WR-C20. The interval between the FS and IS times was 109 minutes for the HPM and 84 minutes for the C-3WR-C20. For the RSC, the IS and FS times are 69 and 73 minutes (1.15 and 1.22 hours), respectively, which was about 5 to 6 hours earlier than those of the C-3WR-C20. It can also be observed that the IS and FS times for the RSC are only 4 minutes apart. If it is rounded off to the nearest 5 minute mark, as specified in ASTM C403, such a difference (of 4 minutes) would not be sufficient to distinguish between IS and FS. It should be noted that RSC was designed to be ready for traffic loads in 1 hour.
504 613 69 73 360 447 10 100 1000 10000 50 500 P e n e tra tio n Resista n ce (psi)
Elapsed Time (min)
RSC C-3WR-C20 HPM
FS
4 MECHANICAL PROPERTIES
4.1 Compressive Strength and Elastic Modulus
The compressive strength development and elastic modulus in compression of the HPM, RSC, and C-3WR-C20 were measured following AASHTO T 22 (ASTM C38) and ASTM C469, respectively. The strength development determines the ability of the new mix to timely gain the needed strength and rigidity for immediate service. Three cylinder samples were prepared for each testing day. The samples tested were 4 in. (diameter) × 8 in. (height) cylinders. The test days were 1, 3, 7, and 28 days after casting. The samples were stored in a moist curing room until testing. Also tested was a variation of the HPM, where microfibers were added in the mixture. This mixture type was designated as HPM-f. The amount of microfibers added was 70 pcy.
Figure 13 and Figure 14 show the compressive strength and elastic modulus of the mixes.
Figure 13. Compressive strengths of the HPM without and with steel fibers, RSC, and C-3WR-C20 at 1, 3, 7, and 28 days
18
Figure 14. Elastic modulus of the HPM, HPM-f, RSC, and C-3WR-C20 at 1, 3, 7, and 28 days
Figure 14 shows that the elastic modulus of the HPM was higher than that of the C-3WR-C20 at 1 day, lower than that of the C20 at days 3 and 7, but comparable to that of the C-3WR-C20 at 28 days. The elastic modulus of the HPM-f began high and maintained its value until the 28th day. The elastic modulus of the RSC was much higher than that of the C-3WR-C20 at 1 day, but it quickly decreased and became much lower than that of the C-3WR-C20 at 28 days. These results suggest that used as a repair material for substrate concrete C-3WR-C20, the HPM/HPM-f is much better in compatibility than the RSC. The reduction of an elastic modulus in the RSC may be due to an extended period of saturation that occurs during curing.
4.2 Modulus of Rupture
Most unreinforced concrete members depend on rupture or flexural strength to sustain imposed loads. For unreinforced pavements in particular, loads landing near the edge or corner of slabs impose rupture stresses at the top section. The modulus of rupture at the different ages of the HPM, HPM-f, RSC, and C-3WR-C20 were measured using AASHTO T 97 (ASTM C78) or simple beams with third-point loading. The beams prepared for the tests were 3×3×11 in. and were kept under moist curing until testing. The tests were conducted at 1, 3, 7, and 28 days after casting.
Figure 15. Modulus of rupture of the HPM without and with steel fibers, RSC, and C-3WR-C20 at 1, 3, 7, and 28 days
The modulus of rupture of the HPM was similar to that of the RSC at 1 day. The modulus of rupture for the HPM continuously increased with time, up to twice that of the C-3WR-C20 at 28 days. The RSC, on the other hand, had a modulus of rupture value of about 40 percent higher than that of the C-3WR-C20 at 1 day but about 30 percent lower than the C-3WR-C20 at 28 days due to a slight decreasing trend with time. The modulus of rupture of the HPM-f is consistently higher than that of the HPM due to the presence of steel microfibers. Based on the modulus of rupture and compressive strength test results at 28 days, the HPM is also a potential repair material for higher strength concrete.
4.3 Slant Shear Strength
One of the important mechanical properties of a patch repair material is its ability to adhere to an existing concrete. A good bond between the repair material and the existing concrete facilitates restoration of load carrying capacity and performance. The most common test method for measuring bond strength for repair materials is ASTM C882. This test measures the shear strength of a bond between materials by applying a compression load on cylinder samples, thereby not requiring special equipment for the test.
20
Figure 16. Slant shear sample composed of sandblasted substrate (left) and substrate (lighter color) and patch material combined as a 4 by 8 in. sample (right)
The substrate used in the present study was made using the C-3WR-C20. It was first cast as a whole 4 by 8 in. (height) cylinder. The cylinder were cured moist for 28 days and was then cut diagonally to conform to the dimension requirements of ASTM C882. The cut samples were then sandblasted until a difference between the limestone aggregates and the mortar on the surface of the sample was distinguished. To cast the repair material on the substrate, the cylinder halves were placed in a 4 by 8 in. cylinder mold and were pre-wetted with a wet towel. Freshly mixed repair materials were then cast on the substrate. The RSC repaired samples were vibrated on a vibrating table for 10 seconds, while the HPM repaired samples were only tapped on the sides of the cylinder to ensure sufficient filling inside the mold since the HPM is self-consolidating. The repaired cylinders were removed from the mold after 24 hours and placed under moist curing until tested.
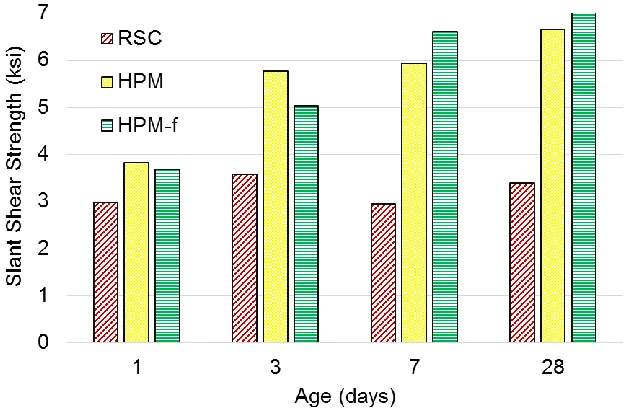
Figure 17. Slant shear strength of HPM without and with steel fibers and RSC at 1, 3, 7, and 28 days
One day after casting, the slant shear strength of the HPM, HPM-f, and RSC were 3,817, 3,680, and 2,971 psi, respectively. The mode of failure was all at the interface (i.e. a bond shear failure). At 3 days and later, the slant shear strength of the HPM and HPM-f was greater than 5,000 psi and continuously increased with time. During this time period, the failure of the substrate governed the strength of the HPM and HPM-f samples. Differently, the slant shear strength of the RSC didn’t go beyond 3,573 psi during the 28-day testing period, and the sample
continuously failed at the patch-substrate interface, which indicated a weak bond (see Figure 18).
[image:36.612.149.464.75.282.2]
Figure 18. Typical slant shear failure modes: bond interface failure with the two halves separating at the interface (left) and substrate failure where the substrate cracks and
22 4.4 Direct Pull-off Strength
The direct pull-off strength test follows ASTM C1583. Different from slant shear strength, the direct pull-off strength test measures the tensile capacity of the bond between the substrate and the patch material. This type of failure may occur at the tension side of a bending deformation. In the tensile loading case, the contribution surface roughness interlocking between the substrate and patch into strength is diminished. What is measured is how strong the two materials adhere to each other.
Two types of substrates were prepared for the test: the C-3WR-C20 and O-4WR. The 6×6×21 in. molds were prepared by first placing a 2×6×21 in. polystyrene foam board at the bottom of the mold. This left a 4 in. thick space to form the substrate. The sides of the mold and the
polystyrene were oiled and filled with concrete. The concretes were consolidated with an internal vibrator. The top surface was troweled and covered with a plastic sheet and a wet cloth until demolding. The slabs were demolded after 24 hours and were placed under moist curing for 28 days. At the end of moist curing, one side of the slabs was sandblasted in the same procedure as the slant shear substrates, as shown in Figure 19.
[image:37.612.74.542.333.506.2]
Figure 19. Sandblasting of samples for bond test: slant shear substrates on a pallet that is bordered with 4×6×21 in. substrate slabs (left) and actual sandblasting of substrates (right)
Figure 20. Slab surfaces: sandblasted surface (left) and troweled surface without sandblasting (right)
The substrate slabs were placed inside the 6×6×21 in. molds. Since the slabs are only 4 in. thick, there was a 2 in. space for casting rapid repair mixtures. Before casting the rapid repair mixtures, the substrate surface was moistened. The mixtures of HPM, HPM-f, and RSC were mixed and placed on the substrates. Before the mixtures were placed, the substrates were either grouted or not grouted. Grouting is the process by which a stiff brush is dipped in a rapid repair mixture and brushed on the substrate. After placement, the freshly placed mixtures were covered with a plastic sheet and wet cloth until demolded. The slabs were demolded 16 hours after casting. The patch and substrate were cut with a 2 in. core drill bit, to be able to conduct the pull-off tests. The drill bit went through the depth of the patch and 1 in. into the substrate, as shown in Figure 21.
Repair mixture
Substrate
Tensile loading device
[image:38.612.129.511.447.663.2]24
Four circular cuts were made on each slab. The first cut was made after demolding, while the remaining cuts were made on the third day. Two samples were made for the test. When the slabs were not being tested, they were placed in moist curing.
On the day of direct pull-off testing, the steel disk and loading device were mounted on the rapid repair mixture, as previously shown in in Figure 21. The procedure for mounting and testing is listed as follows:
1. Remove water on the patch surface and in the circular cut. Lay the sample on its side and blow the surface and the inside of the circular cut with pressurized air.
2. Scrub the surface of the cylinder (concrete bound by the circular cut) with a steel brush to remove any loose materials and roughen the surface. Blow the surface with pressurized air to remove debris.
3. Ensure that the bottom of the steel disk that will be facing the rapid repair mixture is clean. Epoxy (or cylinder) from previous tests may be removed by heating the steel disk on a hot plate and scraping the epoxy using a steel spatula. Use proper protective clothing and equipment when handling the heated steel disk. Use sand paper to remove any remaining small fragments that cannot be removed using a steel spatula.
4. Mix the two-part epoxy and apply a film on both the patch surface and the steel disk.
5. Place the steel disk on the patch material. Ensure that there are no gaps between the steel disk, epoxy, and the patch material. Do not let any excess epoxy flow down the circular cut. Scrape excess epoxy using a craft stick.
Copyright © 2013, ASTM International
Figure 22. Failure modes
It is important to mount the steel disk in a secure and timely manner. Most epoxies require a curing period of 24 hours, even with a short (5 minute) setting time. After testing several types of epoxies, it was found that a repair and anchoring epoxy (i.e., PC-Concrete) provided timely strength gain for 1-day testing of the bond. The pull-off bond strength of the epoxy was tested by bonding the steel disk to concrete. A cut with a core drill bit was not made to increase the chance of epoxy failure, as shown in Figure 23, as opposed to concrete tensile failure.
Figure 23. Testing of epoxy: steel disk epoxied to an uncut concrete surface (left), epoxy failure after direct-pull off test (center), and concrete failure due to good epoxy bond
Mode a: Failure in substrate
Mode b: Bond failure at substrate/repair material interface
Mode c: Failure in repair
material
Mode d: Bond failure at
[image:40.612.105.512.439.620.2]26
4.4.1 Pull-off Strength between Repair Materials and C-3WR-C20 Substrates
[image:41.612.138.473.154.373.2]The pull-off strengths for rapid repair mixtures, where the substrates were not grouted, are given in Figure 24.
Figure 24. Pull-off strength of rapid repair mixtures with sandblasted but not grouted C-3WR-C20 substrates where (a) shows substrate failure and (b) shows bond failure
The mode of failure is noted by the letters in the graph bars. The letters are defined in Figure 22. The pull-off strength of the HPM was much greater than the RSC at 1 day after casting.
However, the pull-off strength of the HPM decreased over time. It is not clear why decreased pull-off strength of the HPM and RSC samples was observed and might be related to the balance between the shrinkage of the repair materials and bond strength development. Although
decreasing with time, the pull-off strength of the HPM samples were always higher than that of the RSC samples. Moreover, the pull-off strength of the HPM-f at 1 day was similar to that of HPM at 1 day and was maintained during the testing period (up to 28 days). Since the only difference between the HPM and HPM-f was the presence of steel fibers in the HPM-f, this implied that shrinkage of the HPM caused a reduction in the bond/pull-off strength. As discussed later, the HPM-f had a reduced amount of shrinkage compared to the HPM.
Figure 25. Pull-off strength of rapid repair mixtures with sandblasted and grouted C-3WR-C20 substrates where (a) shows substrate failure and (c) shows repair material failure
It can be observed that with grouting, the bond between the rapid repair materials and the substrate was stronger; therefore, higher pull-off strengths were obtained from the samples with grouting compared to the samples without grouting. During grouting, the repair material was scrubbed into the substrate and permeated into the substrate and filled surface pores and voids, thus providing a better bond between the repair material and the substrate. Therefore, bond failure was no longer observed, and the decrease in the pull-off strength was minimized. Based on the mode of failures observed, tensile failure was initiated at the repair material when the RSC was used for repair, whereas the C-3WR-C20 substrate fracture governed the failure when the HPM was used for repair.
4.4.2 Pull-off Strength between Repair Materials and O-4WR Substrates
28
Figure 26. Pull-off strength of rapid repair mixtures with O-4WR substrates showing (a) substrate failure and (b) bond failure
It can be observed that the pull-off strength values between the repair materials studied and O-4WR substrate were all higher than those between the corresponding repair materials and C-3WR-C20 substrate at a given testing age.
The sandblasted and grouted samples provided the highest pull-off strengths. Sandblasting made a high surface roughness, and grouting pushed the rapid repair material into the rough dens, which created a strong grip between the two materials. It can be noted that bond failure occurred at 1 day. In this case, the substrate was stronger than the rapid repair material. At 3 and 7 days, the failures were observed at the bond or at the substrate. During this time, the strengths of the HPM and strength of the substrate were similar. At 28 days, the failure occurred completely at the substrate, since the HPM was stronger than the substrate.
The lowest pull-off strength was obtained from substrates without sandblasting and grouting, where the surface pits and voids were shallower. Without grouting, the amount of material that could interpenetrate at the interface was also less. However, the pull-off strength at 28 days without sandblasting and without grouting increased to the level of with sandblasting and grouting. At the early ages of 1, 3, and 7 days, bond failures were observed, but at 28 days, substrate failures were observed. This implies that with sufficient curing, a strong bond was developed between the HPM and the substrate. Although the bond strength was low at the early age, the samples without sandblasting also developed sufficient bond strength over the curing period.
5 DURABILITY PROPERTIES
5.1 Cyclic Freezing and Thawing
[image:44.612.173.428.266.464.2]The durability of the HPM, HPM-f, RSC, and C-3WR-C20 to cyclic F-T was measured according to ASTM C666, Method B. Two 3×4×16 in. prisms were prepared for each mix. Of the four mixes, only the C-3WR-C20 was air entrained. The RSC was prepared by simply mixing the pre-packed mixture with water. The HPM and HPM-f were intentionally mixed without adding air entraining admixture. The prisms were moist cured for 28 days before being subjected to F-T cycles. The tests were conducted until 300 cycles were reached. The durability factor, mass loss, and pictures of the prisms after the test are shown in Figure 27, Figure 28, and Figure 29, respectively.
Figure 27. Durability factor of concrete prisms under cyclic F-T test
It can be seen from Figure 27, the HPM and HPM-f mixes are F-T durable, even without air entrainment. There was no significant change in relative dynamic modulus measured for the prisms made with the HPM and HPM-f mixes. However, the durability factor of the C-3WR-C20 reduced to 90 percent, while on the other hand the RSC reduced to 80 percent after 300 F-T cycles.
30
Figure 28. Percent mass loss of concrete prisms under cyclic F-T test
The mass reduction can be visually evaluated in Figure 29, and the loss in mass from the RSC is significant.
[image:45.612.85.530.349.680.2]
The results indicate that the F-T deterioration of concrete repaired using the HPM and HPM-f mixes would not initiate from the rapid repair material. On the other hand, if F-T durable
concrete is patched with the RSC, the repaired concrete would be susceptible to F-T deterioration and would likely be needing re-repair on the same area as the patch.
5.2 Shrinkage
[image:46.612.190.422.289.467.2]Shrinkage of a repair material often causes the failure of the bond between the substrate and repaired concrete, as substrates are commonly matured and do not shrink further. Therefore, the amount of shrinkage of the rapid repair materials was measured in the present study. Two types of shrinkage were measured for the HPM, HPM-f, RSC, and C-3WR-C20: autogenous shrinkage and free (unrestrained) drying shrinkage. The autogenous shrinkage was measured following ASTM C1698. The autogenous shrinkage device requires the use of corrugated plastic tubes (see Figure 30).
Figure 30. Corrugated plastic tubes used in autogenous shrinkage device
32
Figure 31. Length change due to autogenous shrinkage of the HPM, HPM-f, RSC, and C-3WR-C20
The results showed that the HPM had higher autogenous shrinkage than the C-3WR-C20 during its first early age, while autogenous shrinkage of the RSC was minimal. The addition of fibers reduced the amount of autogenous shrinkage. It should be noted that the binder for the RSC was calcium sulfoaluminate while the binder for the HPM and C-3WR-C20 was predominantly portland cement. The high autogenous shrinkage of the HPM resulted from the continued hydration of portland cement at a very low w/b (0.25), which resulted in self-desiccation in the system.
The free drying shrinkages of the HPM, HPM-f, RSC, and C-3WR-C20 were measured
Figure 32. Drying shrinkage samples
The calculated percent change in length and weight were presented in two ways: the changes due to drying only and the changes due to moist curing and drying, which showed the swelling behavior of the mixes during moist curing or wetting. Figure 33 and Figure 34 show the percent length and weight changes during drying.
[image:48.612.170.441.362.569.2]34
[image:49.612.167.442.388.599.2]Figure 34. Weight change due to drying of the HPM, HPM-f, RSC, and C-3WR-C20
Figure 35 and Figure 36 shows the total length and weight changes that include the moist curing period and the drying period, respectively. All percentage calculations are based on the length and weight obtained immediately after demolding.
Figure 36. Total weight change due to moist curing and drying of the HPM, HPM-f, RSC, and C-3WR-C20
The following can be observed from Figures 33 through 36:
The RSC, consisting of calcium sulfoaluminate cement as a binder, showed significant extension/swelling and weight gain during moist curing, followed by the C-3WR-C20, while the HPM and HPM-f showed substantial shrinkage and a little weight gain during moist curing (see Figures 34 and 36).
Among all the mixes tested, the RSC had the lowest free drying shrinkage (see Figure 33) but the highest weight loss (see Figure 35) during drying. One possibility is that the RSC might have a high porosity, which allowed water to easily move in and out, thus resulting in a small effect on volume change. Further study on this commercial repair material is needed.
The HPM and HPM-f had a much higher drying shrinkage than the RSC but less drying
shrinkage than the C-3WR-C20 (see Figure 33). Different from those in autogenous shrinkage, fibers in the HPM-f had little effect on the free drying shrinkage of the HPM.
36
mixes had an intermediate value of drying shrinkage, which was probably related to their fine pore structure provided by a low w/b (0.25) of the mixes.
The C-3WR-C20, which had lower portland cement content, higher w/b, and higher coarse aggregate content than the HPM, displayed a noticeably higher drying shrinkage and a much higher weight loss during drying. It shall be noted that although the weight loss, resulting from water evaporation, of the C-3WR-C20 was much higher than that of the HPM, the drying shrinkage value of the C-3WR-C20 was only a little higher than that of the HPM. This once again indicates that it is not the amount of water evaporated but the pore structure of the concrete materials that primarily controls the degree of their shrinkage. Therefore, further study shall be conducted on the pore structure of the materials.
The order of the total shrinkage (autogenous and free drying shrinkage) of the mixes studied, from lowest to highest, was RSC, C-3WR-C20, HPM-f, and HPM.
5.3 Permeability
Two types of permeability measurements were conducted. The first test was the rapid chloride permeability (RCP) test, which determined the electrical conductance of a sample to provide an indication of its resistance to the penetration of chloride ions, according to ASTM C1202. The RCP test samples included 4×8 in. cylinders that were moist cured for 28 days. The cylinders were cut into 2 in. disks and were vacuum saturated and mounted on test cells, based on ASTM C1202. Three disks from three cylinders were tested for each mixture type. The HPM-f was not tested due to the presence of micro-steel fibers, which are conductive.
The second test was a surface resistivity (SR) test (ASTM WK37880), which is considered as an alternative to the RCP test. The device for measuring the surface resistivity is a Wenner 4-electrode probe with 1.5 in. spacing. The samples were 4×8 in. cylinders. The samples were moist cured for 28 days after casting, when the samples were tested. The samples were wiped with a cloth to make the surface saturated surface dry prior to testing. The samples for RCP and SR were the same samples. The results of the tests are listed in Table 4.
Table 4. Rapid chloride permeability and surface resistivity of substrate and rapid repair mixtures
Rapid Chloride Permeability Surface Resistivity Charge Passed
(coulombs) Class
Resistivity
(k-cm) Class
HPM 18 Negligible 222 Negligible
RSC 2,550 Moderate 21 Moderate
C-3WR-C20 1,829 Low 17 Moderate
38
6 CONCLUSIONS AND RECOMMENDATIONS
6.1 Conclusions
A high-performance mortar can be achieved for rapid concrete repair using a high volume of industrial by-/co-products such as limestone fines, fly ash, and silica fume. The newly developed rapid repair HPM is highly workable, strong, and durable.
Particle packing has a significant influence on the early age strength of the newly developed HPM, analyzed by the modified A&A model (Funk and Dinger 1994). In addition to their pozzolanic properties, proper silica fume and fly ash replacements for portland cement can help adjust particle packing and improve the workability and strength of the mortar. In addition to serving as fine aggregate or filler, limestone fines also accelerate hydration of cementitious materials in the HPM.
The newly developed HPM possesses excellent self-consolidating ability: highly flowable, non-segregating, and no need for additional consolidation during casting.
The compressive strength and modulus of rupture of the HPM at 1 day are comparable to the corresponding properties of conventional pavement concrete at 28 days. This suggests that the new rapid repair mixture is applicable for patch repair (requires compressive strength) and full-depth pavement repair (requires both compressive and flexural strength). As a comparison, the commonly used pavement repair material—RSC— is a commercially available, pre-packed concrete with a 1-day compressive strength comparable to the 28 compressive strength of the normal strength substrate (C-3WR-C20), but its modulus of rupture after 1 day is much lower than that of the C-3WR-C20.
Sandblasted and grouted surfaces provides the best performance for bonding of a rapid repair material to a mature substrate. Differently, repaired concrete without sandblasting and/or grouting showed lower pull-off and slant shear strength in the present study. Slant shear strength values are generally higher than direct pull-off strength.
The HPM is of excellent F-T durability, without the requirement for air entrainment. The F-T durability factor of the HPM stayed around 100 percent throughout the standard F-T test. Differently, the RSC showed significant mass loss during the F-T test, and its F-T reduced to about 80 percent at the end of the F-T durability test.
The permeability of the HPM is extremely low (18 coulombs), which may contribute to its high F-T durability. Differently, the permeability of the RSC is much higher (2,550
coulombs).