R E S E A R C H A R T I C L E
Open Access
Identification and characterization of Dlc1
isoforms in the mouse and study of the biological
function of a single gene trapped isoform
Mohammad G Sabbir
1, Nichola Wigle
1, Shauna Loewen
1,2, Yuan Gu
1, Cordula Buse
1,2, Geoffrey G Hicks
1,2,
Michael RA Mowat
1,2*Abstract
Background:The Dlc1 (deleted in liver cancer 1) tumour suppressor gene codes for a RhoGTPase activating protein that is found inactivated in many tumour types. Several transcriptional isoforms have been described but the functional significance and tissue distribution of each form is presently poorly understood. Also, differences in the number of isoforms and splice variants reported still exist between different mammalian species. In order to better understand the number and function of the different variants of the Dlc1 gene in the mouse, we have carried out a detailed analysis. Extensive 3’ RACE experiments were carried out in order to identify all possible Dlc1 isoforms and splice variants in the mouse. In addition, we have generated a gene trapped mouse that targets one of these isoforms in order to study its biological function. The effect of this gene trap insertion on the splicing of other isoforms has also been studied.
Results:In addition to the known 6.1 and 6.2 Kb transcripts of Dlc1, our study revealed the existence of a novel 7.6 Kb transcriptional isoform in the mouse, which corresponds to the human 7.4 Kb (KIAA1723) cDNA transcript. A gene trapped embryonic cell line, with an insertion between Exon 1 and 2 of the 6.1 Kb transcriptional isoform, was used to generate a transgenic mouse. This line showed a significant reduction in the expression of the trapped isoform. However, reduced expression of the other isoforms was not seen. Mice heterozygous for the gene trapped allele were phenotypically normal, but homozygous mutant embryos did not survive beyond 10.5 days post coitum. Dlc1gt/gt embryos showed defects in the brain, heart, and placental blood vessels. Cultured serum-free mouse embryo cells from Dlc1 deficient embryos had elevated RhoA activity and displayed alterations in the organization of actin filaments and focal adhesions. The Dlc1 deficient cells also exhibited increased wound closure in anin vitroscratch assay.
Conclusions:The mouse has three major transcriptional isoforms of the Dlc1 gene that are differentially expressed in various tissues. A mouse with exon 1 of the 6.1 Kb transcript gt resulted in hypomorphic expression of Dlc1 protein and an embryonic lethal phenotype in the homozygous condition, which indicates that this isoform plays a major role in mouse development. The Dlc1 deficient cells showed altered cytoskeleton structure, increased RhoA activity and cellular migration.
Background
The Rho family of GTPases control several important cellular processes, such as cell shape, motility, division and survival through a series of biochemical networks [1,2]. RhoGTPases have long been implicated in tumourigenesis, as Rho activity is found to be increased
in transformed cells and is necessary for the transforma-tion by the Ras oncogene [3,4]. The Rho proteins act as molecular switches, cycling between an active GTP bound state and an inactive GDP-bound state [5]. The RhoGTPase activating proteins (RhoGAPs) down regu-late Rho by stimulating its intrinsic GTPase activity [6]. A significant number of RhoGAPs have been shown to have altered levels in a variety of human tumours and cell lines [7].
* Correspondence: [email protected]
1Manitoba Institute of Cell Biology, CancerCare Manitoba, 675 McDermot
Avenue, Winnipeg, MB R3E 0V9, Canada
The deleted in liver cancer 1 (Dlc1) gene encodes a RhoGTPase activating protein (RhoGAP) that has been found to be inactivated by deletion or promoter methy-lation in many tumours, resulting in alterations in cellu-lar proliferation, cytoskeleton reorganization and gene expression in tumour cells [8-15]. A recent study using representational oligonucleotide based microarray analy-sis showed that heterozygous deletion of Dlc1 occurred in ~50% of liver, breast and lung tumours and over 70% of colon cancers [10,16].
The Dlc1 RhoGAP is a multi-domain protein that contains a sterile alpha motif 2 (SAM2) interaction domain and a StAR-related lipid-transfer (START) domain [2,8,17-20]. The Dlc1 gene shows multiple tran-scription start sites and alternative splicing. In humans, three major transcriptional isoforms of the Dlc1 gene has been reported (for a review see [20]). The predomi-nant 6.3 Kb transcript of Dlc1 encodes a protein of 123 KDa [11]. The existence of proteins for the human mRNA isoforms of 3.7 Kb (AK025544) and 7.4 Kb (KIAA1723) have recently been verified by Ko et al. [21]. In mouse tissues, two principal transcripts of 6.5 and 5.5 Kb and a minor transcript of 7.6 Kb have been reported by Northern blotting [22], but the complete characterization and tissue specific expression of all the isoforms and splice variants of Dlc1 gene in the mouse has not yet been carried out.
In order to better understand the biological function of various isoforms of Dlc1, we have generated a mouse with one of its isoform variants targeted. We have also characterized the different transcriptional isoforms and their tissue specific expression in the mouse. The effect of this gene trap insertion on the other variants has also been studied.
Results
Identification, characterization and tissue specific expression of mouse Dlc1 mRNAs and protein
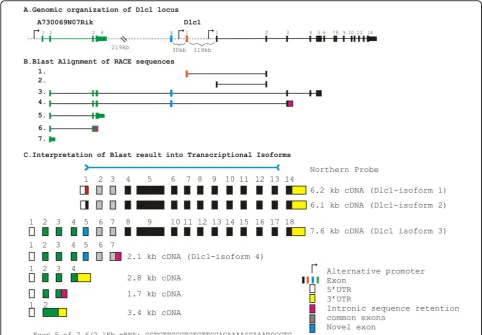
Extensive 3’RACE experiments were carried out in order to determine all possible isoforms and splice variants of the Dlc1 gene in the mouse (Figure 1). Transcripts 1 and 2 correspond to the two previously described tran-scripts of 6.2 and 6.1 Kb, which agrees with the current major translated transcripts (isoform-1 and 2, respec-tively) found in the Vega database (Version 3, 02/06/ 2008; Figure 1B). These two transcripts are controlled by two alternative promoters (Figure 1A). A previously described 2.8 Kb upstream transcript (AK053142) had not been linked to Dlc1 in the mouse; however, it shows partial homology to the human Dlc1 7.4 Kb transcript. We therefore included a primer for this transcript in our 3’RACE experiments. The regions of homology of tran-scripts 3 and 4 to the Dlc1 locus are shown in Figure 1B. These results show a linkage of this upstream 2.8 Kb
transcript with exon 2 of Dlc1, including a novel exon not previously reported. Based on these complimentary DNAs (cDNAs) and others, found in the databases, we predict that there is a 7.6 Kb transcript, which arises from a promoter greater than 220 Kb upstream from exon 1 of the 6.2 Kb Dlc1 transcript (Figure 1C). This 7.6 Kb transcript (GenBank accession No. GU1280500, iso-form-3) contains sequences in common with the pre-viously reported 2.835 Kb cDNA (AK048960). A second 2.1 Kb transcript (GenBank accession No. GU1280389, transcript-4) starting from the same promoter retains 160 bp of intronic sequence downstream of exon 3 of the 6.1 Kb transcript (Figure 1B and 1C). In addition, tran-scripts of 3.4, 2.8 and 1.7 Kb (Nos. 5, 6 and 7) from this same upstream promoter, that do not link to the Dlc1 gene, were also found (Figure 1B and 1C, GenBank acces-sion No. GU1280505).
To confirm these transcripts, northern blotting was carried using a 3.3 Kb ribonucleic acid (RNA) probe that contained exon 1 to 13 of the 6.1 Kb Dlc1 tran-script (Figure 2). This probe revealed the existence of transcripts (7.6, 6.1, 6.2 and 2.1 Kb) in all the tissues examined. However, the 7.6 Kb splice variant was most prominent in the liver and placenta and appeared to be a minor transcript in other tissues.
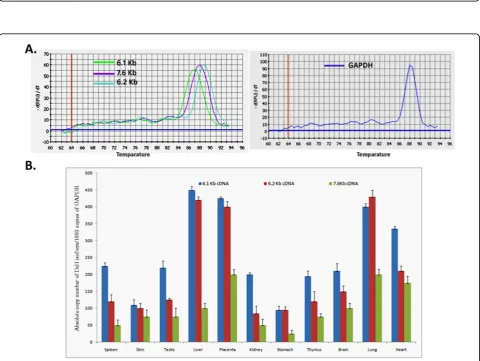
Real time reverse transcription polymerase chain reac-tion (RT-PCR) was carried out in order to quantify the relative expression of the transcripts in various tissues (Figure 3). These results reveal that the Dlc1 isoforms are expressed abundantly in all the mouse tissues that we examined, which agrees with the data observed by northern blot analysis (Figure 2). However, using real time RT-PCR analysis, the 6.1 Kb transcript seems to be expressed highest in the liver, followed by the placenta, lung, heart, spleen, testis, brain, kidney, thymus and the skin. The 6.2 and 7.6 splice variants were expressed at lower levels in the other organs compared with the 6.1 Kb isoform. Liver and placenta appears to predomi-nantly express the 6.1 and 6.2 Kb transcripts whereas the 7.6 Kb transcript was predominantly expressed in lung, heart and placenta based on real-time RT-PCR, in agreement with the northern blot.
the 6.2 Kb transcript is predicted to be 127 KDa. In the same western blot test we found a band of approximately 127 KDa, which showed a high expression in the thymus, lung, testis, spleen and liver (Figure 4). Sometimes a doublet of the 127 KDa band was seen, which suggests a possible post-translational modification. Further experi-ments will be needed in order to confirm the identity of the 127 KDa band and the other cross reacting proteins. With this antibody, we were not able to detect any pro-teins in the region of 169.8 KDa - the predicted size of the protein from the 7.6 Kb transcript (data not shown). The expression profile of Dlc1 isoforms among different tissues were correlated, to some extent, with the quanti-tative PCR and the northern blot.
Methylation status of the alternative promoters of Dlc1 6.1 and 6.2 Kb transcripts
Since the 6.1 and 6.2 Kb transcripts showed differential tissue expression, we wanted to determine if this was
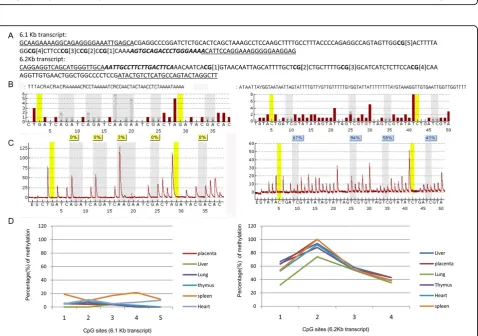
reflected by differences in promoter methylation. We used bisulphite treatment of DNA followed by PCR and pyrosequencing to study the promoter methylation sta-tus of the 6.1 and 6.2 Kb transcripts in various tissues. For our studies, we targeted five CpG islands located 502 bp upstream of the start codon for the 6.1 Kb tran-script and four CpG islands located 851 bp upstream of the start codon of 6.2 Kb transcript (Figure 5A). The pyrosequencing revealed much lower methylation of the 6.1 Kb promoter region (1-19% mean methylation) in the 5 CpG islands; the 6.2 Kb promoter region showed a higher percentage of mean methylation of 60-65% in all the tissues examined (Figure 5D).
Characterization of the mice heterozygous for the gene trap allele
Figure 2Northern blot of ribonucleic acid (RNA) from different mouse tissues. Poly(A)+RNA from different mouse tissues were transferred to a nylon membrane and hybridized sequentially with a 3.3 Kb deleted in liver cancer 1 RNA probe and a mouse GAPDH probe.
named XE082, to assist the functional characterization of this isoform. We determined the integration site of the promoter trap plasmid in this line by inverse PCR and used this information for genotyping the transgenic mice made with this line (Figure 6). Adult mice hetero-zygous for the Dlc1 gene trap did not show any gross physical, histological or behavioural abnormalities. As well, we have not seen any spontaneous tumours in het-erozygous mice living to at least 2 years of age.
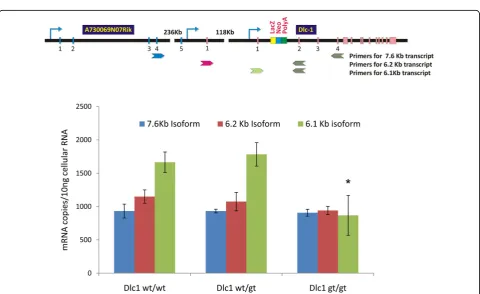
Multiplex RT-PCR (Figure 7B) and real time RT-PCR analysis (Figure 8) showed a reduction of the 6.1 Kb tran-script in the homozygous gt serum free mouse embryonic cell lines (SFME) compared with wild type and heterozy-gous lines. The 6.2 and 7.6/2.1 transcripts showed only a slight reduction, despite the fact that all three transcripts can be spliced into thebgeo reporter cassette (Figure 7C). These results indicate that the gene trap’s main effect resulted in hypomorphic expression the 6.1 Kb isoform. Figure 4Dlc1 protein expression in different mouse tissues. Western blots of total cellular protein extracted from different mouse tissues using Dlc1 polyclonal antibody. The upper blot shows expression of Dlc1 related proteins and the lower blot shows the GAPDH loading control.
Figure 7Multiplex reverse transcriptase polymerase chain reaction (RT-PCR) showing the effect of gene trap insertion on the various Dlc1 isoforms. (A) Diagrammatic representation of the Dlc1 gene showing the position of different PCR primers sets used; (i) to show relative expression of GAPDH mRNA and Dlc1 isoforms and (ii) to show the relative expression of gene trap fusion transcripts and Dlc1 normal transcripts. (B) Multiplex RT-PCR showing the expression of 7.6 Kb, 6.2 Kb and 6.1 Kb Dlc1 isoforms and alternative splice forms relative to GAPDH expression (C) Multiplex RT-PCR showing the expression of 7.6 Kb, 6.2 Kb and 6.1 Kb Dlc1 isoform normal transcripts relative to their fusion splice products withbgeo of the gene trap vector.
Abnormalities in the Dlc1gt/gtembryos
No mice homozygous for the gt Dlc1 allele were observed at birth from heterozygous intercross matings. Histological analysis of 10.5-11.5 days post coitum (dpc) embryos from heterozygous matings showed that Dlc1gt/gtembryos were necrotic and displayed growth retardation that varied in severity (Figure 9i). Most of the embryos had a retarded brain structure and an abnormally enlarged heart (Figure 9i). The presence of the bgeo cassette in the gene trap
vector allowed for expression analysis of the Dlc1 gene after X-gal staining. The anterior neural tube was open and contorted in the homozygous gene trapped embryos (Figure 9iii). X-gal stained hearts showed thin and under-developed atrial and ventricular walls with an apparent lack of blood cells inside the heart (Figure 10iii). The homozygous gt mice also showed an absence of blood vasculature in the yolk sac (Figure 9ii) and in the placental labyrinth (Figure 10i &10ii). The haematoxylin and eosin
(H&E) stained sections of Dlc1wt/gtplacental labyrinths at 10.5 dpc showed sinusoids with maternal enucleated red blood cells (RBC) and embryonic blood vessels with nucleated fetal erythrocytes in close proximity with each other (Figure 10ii). In contrast, the embryonic and placen-tal vasculature was severely reduced in the Dlc1gt/gt pla-centa, as revealed by immunofluorescent staining with the endothelial and haematopoietic cell marker CD31 (Figure 10i). H&E staining of the Dlc1gt/gtplacenta also showed aggregates of erythrocytes in collapsed blood vessels (Fig-ure 10ii). X-gal staining of the 10.5 dpc homozygous gt embryos revealed a strong expression of the beta-galacto-sidase fusion protein in the anterior part of the notochord, somites, liver, heart, lung, forebrain, placenta and tail bud (Figure 9i &9iii). The defects in placenta and the vitelline blood vessels are probably the cause for the embryonic lethal phenotype of the homozygous gene trapped embryos.
Reduced level of Dlc1protein in a serum free Dlc1gt/gt mouse embryos cells
Dlc1 protein expression was determined in serum free mouse embryo cell lines (SFME) derived from 9.5 dpc embryos. The homozygous Dlc1gt/gtSFME cells showed significantly reduced Dlc1 protein levels (P< 0.001) in western blots compared with the heterozygous or wild type cells (Figure 11). We found specific reduction of the 123 KDa band corresponding to the predicted size of the 6.1 Kb transcript of Dlc1. There was also an increase of a cross reacting 127 KDa band in the homo-zygous gt cells when compared to the wild type and het-erozygous lines. This protein size corresponds to the predicted size for the 6.2 Kb transcript.
Dlc1gt/gtSFME cells showed increased RhoA activity and an altered cytoskeleton along with increased cell motility
If Dlc1 activity is reduced in the gene trapped cells, one would expect to see an increase in active Rho activity. The active Rho levels in the Dlc1 deficient SFME cell lines were measured by a Rho-GTP pull-down assay. The Dlc1gt/gtcells showed a significantly higher (P < 0.001) constitutive level of active GTP bound RhoA (Figure 12A, B and 12D). The induction of active Rho following LPA treatment was also significantly higher (P < 0.001) in the Dlc1gt/gt cell line compared with the Dlc1wt/wtor Dlc1wt/gtlines. Since RhoA has been impli-cated in podosome formation in osteoclasts [23] and dendritic cells [24], we wanted to see if the subcellular localization of endogenous active RhoA was altered using an in situRho-GTP affinity assay. As in the active pull down assays, increased levels of active RhoA was detected by GST-Rho Binding Domain (RBD) protein staining in the Dlc1gt/gt cells when compared with the wild type and heterozygous cells (Figure 12C).
The formation of actin stress fibres and focal adhe-sions were compared among the various SFME lines detected by fluorescent conjugated phalloidin and anti-vinculin antibody staining (Figure 13A, B and 13C). The Dlc1 gt cells showed a significant increase (P< 0.001) in actin stress fibre formation and increased vinculin asso-ciated focal adhesions, when compared with the wild type and heterozygous cell lines.
It has been previously reported that active RhoA activ-ity can down regulate p21WAF1 expression [25]. The Dlc1gt/gtcells also showed significantly reduced (P < 0.001) constitutive levels of the p21WAF1protein in com-parison to the cell lines derived from heterozygous and wild type embryos (Figure 11). We have also found a positive correlation between reduced expression of Dlc1 and p21WAF1 in cell lines (R = 0.645; P = 0.004). The preceding results indicate that the Dlc1 gt cells showed increased RhoA activity.
Rho proteins are important players in the regulation of cell motility and reduced expression of Dlc1 enhances cell migration. In order to study the effect of hypo-morphic expression of Dlc1 on directed cell migration, we performed scratch assays by wounding confluent monolayers of mouse embryonic fibroblast cell lines derived from wild type, heterozygous and homozygous embryos. The Dlc1gt/gt cells showed more rapid wound closure that was significantly different compared to the rate of wound closure in wild type and heterozygous cells (P < 0.001; Figure 14), indicating increased cell motility. The amount of wound closure decreased slightly at longer times, possibly due to change in direc-tion of cell movement.
Discussion
length, which connects the Dlc1 gene upstream of exon 2 to an additional 1.7 Kb of exon sequences, resulting in the 7.6 Kb fusion transcript. The upstream 1.7 Kb exon sequences were generated from a previously uncharac-terized gene 5’of Dlc-1 (A730069N07Rik). It is interest-ing to note that comparison of the mouse 7.6 Kb mRNA with the human 7.5 Kb transcript revealed that the 5thexon is exactly 34 bp in length and only differs
in its relative position within the intronic sequences. The conserved nature of this novel exon sequence sup-ports a functional significance for the 7.6 Kb mRNA. The human 7.4 Kb, KIA1723, cDNA has the potential to encode for a 1528 amino acid protein [28]. Recently Koet al. have shown high expression of a greater than 150 KD protein in the human heart tissue using an anti-body based on this cDNA sequence [21]. The putative Figure 11Dlc1 and p21WAF1protein expression in Dlc1wt/wt, Dlc1wt/gt, and Dlc1gt/gtSFME cell lines. Western blots of total cellular protein extracted from different serum-free mouse embryo (SFME) cell lines. (A) Upper blot shows the expression of Dlc1 protein and lower blot shows actin expression. (B) Upper blot shows the expression of p21WAF1protein and the lower blot shows actin expression. (C) Plot showing the relative intensity of Dlc1 123 KDa protein and p21WAF1protein in SEME cell lines. Means and standard error of mean determined from at least six independent experiments using cell lines derived from different mouse embryos are given. *P< 0.001, by one way ANOVA test.
promoter region of both the human and mouse Dlc1 7.6 Kb mRNA is approximately 400 Kb upstream of the exon 2 of the Dlc1 6.2 Kb transcript. Shorter transcripts originating from this promoter are also found, which do not encode Dlc1 RhoGAP related sequences. The exis-tence of this larger Dlc1 polypeptide has not yet been verified in the mouse and we have not yet seen a pro-tein of this size on our western blots. The mouse 2.1 Kb transcript retains only exon 2 and 3 of the regular Dlc1 transcripts and would not encode a RhoGAP related protein. Understanding the function of these shorter transcripts will have to await specific knockout mouse models. Analysis of the nucleotide sequence of the three
isoforms reveals that these isoforms have a conserved domain structure and that they may be functionally redundant. However, these isoforms were not sufficient to rescue the embryonic lethal phenotype of our homo-zygous gt mice.
[30] present in the 14th exon of regular Dlc1 transcripts. The weak polyadenylation signal may be responsible for bypassing the 3’end formation and lead to the forma-tion of a fusion transcript between the genes. However, the conserved nature of the exon 5 of the 7.6 transcript contradicts this finding and further study is necessary in order to validate these observations.
The 6.1 Kb Dlc1 transcript is predicted to encode a 123 KDa protein, which is highly expressed in the fore-brain, anterior tip of the notochord, somites, liver, heart and placenta, suggesting an important role for this Dlc1 isoform in the development of theses organs. The 6.2 Kb alternative transcript contains a novel first exon located 133 Kb upstream of exon 2 and potentially codes for a 127 KDa protein. The first exon of the 6.2 Kb transcript substitutes 47 aa of the first 13 aa of the 6.1 Kb Dlc1 transcript. The existence of the 127 KDa Dlc1 protein has not yet been fully validated. However, in our western blots, using an antibody raised against a peptide to exon 5, we identified a band equivalent to 127 KDa. The expression level of 127 KDa Dlc1 protein showed tissue specific differences from the 123 KDa protein. For example, testes showed expression of the 127 KDa band and reduced levels of the 123 KDa band (Figures 3 and 4). There is possibility that the 127 KDa protein is a cross reacting non-specific protein. How-ever, we argue that the 127 KDa band is the protein product of the 6.2 Kb isoform because of its molecular weight, which almost exactly matches the predicted pro-tein product of 6.2 Kb isoform. Another reason for such an argument is that the 127 KDa protein band has increased intensity in the Dlc1gt/gtcell line as opposed to the wild type or heterozygous cell lines. This may be explained as a cellular response to complement the reduced level of 6.1 Kb transcript in the gt cells or an effect of the relative abundance of 6.2 kb isoform. The 6.1 and 6.2 Kb Dlc1 isoforms may be functionally redundant because of their structural resemblance and, thus, could complement each other. Recently, such functional redundancy has been shown by Koet al. in a study using Myc tagged Dlc1 isoforms expressed in hepatoma cell lines [21]. They showed that human Dlc1 isoforms aand b(equivalent to mouse isoforms 1 and 3) could suppress stress fibre formationin vitro. How-ever, further experimentation is necessary in order to test such a claim.
The N terminus of Dlc1 protein contains a sterile alpha motif (SAM)2 interaction domain, amino acids 13-64 in the 6.1 Kb and 47-98 in the 6.2 Kb transcripts. The SAM domain is a motif that occurs in many tran-scription factors and signalling proteins [19]. The 123 and 127 KDa Dlc1 proteins differ in exon 1, which is a short stretch of amino acids upstream of the SAM2 domain. Deletion of the SAM domain increases the
velocity of cell migration but reduces directionality by acting as a negative regulator of Dlc1RhoGAP activity [31]. A truncated version of Dlc1 protein that contains the N terminal domain, but not the GAP domain, loca-lizes to focal adhesions and can act as a dominant nega-tive protein [32]. Recently, in hamster kidney cells, co-localization of Dlc1 protein with Caveolin-1 in focal adhesions was found to be independent of the SAM domain [33]. However, the Dlc1 SAM2 domain has been shown to interact with the elongation factor EF1A1, targeting it to the membrane periphery and membrane ruffles [34].
It is possible that exon 1 of the Dlc1 isoforms may interact with different proteins or allow different subcel-lular localization for the spatial regulation of cell move-ment. In that case, the 6.1 Kb and 6.2 Kb isoforms may not be able to rescue each other’s RhoGAP activity due to different interacting partners or subcellular localiza-tion. Alternatively, the two isoforms may have different temporal or tissue specific expression during develop-ment, a theory which is supported by our results. Experiments that will test these possibilities are ongoing. The mean frequency of the promoter methylation for the Dlc1 isoforms helps to explain the tissue expression pattern. The promoter of the 6.1 Kb transcript showed a significantly lower mean percentage of CpG methylation (1%-19%) compared with the promoter of 6.2 Kb tran-script (62%-65%). Hypermethylation of the Dlc1 promo-ter is a common mechanism for transcriptional repression of the Dlc1 gene in several human malignan-cies and hypermethylation of the 6.1 Kb transcript pro-moter is usually found in human tumours [9,14].
[36,37]. Also, our gene trapped mouse phenocopies the Dlc1 exon 5 knockout mouse of Durkin et al. [38]. These results suggest that the gt ES cell libraries maybe a useful resource for studying specific knockdown of transcriptional isoforms and splice variants of genes.
The Dlc1 gene plays a critical role in regulating cellu-lar functions during early murine development. The abnormalities found in the Dlc1 gt embryos are a com-mon occurrence in mouse gene knockouts that result in death at the early stages of embryogenesis, due to organ systems failure [38,39] and are often associated with car-diac or placental defects [38]. The abnormally enlarged heart, lack of yolk sac blood vessels and underdeveloped blood capillaries in the placental labyrinth of the homo-zygous Dlc1 gt embryos appeared at a developmental stage when the Dlc1 transcripts are normally expressed and, most probably, caused the embryonic lethality. Whether the heart and brain defects are a direct result of Dlc1 loss or a consequence of the lack of placental blood vessel formation will have to await the isolation of conditional Dlc1 knockout mice.
Previously, it has been shown that targeted disruption of mouse Rho associated coiled coil kinase-2 (ROCK-II) gene resulted in intrauterine growth retardation and defective branching morphogenesis of the placental labyrinth [40]. The ROCK-II mRNA has been found to be expressed abundantly in placenta [41]. The active form of RhoA binds to ROCK kinase, which phosphory-lates myosin phosphatase, resulting in increased myosin light chain (MLC) phosphorylation allowing contraction [41]. The Rho/ROCK signalling pathway also contributes to the Ca2+sensitization of smooth muscle contraction [42]. RhoA is abundantly expressed in vascular smooth muscle and its activation increases vascular tone, result-ing in increased permeability [43]. Rho GTPases has long been implicated in the regulation of endothelial perme-ability [44]. Recently, it has been shown that increased expression of constitutively active RhoA induced cell rounding and apoptosis of endothelial cells [45]. There-fore, it is possible that Dlc1 protein plays a significant role in placental and heart development due to its regula-tory effect on Rho/ROCK signalling pathway.
The Dlc1 protein has been reported to be localized to the focal adhesions as shown by colocalization with the focal adhesion protein vinculin [46]. Focal adhesions are a structural link between the actin cytoskeleton and the extracellular matrix and are regions of signal transduc-tion that can regulate growth control [47-49]. We have shown that the formation of actin stress fibres and vincu-lin rich focal adhesions were significantly increased in the hypomorphic Dlc1gt/gtSFME and fibroblast cell lines. Dlc1 has been implicated in the phosphoinositide and RhoGTPase signalling pathways, both of which can regu-late stress fibre formation and focal adhesions assembly
[50-52]. Similar findings have been reported by Holeiter
et al. in breast cancer cells using siRNA mediated knock-down of Dlc1 transcripts [53] and Xueet al. in embryo-nic liver progenitor cells using shRNA [10]. In contrast to our results, Durkinet al. reported that their knockout mice showed reduced actin stress fibre and vinculin rich focal adhesions in their Dlc1-/-mouse embryonic fibro-blast (MEF) cells [38]. A possible reason for this may be that the culturing of our SFME cells on fibronectin coated plates, may stimulate the Rho signalling allowing the formation of stress fibres. Using soluble GST-RBD in order to detect endogenous RhoGTP, we have been able to show that the Dlc1gt/gtcells exhibit increased RhoA activity and subcellular localization of active RhoA at the focal adhesions. Similar findings have been previously reported by Berdeauxet al. in nontransformed fibroblasts [54]. Rho proteins are important regulators of cellular migration [55]. In addition to the cytoskeletal changes, the Dlc1gt/gtMEF cells showed significantly increased cel-lular migration in wound closure assays compared with the heterozygous or wild type MEFs. Similarly, Holeiter
et al. found rapid wound closure in scratch assays using RNAi to knockdown Dlc1 in MCF7 breast cancer cells [53]. The cellular migration rate decreased as the cells approached to the midline of the wound from both sides, which might be because of changes in the direction of migration due to contact or the depletion of nutrients in the media. All of this evidence is consistent with the sug-gestion that Dlc1 deficiency may be a driving force for cellular migration by remodelling the actin cytoskeleton and focal adhesions.
Recently, it has been shown that in H-Ras oncogene transformed fibroblasts, RhoA may cooperate in trans-formation by suppressing the cell cycle inhibitor p21WAF1 that is induced by the sustained activation of the ERK-MAP kinase pathway [3,25]. In our study, we saw increased RhoA activity and a reduced level of con-stitutive p21WAF1expression in the Dlc1gt/gtSFME cells. The reduced expression of Dlc1 and p21WAF1 in the Dlc1 deficient cell lines was positively correlated. It is possible that activation of the Rho pathway through mutation of the Dlc RhoGAPs will complement the Ras oncogene in cell transformationin vivo.
Conclusions
and the 123 KDa Dlc1 protein. The homozygous gt
Dlc1gt/gt mouse embryos showed significant
abnormal-ities in yolk sac and placental labyrinth vasculature sug-gesting an important developmental role for the 6.1 Kb isoform of Dlc1 during early embryonic development. A deficiency of this isoform resulted in increased GTP-Rho levels resulting in more stress fibre and vinculin associated focal adhesion formation. This in turn resulted in heightened cellular mobility.
Methods
Generation of Dlc1mutantmice
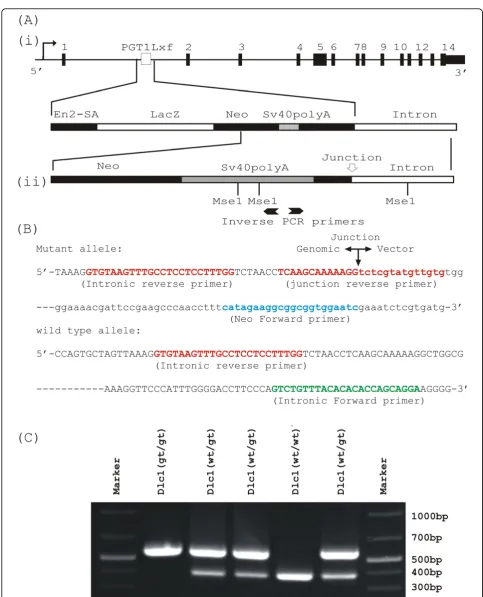
An ES cell line (XE082) containing a gene trap insertion in the 1st intron of the Dlc1 locus (Figure 6A) was obtained from Bay Genomics (CA, USA). The gene trap plasmidpGT1Lxfcontains the Engrailed-2 (En2) splice acceptor sequence upstream of the b-geo reporter gene, followed by SV40 polyA sequence. XE082 ES cells were injected into C57BL/6 blastocysts and the resulting chi-meric mice were backcrossed to C57BL/6 to test for germ line transmission. One chimeric male mouse transmitted the Dlc1 gene trap allele through his germ line and was used in the subsequent studies.
We utilized an inverse PCR technique to localize the insertion site of gene trap vector (GenBank accession No: GS598775 (Figure 6A) [56]. Genomic DNA was digested with MseI, circularized with T4 DNA ligase and PCR amplified with a pair of diverging primers (Figure 6A/i-ii). This amplicon was then sequenced and indicated that the plasmid had integrated into the intron 1 of Dlc1 gene (Figure 6B). Based on the integration information, we designed: (1) a primer in the neomycin-resistance cassette
ofpGT1Lxf(5’-GATTCCACCGCCGCCTTCTATG); and
(2) two intronic primers encompassing the integration point (5’-GTGTAAGTTTGCCTCCTCCTTTGG and 5’ TCCTGCTGGTGTGTGTAAACAGAC). These three pri-mers, when used in multiplex PCR, amplify a 570 bp pro-duct specific for the targeted allele and a 388 bp band for the wild type gene (Figure
Histological analysis and X-gal staining of the mutant embryos
Embryos from heterozygous crosses were dissected at 10.5 and 11.5 dpc and yolk sacs were used for DNA extraction and subsequent genotyping. Placentae were fixed in 10% neutral buffered formalin and sections were stained with H&E for microscopic examination. We isolated 10.5-11.5 dpc embryos from heterozygous crossings and they were fixed and stained as a whole mount in X gal as described [57].
SFME cell cultures
Embryos from heterozygous intercross matings were harvested on 9.5 dpc, cells were dissociated by
trypsinization and cultured in serum-free conditions which consists of epidermal growth factor, transferrin, high density lipoprotein, insulin and fibronectin coated plates [58]. Cells grow under these conditions do not senesce and have normal karyotypes. For MEF cultures, 9.5 dpc embryos were cultured in Alpha MEM (Gibco, Invitrogen, ON, Canada) supplemented with 10% fetal bovine serum and antibiotics. Cells were genotyped by PCR and studies were performed on wild type (Dlcwt/wt), heterozygous (Dlc1wt/gt) and homozygous (Dlc1gt/gt) cells prior to passage 10. All cell line specific experiments were repeated with multiple cell lines of each type obtained independently from different mouse litters.
Western blotting and Immunohistochemistry
SFME as well as MEFs cells were grown on 150 mm plates until confluent, washed with ice-cold phosphate-buffered saline (PBS) and then lysed with radioimmuno-preciptation assay buffer (150 mM sodium chloride, 1% NP-40, 0.5% sodium deoxycholate, 0.1% sodium dodecyl sulphate (SDS), 50 mM Tris, pH 8.0) supplemented with 1× protease inhibitor cocktail (S8820, Sigma, MO, USA). After sonication for 3× 5 s on ice, the cell lysates were clarified by centrifugation at 12,000 rpm in a Hettich-Mikro 20 centrifuge at 4°C. The protein concentration was estimated by Bicinchoninic acid protein assay kit (BCA1 and B9643, Sigma) according to the manufac-turer’s instructions. Twenty micrograms of total protein was separated on 8% SDS-polyacrylamide gel and trans-ferred to a polyvinylidene fluoride microporous (PVDF) membrane (IPVHO9120, Millipore Corp, MA, USA). The membrane was then blocked for 1 h in 5% skimmed milk powder in TBST buffer (20 mM tris, 137 mM NaCl, 0.1% tween) and hybridized with Dlc-1 anti-body (Sc32931, Santa Cruz Biotechnology, CA, USA; 1:500 dilution) over night. After washing in TBST buf-fer, the membrane was incubated with secondary horse-radish peroxidase-conjugated anti-Rabbit antibody (1:2000 dilution; #7074, Cell Signaling Technology, MA, USA) for 1 h at room temperature. Immunoreactivity was detected using enhanced chemiluminescence (RPN2132, GE Healthcare, NJ, USA). The membrane was then stripped with 0.1 M NaOH and blotted again with anti-Actin or GAPDH antibody (A2006, Sigma, 1:1000 dilution). The western blots were scanned using a Storm 840 PhosphorImager scanner and quantified by densitometry using ImageQuant software (version 1.2; both from Molecular Dynamics, Inc, CA, USA).
Focal adhesions were visualized by direct immunofluor-escence using monoclonal anti-Vinculin-FITC antibody (F7053, Sigma). The preparations were examined on Axioplan 2 microscope (Carl Zeiss, Inc, ON, Canada) and an AxioCam HR charge-coupled device (Carl Zeiss). A 63×/1.4 oil objective lens (Carl Zeiss) was used at acquisition times of 200-300 ms for FITC (focal adhe-sions) 100-150 ms for TRITC (actin fibres), and 20 - 50 ms for DAPI (nuclei).
For stress fibre and focal adhesion quantification, six high resolution Z stacks images of phalloidin and anti-vinculin stained cells were taken at 1μm intervals and projected as a single image after deconvolution using Axiovision 3.1 software (Zeiss). The deconvoluted flattened image was then analysed using ImageJ 1.38× public domain software. The stress fibre and focal adhe-sion frequency was calculated as described by Stachan
et al. [59].
Rho activation andin situRho GTP affinity assay
Rho activity in wild type, heterozygous and homozygous cell lines were analysed using the active Rho-GTP pull down assay. A plasmid expressing GST-Rhotekin Rho-binding domain peptide (kindly provided by Dr Alan Hall, Sloan-Kettering Institute, New York, USA) was transformed into BL21 cells and expression was induced with 0.5 mM isopropyl b-D-1 thiogalactopyranoside for 2 h at 37°C. GST fusion proteins were purified on glu-tathione-Sepharose 4B beads (GE Healthcare Bio-Sciences Inc, Quebec, Canada).
SFME cells were grown in 150 mm dishes and were then deprived of growth factors for 12 h followed by addition of lysophosphatidic acid (LPA, 20 ng/mL) for 30 min. At the end of the treatment, cells were rinsed with ice-cold PBS and 500μL of lysate buffer was added to each dish. Cells were scraped, and cell lysates were clarified at 10,000 × g for 10 min. Pull-down assays were performed according to Ren and Schwartz [60] with 30-40μg of GST-fusion protein and 800-1500 μg of protein lysate per sample.
In situ detection of active Rho was performed as described by Berdeaux et al. [54,61]. Cells growing on glass coverslips were briefly washed in PBS and immedi-ately fixed with freshly prepared 4% paraformaldehyde (PFA) in PBS for 10 min at 4°C. After 30-min of incuba-tion in PBS containing 3% BSA, 0.1 M glycine, and 0.05% Triton X-100 followed by incubation with the soluble GST-RBD (30 μg/ml) or GST (reduced) for 2 h at 4°C, the samples were washed three times and incu-bated with an anti-GST monoclonal antibody (1:1000 dilution) in wash buffer for 1 h at room temperature. The signal was detected by incubation with FITC conju-gated anti-rabbit IgG (1:1000 dilution) for 45 min at
room temperature. Samples were mounted in antifade reagent containing DAPI.
RNA isolation and cDNA preparation
RNA was isolated from different tissues of C57BL/6J mouse, as well as SFME cell lines using TRIzol Reagent (Invitrogen Inc, ON, Canada) according to the manufac-turer’s instructions. Total RNA (5μg) was reversed tran-scribed using SuperScript II Reverse transcriptase (Invitrogen) and random hexamers (Invitrogen).
3’rapid amplification of cDNA ends (RACE) analysis
The 3’RACE were carried out using DNase treated total RNA extracted from the cerebellum of 12.5 dpc embryo, placenta, adult brain and heart of C57BL/6J mice. First strand cDNA synthesis for 3’end was performed using 50 ng of the oligonucleotide dT Primer (Table 1), 5 μg of total RNA and SuperScript II reverse transcriptase (Invitrogen) following the manufacturer’s protocol [62]. The 3’end was then amplified using a primer that con-tains part of the oligonucleotide dT primer, which binds to these cDNAs at their 3’ends, and exon specific pri-mers from the Dlc1 gene (Table 1). A second amplifica-tion series was then performed using internal nested primers (Table 1) to suppress the amplification of non-specific products.
All 3’RACE reactions were electrophoresed through 1.5% agarose gels and visualized. 3’RACE products were excised from the agarose gel, purified using Qiagen gel extraction kit (Qiagen Inc, ON, Canada) and cloned into the pGEM-T Easy Vector Systems (Promega Fisher Scien-tific, ON, Canada) using the manufacturer’s instructions.
After cloning 3’RACE products, both strands of DNA were sequenced for each construct. Sequencing was per-formed by the DNA Sequencing facility at Manitoba Institute of Cell Biology using BIG DYE terminators from Applied Biosystems, Inc (PE Applied Biosystems, ON, Canada) and sequencing reactions were run on ABI 310 DNA Sequencer.
Northern blot analysis of DLC-1 mRNA
Poly(A)+ RNA was prepared from different tissues of C57BL/6J mice and SFME cell lines using mRNA isolation kit (Roche Diagnostics, Quebec, Canada) and analysed by Northern blot hybridization using 2.2% (w/v) acrylamide-0.5% (w/v) agarose gel [63]. The blot was probed with a
32
Quantification of Dlc1 isoforms by real time and multiplex PCR
The relative expression of the different transcriptional var-iants was determined by quantitative real time and multi-plex RT-PCR. Three forward primers were designed, one primer each from the exon 1 of 6.1 and 6.2 Kb transcripts and the third primer designed from the exon 4 of 7.6 Kb transcript, which is also common to 2.1 Kb transcript. The 6.1 and 6.2 Kb transcript specific forward primers were combined with a reverse primer designed from exon 2 and
the 7.6 Kb transcript specific forward primer was com-bined with a reverse primer specific to exon 4 of 6.1 Kb transcript, respectively. PCR primers were designed using the Gene Fisher-version 2 software (Bielefeld University Bioinformatics Service, Bielefeld, Germany) for quantifica-tion of the various isoform variants (listed in Table 1). Absolute quantification of the transcripts was performed in an iCyclerIQ (Biorad, ON, Canada). Each reaction mix contained SYBR Green (Sigma S9430), Fluorescein calibra-tion dye (Biorad, 170-8780) and 200 nM of each primer, Table 1 List of primers used for 3’RACE, real time polymerase chain reaction (PCR), multiplex PCR, genotyping, and northern probe preparation. All primer sequences are in 5’-3’direction.
Primers for 3’RACE
1st strand CDNA synthesis
CCAGTGAGCAGAGTGACGAGGACTCGAGCTCAAGCTTTTTTTTTTTTTTTTT
Forward primers Reverse primers Sequencing primers
1st round PCR CTATCAGAAAGAGGAGCTGGGAAG
AGACCGAACAGCCTTTTATTTCTG ACGTCTTAGCAGCTCCTTATGTAG ACAAAAGCACTCTCGGGGTCAG AAACTGGACCAACTAGACCAAGAC ATCTGAATTGCACAGGCAAAACAG GCCCTAAGCCTTTCCAGATG CTGCGCCGACCTTAATGTGTAG
CCAGTGAGCAGAGTGACG
2nd round PCR CTATCAGAAAGAGGAGCTGGGAAG
AGACCGAACAGCCTTTTATTTCTG ACGTCTTAGCAGCTCCTTATGTAG ACAAAAGCACTCTCGGGGTCAG AAACTGGACCAACTAGACCAAGAC ATCTGAATTGCACAGGCAAAACAG TCCTTCAGCGACCACATCAGAG CGCCGACCTTAATGTGTAGAGAC
GAGGACTCGAGCTCAAGC ATTTTTTTTTTTTTTTTTTTTT
GTTTTTTTTTTTTTTTTTTTTT CTTTTTTTTTTTTTTTTTTTTT & different forward primers
Primers for Northern probe
1st round PCR CTGCGCCGACCTTAATGTGTAG GTTGCAGTCACGGGTGCTTC
2nd round PCR CTCGAGCTGCGCCGACCTTAATGTGTAG GTCGACGTTGCAGTCACGGGTGCTTC
Primers for real time quantification of splice variants
7.6 Kb transcript TCCACCGATCCATCATCCACTC CGGTGAGGACTGATCTCCAGCTTCATG
6.2 Kb transcript TCCTTCAGCGACCACATCAGAG
GACTGGTTTCCCCCAGTATGCA 6.1 Kb transcript CGCCGACCTTAATGTGTAGAGAC
2.1 Kb transcript TCCACCGATCCATCATCCACTC GCCCACTGAGTGCTGAGACTG
AAGTAC
GAPDH TTC CGT GTT CCT ACC CCC AAT GTGT GGAGTTGCTGTTGAAGTCGCAGGAG
Primers for methylation study
6.1 Kb Transcript
Biotin-GTAAGAAAAGGTAGAGGGGAAATTGAGTA
CTCCTTCCCCCTTTCCTAAAATAT TTTTCCCAAAATCTACACT
6.2 Kb transcript TAGGAGGTTAGTATGGGTTGTA
Biotin-AAACCTAATACTAACATAAAACAATATC
AAATTGTTTTTTTGATTTTAA
Multiplex PCR primers for genotyping Dlc1 gene trap embryos
TCCTGCTGGTGTGTGTAAACAGAC GTGTAAGTTTGCCTCCTCCTTTGG
GATTCCACCGCCGCCTTCTATG TCAAGCAAAAAGGTCTCGTATGTTGTG
Multiplex PCR primers for fusion transcripts
(7.6+2.1)Kb transcript TCCACCGATCCATCATCCACTC
ACGACGACAGTATCGGCCTCAG 6.2 Kb transcript TCCTTCAGCGACCACATCAGAG
200 nM dNTP solutions, 1 × Reaction buffer, 1.5 mM MgCl2and 0.5 U Taq polymerase. The thermal cycling
conditions were: 95°C for 1 min, 40 cycles of 95°C for 15 s, 62°-65°C for 30 s and 72°C for 30 s. In order to determine the absolute copy number of target transcripts, Dlc1 iso-forms (6.1, 6.2 and 7.6 Kb) and GAPDH cDNAs were amplified using specific primer sets as described in Table 1. The purified PCR products were cloned in pGEM-T easy vector system and the plasmid DNA was used to gen-erate calibration curves, which also permitted evaluation of PCR efficiencies using the formulaE= 10[-1/slope]. The efficiency of amplification was checked for all targets by performing a series of serial dilutions of template for each primer pair in triplicate. Real time PCR data quality con-trol calculations were run on the SAS program as described [64,65]. The E value varied from -2.05 to -3.4 which represents an acceptable PCR efficiency between 90%-95% [66]. Quantitative RT- PCRs were then con-ducted for different mouse tissue samples, and the specifi-city of each amplified product was confirmed by the melting curve analysis (Figure 3A). Results were expressed as copy number of specific isoforms per 1000 copies of GAPDH cDNA (Figure 3B).
For multiplex PCR, we used two different strategies. First, the different isoforms were quantified relative to GAPDH internal standard and second, all the splice var-iants were quantified to the corresponding fusion tran-script that was generated by fusion to the bgeo gene, which is part of the gene trap insertion. Relative expres-sion of cDNA equivalent of 400 ng total RNA was quan-tified using two sets of primers in the same PCR reaction; one set specific to the Dlc1 isoform and the other set spe-cific to either the GAPDH gene or to thebgeo fusion cDNA. The PCR products were run in a 1.5% agarose gel and stained with ethidium bromide for visualization.
In vitroscratch assay
Cell migration rates of wild type, heterozygous and homozygous cell lines were compared by an in vitro scratch assay [67]. Prior to the migration experiments, 60 mm cell culture plates were incubated for 4 h with 10 mg/mL fibronectin in Alpha-MEM. Coated dishes were blocked with 3 mL of 2 mg/mL bovine serum albumin (BSA) for 1 h at 37°C. Then, excess fibronectin was removed by washing with PBS and dishes were refilled with 3-5 mL of media before plating the cells. The wild type, heterozygous and homozygous fibroblast batches were seeded onto the fibronectin coated plates and cul-tured until confluent. After reaching confluency, the cell monolayer was scratched with a p200 pipette tip in two diagonal lines. The cell debris was removed and the edge of the scratch was smoothened by washing the cells once with 1 mL of the growth medium and then replaced with 5 mL of medium and incubated at 37°C for 18 h. In order
to obtain the same field during the image acquisition, reference points were created by marking the underneath of the dish with a fine pointed marker using a stereo-microscope. Subsequent photographs of the scratches were taken at 0, 6 and 18 h time intervals using a phase contrast microscope. We quantified the cell migration rate by determining the total area that the MEF cells moved from the edge of the scratch toward the center of the scratch during 0-6 h and 6-18 h of incubation follow-ing the creation of the wound in terms of pixels calcu-lated manually using the Image J 1.38× public domain software (available at http://rsb.info.nih.gov/ij/).
Methylation study of the Dlc1 promoter region
Chromosomal DNA was isolated from different mouse tissues by standard phenol chloroform extraction and ethanol precipitation [68]. Five micrograms of genomic DNA was then treated with bisulphite reagent for con-version of unmethylated cytosines of genomic DNA to uracils as previously described [68]. An aliquot of con-verted DNA (~100-300 ng) was used for amplification of the promoters of the Dlc1 6.1 and 6.2 Kb transcripts. The PCR primers were designed from the regions of the promoter that do not harbour any CpG dinucleotides (Table 1, Figure 5A). Primers were designed using PSQ Assay design software version 1.0.6 (Biotage) and one of the primer was biotinylated to generate single stranded DNA which was then sequenced using specific sequen-cing primers and the Pyromark gold reagent (5× 96 PSQ 96 MA) in Biotage Pyromark Q96 MD machine. The methylation pattern was analysed using PyroQ-CpG software version 1.0.0.
Statistical analysis
The one-way analysis of variance (ANOVA) test was used to compare three different cell lines with respect to the mean of Dlc1 protein expression, P21WAF1 protein expression, focal adhesion frequency, stress fibre fre-quency and the cell migration rate. Two-way ANOVA was used to assess the effect of LPA on active Rho induc-tion in three different cell lines compared to controls. Correlation between Dlc1 and P21WAF1protein expres-sion was analysed using Pearson correlation test. All the statistical analysis was performed using Sigma Stat 7 for Windows software, version 2.03, 1997, SPSS Inc, IL, USA. Statistical significance was defined asP< 0.05.
Abbreviations
Acknowledgements
This study was supported with grants from the CancerCare Manitoba Foundation (MM, GGH); Canadian Cancer Society Research Institute (MM, GGH) and Genome Canada (GGH). We also thank Heather Prieditis for her excellent care of the animals, Dr Alan Hall for plasmids and Dr Luke DeLange for his encouragement and support.
Author details
1Manitoba Institute of Cell Biology, CancerCare Manitoba, 675 McDermot
Avenue, Winnipeg, MB R3E 0V9, Canada.2Department of Biochemistry & Medical Genetics, University of Manitoba, Winnipeg, Canada.
Authors’contributions
MGS carried out inverse PCR, genotyping of the transgenic mice, analysis of embryos, molecular analysis of RNA transcripts, protein expression studies, fluorescence IHC, promoter methylation analysis,in vitroscratch assay, designing of the study, analysis and the drafting of the manuscript. SL was participated in analysis of the transgenic mouse embryos. YG participated in genotyping of the transgenic mice. NW was involved in generation of the transgenic mice. CB participated in protein expression studies. GGH conceived the study and supervised generation of the transgenic mice. MM conceived and supervised the study, analysed the data, drafted the manuscript.
Received: 21 December 2009
Accepted: 3 March 2010 Published: 3 March 2010
References
1. Ellenbroek SI, Collard JG:Rho GTPases: functions and association with cancer.Clin Exp Metastasis2007,24:657-672.
2. Moon SY, Zheng Y:Rho GTPase-activating proteins in cell regulation.
Trends Cell Biol2003,13:13-22.
3. Sahai E, Olson MF, Marshall CJ:Cross-talk between Ras and Rho signalling pathways in transformation favours proliferation and increased motility.
EMBO J2001,20:755-766.
4. Zohn IM, Campbell SL, Khosravi-Far R, Rossman KL, Der CJ:Rho family proteins and Ras transformation: the RHOad less traveled gets congested.Oncogene1998,17:1415-1438.
5. Jaffe AB, Hall A:Rho GTPases: biochemistry and biology.Annu Rev Cell Dev Biol2005,21:247-269.
6. Bernards A:GAPs galore! A survey of putative Ras superfamily GTPase activating proteins in man and Drosophila.Biochim Biophys Acta2003, 1603:47-82.
7. Kandpal RP:Rho GTPase activating proteins in cancer phenotypes.Curr Protein Pept Sci2006,7:355-365.
8. Healy KD, Hodgson L, Kim TY, Shutes A, Maddileti S, Juliano RL, Hahn KM, Harden TK, Bang YJ, Der CJ:DLC-1 suppresses non-small cell lung cancer growth and invasion by RhoGAP-dependent and independent mechanisms.Mol Carcinog2008,47:326-337.
9. Wong CM, Lee JM, Ching YP, Jin DY, Ng IO:Genetic and epigenetic alterations of DLC-1 gene in hepatocellular carcinoma.Cancer Res2003, 63:7646-7651.
10. Xue W, Krasnitz A, Lucito R, Sordella R, Vanaelst L, Cordon-Cardo C, Singer S, Kuehnel F, Wigler M, Powers S, Zender L, Lowe SW:DLC1 is a chromosome 8p tumor suppressor whose loss promotes hepatocellular carcinoma.Genes Dev2008,22:1439-1444.
11. Yuan BZ, Miller MJ, Keck CL, Zimonjic DB, Thorgeirsson SS, Popescu NC: Cloning, characterization, and chromosomal localization of a gene frequently deleted in human liver cancer (DLC-1) homologous to rat RhoGAP.Cancer Res1998,58:2196-2199.
12. Ng IO, Liang ZD, Cao L, Lee TK:DLC-1 is deleted in primary hepatocellular carcinoma and exerts inhibitory effects on the proliferation of hepatoma cell lines with deleted DLC-1.Cancer Res2000, 60:6581-6584.
13. Yuan BZ, Durkin ME, Popescu NC:Promoter hypermethylation of DLC-1, a candidate tumor suppressor gene, in several common human cancers.
Cancer Genet Cytogenet2003,140:113-117.
14. Yuan BZ, Jefferson AM, Baldwin KT, Thorgeirsson SS, Popescu NC, Reynolds SH:DLC-1 operates as a tumor suppressor gene in human non-small cell lung carcinomas.Oncogene2004,23:1405-1411.
15. Zhou X, Thorgeirsson SS, Popescu NC:Restoration of DLC-1 gene expression induces apoptosis and inhibits both cell growth and tumorigenicity in human hepatocellular carcinoma cells.Oncogene2004, 23:1308-1313.
16. Lucito R, Healy J, Alexander J, Reiner A, Esposito D, Chi M, Rodgers L, Brady A, Sebat J, Troge J, West JA, Rostan S, Nguyen KC, Powers S, Ye KQ, Olshen A, Venkatraman E, Norton L, Wigler M:Representational oligonucleotide microarray analysis: a high-resolution method to detect genome copy number variation.Genome Res2003,13:2291-2305. 17. Homma Y, Emori Y:A dual functional signal mediator showing RhoGAP
and phospholipase C-delta stimulating activities.EMBO J1995, 14:286-291.
18. Ponting CP, Aravind L:START: a lipid-binding domain in StAR, HD-ZIP and signalling proteins.Trends Biochem Sci1999,24:130-132. 19. Qiao F, Bowie JU:The many faces of SAM.Sci STKE2005,2005:re7. 20. Durkin ME, Yuan BZ, Zhou X, Zimonjic DB, Lowy DR, Thorgeirsson SS,
Popescu NC:DLC-1:a Rho GTPase-activating protein and tumour suppressor.J Cell Mol Med2007,11:1185-1207.
21. Ko FC, Yeung YS, Wong CM, Chan LK, Poon RT, Ng IO, Yam JW:Deleted in liver cancer 1 isoforms are distinctly expressed in human tissues, functionally different and under differential transcriptional regulation in hepatocellular carcinoma.Liver Int2010,30:139-148.
22. Durkin ME, Yuan BZ, Thorgeirsson SS, Popescu NC:Gene structure, tissue expression, and linkage mapping of the mouse DLC-1 gene (Arhgap7).
Gene2002,288:119-127.
23. Chellaiah MA, Soga N, Swanson S, McAllister S, Alvarez U, Wang D, Dowdy SF, Hruska KA:Rho-A is critical for osteoclast podosome organization, motility, and bone resorption.J Biol Chem2000, 275:11993-12002.
24. Burns S, Thrasher AJ, Blundell MP, Machesky L, Jones GE:Configuration of human dendritic cell cytoskeleton by Rho GTPases, the WAS protein, and differentiation.Blood2001,98:1142-1149.
25. Olson MF, Paterson HF, Marshall CJ:Signals from Ras and Rho GTPases interact to regulate expression of p21Waf1/Cip1.Nature1998, 394:295-299.
26. Davuluri RV, Suzuki Y, Sugano S, Plass C, Huang TH:The functional consequences of alternative promoter use in mammalian genomes.
Trends Genet2008,24:167-177.
27. Yuan BZ, Yang Y, Keck-Waggoner CL, Zimonjic DB, Thorgeirsson SS, Popescu NC:Assignment and cloning of mouse Arhgap7 to chromosome 8A4-B2, a conserved syntenic region of human chromosome 8p22–>p21.Cytogenet Cell Genet1999,87:189-190. 28. Nagase T, Kikuno R, Hattori A, Kondo Y, Okumura K, Ohara O:Prediction of
the coding sequences of unidentified human genes. XIX. The complete sequences of 100 new cDNA clones from brain which code for large proteins in vitro.DNA Res2000,7:347-355.
29. Carninci P, Kasukawa T, Katayama S, Gough J, Frith MC, Maeda N,et al:The transcriptional landscape of the mammalian genome.Science2005, 309:1559-1563.
30. Frith MC, Carninci P, Kai C, Kawai J, Bailey TL, Hayashizaki Y, Mattick JS: Splicing bypasses 3’end formation signals to allow complex gene architectures.Gene2007,403:188-193.
31. Kim TY, Healy KD, Der CJ, Sciaky N, Bang YJ, Juliano RL:Effects of structure of Rho GTPase-activating protein DLC-1 on cell morphology and migration.J Biol Chem2008,283:32762-32770.
32. Kim TY, Vigil D, Der CJ, Juliano RL:Role of DLC-1, a tumor suppressor protein with RhoGAP activity, in regulation of the cytoskeleton and cell motility.Cancer Metastasis Rev2009,28:77-83.
33. Yamaga M, Sekimata M, Fujii M, Kawai K, Kamata H, Hirata H, Homma Y, Yagisawa H:A PLCdelta1-binding protein, p122/RhoGAP, is localized in caveolin-enriched membrane domains and regulates caveolin internalization.Genes Cells2004,9:25-37.
34. Zhong D, Zhang J, Yang S, Soh UJ, Buschdorf JP, Zhou YT, Yang D, Low BC: The SAM domain of the RhoGAP DLC1 binds EF1A1 to regulate cell migration.J Cell Sci2009,122:414-424.
35. Osokine I, Hsu R, Loeb GB, McManus MT:Unintentional miRNA ablation is a risk factor in gene knockout studies: a short report.PLoS Genet2008,4:e34. 36. Berezikov E, Guryev V, van de BJ, Wienholds E, Plasterk RH, Cuppen E:
37. Nord AS, Chang PJ, Conklin BR, Cox AV, Harper CA, Hicks GG, Huang CC, Johns SJ, Kawamoto M, Liu S, Meng EC, Morris JH, Rossant J, Ruiz P, Skarnes WC, Soriano P, Stanford WL, Stryke D, von Melchner H, Wurst W, Yamamura K, Young SG, Babbitt PC, Ferrin TE:The International Gene Trap Consortium Website: a portal to all publicly available gene trap cell lines in mouse.Nucleic Acids Res2006,34:D642-D648.
38. Durkin ME, Avner MR, Huh CG, Yuan BZ, Thorgeirsson SS, Popescu NC: DLC-1, a Rho GTPase-activating protein with tumor suppressor function, is essential for embryonic development.FEBS Lett2005,579:1191-1196. 39. Harris MJ, Juriloff DM:Mini-review: toward understanding mechanisms of
genetic neural tube defects in mice.Teratology1999,60:292-305. 40. Thumkeo D, Keel J, Ishizaki T, Hirose M, Nonomura K, Oshima H,
Taketo MM, Narumiya S:Targeted disruption of the mouse rho-associated kinase 2 gene results in intrauterine growth retardation and fetal death.
Mol Cell Biol2003,23:5043-5055.
41. Shimizu Y, Dobashi K, Iizuka K, Horie T, Suzuki K, Tukagoshi H, Nakazawa T, Nakazato Y, Mori M:Contribution of small GTPase Rho and its target protein rock in a murine model of lung fibrosis.Am J Respir Crit Care Med
2001,163:210-217.
42. Somlyo AP, Somlyo AV:Ca2+ sensitivity of smooth muscle and nonmuscle myosin II: modulated by G proteins, kinases, and myosin phosphatase.Physiol Rev2003,83:1325-1358.
43. van Hinsbergh V, van Nieuw AG:Intracellular signalling involved in modulating human endothelial barrier function.J Anat2002,200:525. 44. Wojciak-Stothard B, Ridley AJ:Rho GTPases and the regulation of
endothelial permeability.Vascul Pharmacol2002,39:187-199. 45. Bayless KJ, Davis GE:Microtubule depolymerization rapidly collapses
capillary tube networksin vitroand angiogenic vesselsin vivothrough the small GTPase Rho.J Biol Chem2004,279:11686-11695.
46. Kawai K, Yamaga M, Iwamae Y, Kiyota M, Kamata H, Hirata H, Homma Y, Yagisawa H:A PLCdelta1-binding protein, p122RhoGAP, is localized in focal adhesions.Biochem Soc Trans2004,32:1107-1109.
47. Burridge K, Chrzanowska-Wodnicka M:Focal adhesions, contractility, and signaling.Annu Rev Cell Dev Biol1996,12:463-518.
48. DeMali KA, Wennerberg K, Burridge K:Integrin signaling to the actin cytoskeleton.Curr Opin Cell Biol2003,15:572-582.
49. Petit V, Thiery JP:Focal adhesions: structure and dynamics.Biol Cell2000, 92:477-494.
50. Boettner B, Van Aelst L:The role of Rho GTPases in disease development.
Gene2002,286:155-174.
51. Sekimata M, Kabuyama Y, Emori Y, Homma Y:Morphological changes and detachment of adherent cells induced by p122, a GTPase-activating protein for Rho.J Biol Chem1999,274:17757-17762.
52. Toker A:The synthesis and cellular roles of phosphatidylinositol 4,5-bisphosphate.Curr Opin Cell Biol1998,10:254-261.
53. Holeiter G, Heering J, Erlmann P, Schmid S, Jahne R, Olayioye MA:Deleted in liver cancer 1 controls cell migration through a Dia1-dependent signaling pathway.Cancer Res2008,68:8743-8751.
54. Berdeaux RL, Diaz B, Kim L, Martin GS:Active Rho is localized to podosomes induced by oncogenic Src and is required for their assembly and function.J Cell Biol2004,166:317-323.
55. Hall A:Signal transduction through small GTPases–a tale of two GAPs.
Cell1992,69:389-391.
56. Ochman H, Gerber AS, Hartl DL:Genetic applications of an inverse polymerase chain reaction.Genetics1988,120:621-623.
57. Hogan B, Beddington R, Costantini F, Elizabeth L:Manipulating the Mouse Embryo: A Laboratory ManualNY: Cold Spring Harbor Laboratory Press, 2 1994.
58. Loo DT, Fuquay JI, Rawson CL, Barnes DW:Extended culture of mouse embryo cells without senescence: inhibition by serum.Science1987, 236:200-202.
59. Strachan LR, Condic ML:Neural crest motility and integrin regulation are distinct in cranial and trunk populations.Dev Biol2003,259:288-302. 60. Ren XD, Kiosses WB, Schwartz MA:Regulation of the small GTP-binding
protein Rho by cell adhesion and the cytoskeleton.EMBO J1999, 18:578-585.
61. Sherman LS, Atit R, Rosenbaum T, Cox AD, Ratner N:Single cell Ras-GTP analysis reveals altered Ras activity in a subpopulation of neurofibroma Schwann cells but not fibroblasts.J Biol Chem2000,275:30740-30745. 62. Scotto-Lavino E, Du G, Frohman MA:3’end cDNA amplification using
classic RACE.Nat Protoc2006,1:2742-2745.
63. Sebo TJ, Schmit JC:Analytical gel electrophoresis of high-molecular-weight RNA in acrylamide-agarose gels containing methylmercuric hydroxide.Anal Biochem1982,120:136-145.
64. Livak KJ, Schmittgen TD:Analysis of relative gene expression data using real-time quantitative PCR and the 2(-Delta Delta C(T)) Method.Methods
2001,25:402-408.
65. Yuan JS, Reed A, Chen F, Stewart CN Jr:Statistical analysis of real-time PCR data.BMC Bioinformatics2006,7:85.
66. Pfaffl MW:A new mathematical model for relative quantification in real-time RT-PCR.Nucleic Acids Res2001,29:e45.
67. Liang CC, Park AY, Guan JL:In vitroscratch assay: a convenient and inexpensive method for analysis of cell migrationin vitro.Nat Protoc
2007,2:329-333.
68. Ghoshal K, Majumder S, Jacob ST:Analysis of promoter methylation and its role in silencing metallothionein I gene expression in tumor cells.
Methods Enzymol2002,353:476-486.
doi:10.1186/1741-7007-8-17
Cite this article as:Sabbiret al.:Identification and characterization of
Dlc1 isoforms in the mouse and study of the biological function of a single gene trapped isoform.BMC Biology20108:17.
Submit your next manuscript to BioMed Central and take full advantage of:
• Convenient online submission
• Thorough peer review
• No space constraints or color figure charges
• Immediate publication on acceptance
• Inclusion in PubMed, CAS, Scopus and Google Scholar
• Research which is freely available for redistribution