Patron: Her Majesty The Queen Rothamsted Research Harpenden, Herts, AL5 2JQ Telephone: +44 (0)1582 763133 Web: http://www.rothamsted.ac.uk/
Rothamsted Research is a Company Limited by Guarantee Registered Office: as above. Registered in England No. 2393175. Registered Charity No. 802038. VAT No. 197 4201 51. Founded in 1843 by John Bennet Lawes.
Rothamsted Repository Download
D1 - Technical reports: non-confidential
Tatnell, L. V., Clarke, J. H., Ginsburg, D., Lutman, P. J. W., Mayes, A.,
Benjamin, L. R., Parsons, D. J., Milne, A. E., Wilkinson, D. J. and Davies,
D. H. K. 2006. Development and validation of 'weed management
support system' (Weed Manager). HGCA project report no. 388. London
Home Grown Cereals Authority (HGCA).
The publisher's version can be accessed at:
•
https://cereals.ahdb.org.uk/media/694826/pr388.pdf
The output can be accessed at:
https://repository.rothamsted.ac.uk/item/89975/development-and-validation-of-weed-management-support-system-weed-manager-hgca-project-report-no-388
.
© 2006, Home Grown Cereals Authority (HGCA).
Project Report No. 388
(Part 1 Pgs 1-48)
February 2006
Price: £5.00
Development and validation of ‘Weed Management
Support System’ (Weed Manager)
by
LV Tatnell
1, JH Clarke
1, D Ginsburg
1, PJW Lutman
2, A Mayes
2, L Benjamin
2,
DJ Parsons
3, AE Milne
3, DJ Wilkinson
3, DHK Davies
41
ADAS Boxworth, Battlegate Road, Boxworth, Cambridge CB3 8NN
2Rothamsted Research, West Common, Harpenden, Hertfordshire AL5 2JQ
3
Silsoe Research Institute, Wrest Park, Silsoe, Beds, MK45 5HS
4Scottish Agricultural College, Kings Buildings, West Mains Road
Edinburgh, Midlothian EH9 3JG
Weed Manager was a collaborative Sustainable Arable LINK (LK0916) project between
ADAS, Rothamsted Research, Silsoe Research Institute and SAC that ran for 5 years,
starting in October 2000 and ending in September 2005. Defra (£812,052, through SA
LINK) and HGCA (£373,022, project 2286) sponsored the project, with industrial support
from Bayer CropScience (£158,868), BASF (£150,255), Dow AgroSciences (£155,320),
DuPont (£150,255), and Syngenta Crop Protection UK (£304,351). The total cost of the
project was £2,104,123.
The Home-Grown Cereals Authority (HGCA) has provided funding for this project but has not conducted the research or written this report. While the authors have worked on the best
information available to them, neither HGCA nor the authors shall in any event be liable for any loss, damage or injury howsoever suffered directly or indirectly in relation to the report or the research on which it is based.
Reference herein to trade names and proprietary products without stating that they are protected does not imply that they may be regarded as unprotected and thus free for general use. No
CONTENTS
ABSTRACT 1
SUMMARY 2
TECHNICAL REPORT 6
1.0 INTRODUCTION - DEVELOPMENT OF ‘WEED MANAGER’ 6
1.1 User Input 7
1.2 System structure 8
1.3 User interface 9
1.3.1 The within-season view 9
1.3.2 The rotational view 12
1.4 Biological models 14
1.4.1 The biological model of weed population dynamics within a season 14 1.4.2 The biological model of weed dynamics in a crop rotation 23
1.5 Decision models 26
1.5.1 The decision model for management of weeds within a season 26 1.5.2 The decision model for management of weeds in a rotation 28
1.6 Herbicide data collation and storage 32
1.6.1 Herbicide data import 34
1.6.2 Herbicide sensitivity data 35
1.7 Herbicide screening trials 35
1.8 Validation 36
1.8.1 Desk-based validation 36
1.8.2 Field validation trials 36
1.9 Weeds and herbicide encyclopaedia 37
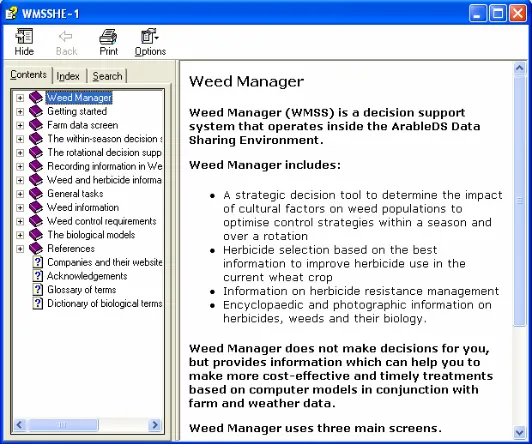
1.10 Help system 40
1.11 Installation 41
1.11.1 Installation program structure 42
1.11.2 Location of installed files 42
1.11.3 Weed Manager upgrades 43
1.12 Dissemination 43
1.13 The future of Weed Manager 44
2.0 ACKNOWLEDGEMENTS 45
3.0 REFERENCES 45
4.0 GLOSSARY OF TERMS 47
6.0 APPENDICES
A: Herbicide Screening experiments 50
B: Field validation trials 52
C: Weed Manager Encyclopaedia (Draft paper version 3 ) 59
D: A model to simulate the growth, development and competitive effect of weeds in a winter wheat crop in the UK (Draft paper version 3)
67
E: Modelling weed management over a rotation in the UK using stochastic dynamic programming (Draft paper )
83
F: A model based algorithm for selecting weed control strategies that maximise profit margin in winter wheat (Draft paper)
98
G: System architecture – A summary 107
H: The resistance module summary 115
I: Example page from a herbicide spreadsheet for product Ally 119
J: Technology Transfer for Weed Manager 120
K: A spray nozzle selection support system for herbicide applications 122
L: User reports by Glasgow Caledonian University*
WMSS User Group Activities - November 2002 to March 2003 WMSS Training Session Results - December 2003
WMSS User Interview results, Field based trials - October 2004 The WMSS Heuristic Evaluation – June 2004
1 12 18 57
1
ABSTRACT
The aim of this project was to develop and validate ‘Weed Manager’, a computer-based Decision Support System module designed to fit within the Arable Decision Support suite of modules to provide farmers, agronomists and distributors with a robust tool to plan and develop weed management strategies.
The system consists of a ‘within-season’ planning tool to investigate a range of weed management strategies in a winter wheat crop in a single season, and a ‘rotational’ planning tool allowing users to consider weed control options over a six-year arable cropping period. Both parts are model based, using data specific to individual farms. The critical objective was to predict the impact of an actual or anticipated weed population on the yield of winter wheat and to investigate a range of mitigation strategies (crop agronomy, weed control options) to reduce or prevent yield loss. Each management option is ranked economically for the user to compare and select. The complex models behind Weed Manager are fully functioning for 13 common arable weed species, including the major UK weeds such as black-grass, chickweed, cleavers and wild-oats. The involvement of intended users via workshops, surveys and events during the development phase (2000-2005) ensured that it is a user-friendly weed management tool.
Additional features of Weed Manager are the herbicide and weed encyclopaedias. There is a comprehensive herbicide database and encyclopaedia containing information on approximately 150 herbicides used in winter wheat. Herbicide data for 20 rarer or more unusual weed species for which data were not previously available were generated through a set of glasshouse screening trials. These results are displayed as additional information in both encyclopaedias. The weeds encyclopaedia also contains detailed information on the weed biology, life cycle, geographic location, environmental effects, identification of, and control measures for, over 140 key arable weed species, along with photographs of all the key growth stages from cotyledon through to flowering. Both encyclopaedias display data used in the decision support part of the system, or can be accessed and used separately. Additional information on specific issues such as herbicide resistance, environmental impacts, biodiversity and cultural control measures are all included.
SUMMARY
The aim of the Weed Management Support System (WMSS) project was to produce a usable and robust decision support system to improve weed management in winter wheat, while promoting environmentally-sound decision making, enhancing crop profitability and the biodiversity of farmland. The WMSS is now known as Weed Manager and is a computer-based Decision Support System module designed to fit alongside the Arable Decision Support (ArableDS) suite of modules and has been commercially available from July 2005.
Weed Manager is one of a range of decision support tools that use the same pesticide, basic agronomic, weather and user farm data; operate within the data sharing environment (DSE) software and have common user interface elements to help users in learning to use the system. Weed Manager provides farmers, agronomists and distributors with a robust tool to plan and develop weed management strategies. The system consists of a ‘within-season’ planning tool to investigate a range of weed management strategies in a winter wheat crop in a single season, and a ‘rotational’ planning tool allowing users to consider weed control options over a six-year arable cropping period. Both parts of the system are model based, using data specific to individual farms.
The project was managed by dividing it into a number of different working groups defined by the specific skills required, and each one was led by individual organisations. The groups were: System Development (Rothamsted), Decision Modelling (SRI), Biological Models (Rothamsted), Weed Biology (ADAS), Herbicides (SAC) and Dissemination (ADAS). Each of these working groups met every 2 months through the 5 years of the project, which ensured that the project was kept on track and met the required milestones. In addition to these working groups a Herbicide Steering Group (led by SAC) and Dissemination Group (led by ADAS) were set up and information from these groups were fed into the biennial Project Management Group meetings involving the whole project consortium.
3
initial default values; understanding and confidence in system assumptions; ability to optimise and compare future strategies and manage herbicide resistance in tactical and strategic decisions. Additional user involvement included a postal survey, email consultations and detailed telephone interviews towards the end of the development phase (March to October 2004).
The user interface displays the two different types of decision tools in the Weed Manager system: within-season and rotational management decisions. The user can rapidly switch between these two different aspects of the program which are referred to as views. Each shows the same weed spectrum, while the management decisions of the within-season module are shown in the first year of the rotational view. Each view is linked to a biological model and a decision model.
The pesticide data that are used in Weed Manager are provided by the DSE which contains statutory herbicide information (from the LIAISON database developed by Central Science Laboratory, York) and data provided by the collaborating chemical companies on efficacy and tank mix information on their specific products. These data are used by the decision support process models to calculate the expected outcomes, which are then displayed to the user on the within-season interface. Basic agronomic data are used to provide default values for drilling and harvest date, crop value, basic cultivation and spray costs, as well as values for variable costs associated with each crop. The system uses local weather data specific to each site and this can be downloaded from the ArableDS web site, with over 100 possible weather sites available. The data are stored in a large access database and are effectively hidden behind the user interface.
chickweed), but the current version only includes a total of 13 species. Herbicide-resistant and susceptible biotypes of grass and broad-leaved weeds are treated separately.
The user can propose a range of cultural practices, rotations and weed control options and the system will calculate the yield losses and economic consequences for a single season or through a rotation. Alternatively, they can use the decision part of the system. The within-season decision model is used when the user selects the ‘suggest treatments’ action from the within-season view in Weed Manager. The objective is to suggest a range of different herbicide and cultivation plans that are then ranked by gross margin for the current season, based on the previous season’s harvest date and a fixed sowing date. The margin used is the value of the grain less the herbicide and cultivation costs. The rotational decision model is used when the user chooses the ‘suggest treatments’ command from the rotational view. Using the biological model of seedbank dynamics it optimises the choice of sowing date, type of cultivation and herbicide cost to find the best weed management strategy throughout a defined rotation of up to 6 years.
Additional features of Weed Manager, that have proved to be extremely popular with the users, are the herbicide and weed encyclopaedias. There is a comprehensive herbicide database and encyclopaedia containing information on approximately 150 herbicides used in winter wheat. Herbicide data for 20 rarer or more unusual weed species where data were not previously available have been generated through a set of glasshouse screening trials that were carried out at ADAS and SAC. These results are displayed in the system as additional information in both encyclopaedias. The weeds encyclopaedia also contains detailed information on the weed biology, life cycle, geographic location, environmental effects, identification of and control measures for over 140 key arable weed species, along with photographs of all the key growth stages from cotyledon through to flowering. Both of these encyclopaedias display data used in the decision support part of the system, or can be accessed and used separately.
5
Detailed phone-based interviews were carried in the last year of the system development with farmers and consultants who had previously agreed to trial Weed Manager during the 2003/04 season. The system was distributed to 50 users, but despite extensive efforts being made to contact all of these people, only 18 of these were finally interviewed. However, excellent feedback was received on a range of questions relating to the overall helpfulness and usefulness of the system and many specific issues relating to the appearance of the screens, decisions and the weed and herbicide encyclopaedias, with useful recommendations highlighted. From the responses received, 72% of people said they would be likely or very likely to use Weed Manager in the future. Some negative comments were made. These usually included a lack of confidence or trust in the output, the time taken to use the system, the lack of integration with current crop data management systems (eg. Muddy Boots), and the perception that the agronomist can more effectively do the same job. The overall message from the user survey showed that Weed Manager, along with the other ArableDS modules are going in the right direction, but the lack of trust and understanding of the potential benefits are hindering the uptake further.
In the first four years of the project various dissemination options were considered. The conclusion was that Weed Manager should be released as part of the ArableDS suite. The major reasons for this included the fact that: non-specific updating costs, i.e. weather, pesticide data and general information could be shared; support and help would be available; the databases, browser and interface existed already; farm information could be input to a central store for all modules.
The first version of Weed Manager is now available on a CD by contacting
TECHNICAL REPORT
1.0 INTRODUCTION - DEVELOPMENT OF ‘WEED MANAGER’
Weed control continues to cause major financial problems for arable farmers and with the ever-increasing threat from herbicide resistance in both grass and broad-leaved weeds the need to make the correct management decision is even greater. Targeting weed control and strategic planning over a whole crop rotation, through achieving maximum benefits from a combination of cultural and chemical control measures may help to reduce costs. The need to balance crop production and farmland biodiversity, along with increased environmental awareness have become important issues, therefore an understanding of the longer-term implications of such practices are required.
Computer-based Decision Support Systems have been in development in many countries around the world for the last decade, once increases in computer power made such computer resource hungry systems feasible. Some of these have been developed by weed biologists and thus have a biology emphasis (e.g. Renner et al., 1999; Berti et al., 2003) whilst others stem from a more pesticide oriented origin and focus on herbicide selection (e.g. Kudsk, 1999). The aim of this project was to endeavour to combine both elements into a system that would assist the choice of herbicide products and explore the biological/agronomic consequences of such choices through a rotation.
7
In order to ensure Weed Manager was a user-friendly system it has been developed by involving Users (farmers, agronomists and distributors) at all stages of the project, from interface design features through to testing the decision making processes.
Weed Manager was developed using user-centred design. It operates within the ArableDS data sharing environment (DSE). The DSE provides a toolkit of components to facilitate development of decisions support modules. These components give access to pesticide, basic agronomic, weather and user farm data as well as providing common user interface elements which help users in learning to use the system (DESSAC final report, 2000; Parsons et al., 2004 & Defra AR0915 Final report).
The following report includes a summary of all aspects of the development of Weed Manager, from initial user consultation through to the system launch in July 2005. The full details of many of the models and the methodology of the validation trials are located in appendices.
1.1 User Input
A series of User activities took place between December 2000 and October 2004. In the early development phase of the project the users were consulted and provided feedback on the screen design and content of the system, through a number of workshops at various locations in England and Scotland. A number of key points were highlighted from these early consultations that focused the development (Summary in Appendix L, section 1.0). These included:
• easy data entry and links to other systems; to intervene and override initial default values
• understanding and confidence in system assumptions
• optimise and compare future strategies
• manage herbicide resistance in tactical and strategic decisions
Additional user involvement included a postal survey, email consultations and detailed telephone interviews.
Between March and October 2004 detailed phone based interviews were carried out with farmers and consultants who had previously agreed to trial Weed Manager (Version 2Ua) during the 2003/04 season (The full details of the final questionnaire results and conclusions are summarised in Appendix L, section 3.0). The system was distributed to 50 users, but despite extensive efforts being made to contact all of these people the final number interviewed was only 18 (7 farmers; 9 consultants; 2 lecturers). However, excellent feedback was received on a range of questions relating to the overall helpfulness and usefulness of the system and many specific issues relating to the appearance of the user interface, decisions and the weed and herbicide encyclopaedias, with useful recommendations highlighted. From the responses received 72% of people said they would be likely or very likely to use Weed Manager in the future. The reasons behind this included how useful it would be in supporting complex decision making, strategically planning control strategies, teaching, or dealing with unfamiliar problems that may arise. In particular the rotational aspect of the system and the weed encyclopaedia were considered to be extremely informative and of great value to the user. Where negative comments were made they usually included a lack of confidence or trust in the output from the system, the time aspects of using the system, the lack of integration with existing crop data management systems (eg. Muddy Boots), or the perception that the agronomist does the same job.
The overall message from the user survey showed that Weed Manager, along with the other ArableDS modules are going in the right direction, but the lack of trust and understanding of the potential benefits are hindering the uptake further. These comments were carefully considered and during the remaining months of the system development and through careful publicity to increase the public awareness of how the system functioned and the potential benefits these issues were addressed.
1.2 System structure
9
functionality as required and can be developed on multiple sites. The module is described in more detail in the system architecture summary in Appendix G.
Fig. 1 The outline structure of the Weed Manager system.
1.3 User interface
As described earlier, Weed Manager has been designed to support two types of decisions: within-season decisions on the control of weeds in a single winter wheat crop ( within-season), and rotational management decisions that consider strategies for weed control over several years (rotational). The two aspects of the program are referred to as views, and the user can rapidly switch between them by clicking a button on the toolbar. The first year of the rotational view always shows the same weed management decisions as the within-season view. Each view is linked to a biological model and a decision model, which are described below.
1.3.1 The within-season view
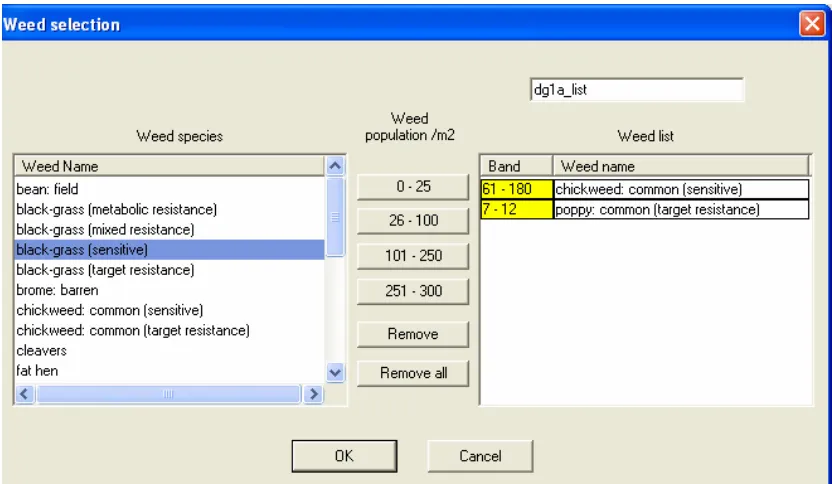
done through the weed list editor, which is presented to the user automatically (Fig. 2). At this point, the weeds of interest and estimates of their expected density in the crop, in terms of one of 4 density bands, are selected (see section 3.5). After saving the list, the program proceeds to the within-season view. It is possible to return to the weed list editor at any time.
Fig. 2 The weed list editor
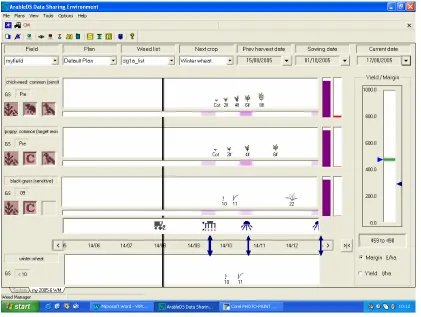
The within-season view can be used prior to sowing or at the time a weed problem is evident in a field of winter wheat. This can be at any time from just after harvest of one crop to the harvest of the next crop. The screen layout shares many features with other ArableDS programs, which makes it easier for users to learn (Fig. 3). Below the usual menu and toolbars, there is an information bar showing basic details of the field crop and key dates. Clicking on the buttons next to them can edit all these.
11
Additional information on each weed is provided down the left of the screen. Up to 3 icons (from a total of 8 icons, see section 5) can be displayed to indicate features such as sensitivity to frost, or importance for wildlife. To the right of the growth stage panel for each weed, two vertical bars display the kill rate calculated by the model for the current cultivation and herbicide sequence and the yield loss resulting from the weed population. On the far right of the screen another vertical bar shows the estimated yield (t/ha) or economic margin and the degree of uncertainty in the estimates.
Fig. 3 The within-season view
The settings dialog can be used to change the crop-dependent information, such as the expected yield, density, variable costs and grain price. As the season progresses, it is also possible to add observations of the crop and weeds, giving the growth stage and the density observed on a particular date. These are used to revise the predictions of the model, to make them more accurate.
The within-season module can be run at any time by selecting the current date from the date button. These features make it very easy to experiment with different cultivation sequences and herbicides to see their effect on the weeds, the crop yield and the gross margin. However, the range of options is huge, and it may be difficult to find the best combination. To help with this, the system includes the suggest treatments feature. Provided that a chemical list of fifty products or fewer has been selected, this will search through thousands of combinations of cultivations and herbicide programmes to produce a list of those that give good margins. This is described further in the section on the decision model for management of weeds within a season (section1.5). Having obtained a list of management programmes, one can then be selected for more detailed examination in the main view.
The menu and tool bar also provides access to the herbicide resistance module (see Appendix H) and the spray nozzle selection module (See Appendix K).
1.3.2 The rotational view
13
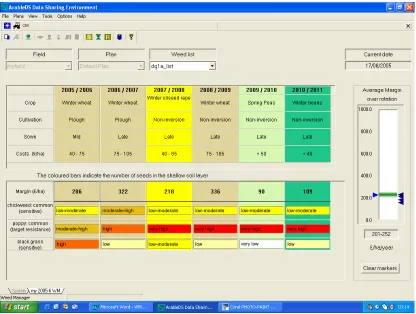
Fig. 4 The Rotational view
A grid occupies most of the screen in which the columns represent growing seasons. The upper part of the screen has rows showing the crop, type of cultivation (plough or non-inversion), sowing date (early, mid or late), and herbicide costs (divided into 4 bands). The user defines the possible crops that could be grown on the field at the outset. Other than the crop and cultivation for the first year, which are fixed, any of the other pieces of information can be changed directly by right clicking on the grid cell. The results of changes are recalculated immediately and redisplayed.
As with the within-season view, this screen can be used interactively, or optimised by choosing suggest treatments. In this case the user can choose how many years, up to 5, to include in the rotation. The decision model for management of weeds in a rotation finds the optimum strategy consisting of cultivation type, sowing date and herbicide cost for the whole rotation and presents it on the screen.
During the final year of the project a detailed examination of the user interface (heuristic examination) was carried out by Caroline Park of Glasgow Caledonian University (Appendix L) where design issues were highlighted and addressed.
1.4 Biological models
1.4.1 The biological model of weed population dynamics within a season
A critical objective of Weed Manager is to predict the impact of an actual or anticipated weed population on the yield of winter wheat and then to determine how yield loss can be mitigated by alternative management strategies (crop agronomy, weed control). The outcome of the biological model of weed competition is then used within the decision model to select and rank near-optimal solutions on the basis of margin.
The biological models have been fully parameterised for thirteen major weed species: black-grass, barren brome, common chickweed, cleavers, fat hen, knotblack-grass, annual meadow-black-grass, common poppy, Italian ryegrass, wild-oat and the two broad-leaved crop volunteers, oilseed rape and field beans. Additionally, for black-grass, Italian ryegrass, wild-oat, common poppy and common chickweed, the models will differentiate between populations with target site or metabolic herbicide resistance, or those with a combination of the two.
15
found that variability in assessing leaf areas makes predictive models based on leaf areas hardly more reliable than density models (Cussans, 2005, pers. comm.).
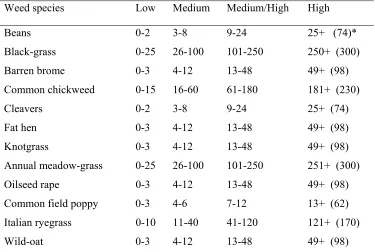
Although the biological models will function with a continuum of weed densities of 1 – n, it is not realistic for users to input precise density information on the weed infestations present in a given field. This is mainly due to the time involved in collecting such information and because of the intrinsic variability of densities within a field. However, it was felt that it was appropriate for users to identify the approximate densities, on the basis that ‘this field has a bad infestation’ of one weed and a ‘light infestation’ of another. Consequently, each weed has been allocated four density bands, ranging across the spectrum of yield responses from virtually uncompetitive infestations through to highly competitive ones. The bands for each species were established independently, but species of similar competitive ability tend to have similar bands (Table 1).
Table 1 Density bands (plants/m2) used in Weed Manager for estimating yield losses
Weed species Low Medium Medium/High High
Beans 0-2 3-8 9-24 25+ (74)*
Black-grass 0-25 26-100 101-250 250+ (300) Barren brome 0-3 4-12 13-48 49+ (98) Common chickweed 0-15 16-60 61-180 181+ (230)
Cleavers 0-2 3-8 9-24 25+ (74)
Fat hen 0-3 4-12 13-48 49+ (98) Knotgrass 0-3 4-12 13-48 49+ (98) Annual meadow-grass 0-25 26-100 101-250 251+ (300) Oilseed rape 0-3 4-12 13-48 49+ (98) Common field poppy 0-3 4-6 7-12 13+ (62) Italian ryegrass 0-10 11-40 41-120 121+ (170) Wild-oat 0-3 4-12 13-48 49+ (98) * for modelling purposes the number in brackets is taken as the upper limit
biological characteristics of the species, the weather (temperature and rainfall) and cultural practices.
Finally, the information on the emergence and growth of crop and weeds is converted into anticipated growth stages which are presented visually to users and also drive the selection of herbicide products, as the activity of herbicides varies with the size and growth stage of the target weeds.
1.4.1.1 Description of the Within-season Model
Climate and Astronomical Data
The model determines day length depending on time of year and latitude. Weather data such as maximum and minimum temperatures, rainfall, radiation and evapo-transpiration have been collated from a range of sites in the United Kingdom. Users can use the site closest to their farm/field as a source of this information, but they can also import their own weather data, if they have it available.
Seedling emergence
17
The system assumes two basic types of cultivation, non-inversion and ploughing. The former leaves the seeds shed in the previous year in the top 10cm of soil, where they are available to germinate and so seedling emergence is linked to the timing of the harvest of the previous crop (as outlined above). However, ploughing is assumed to bury the majority of seeds present on the soil surface and introduces a new (older aged) population of seeds from the deeper seedbank to provide the basis for future seedlings. Consequently, calculations of emergence of seedlings, where ploughing is the primary cultivation, are initiated at the date of ploughing.
Phenology-development of crop and weeds
As explained earlier, the decision models need information on the growth stage of crop and weed, as these impact on herbicide choice. For graminaceous weeds the standard decimal growth stage code for wheat was adopted (Zadoks et al.., 1974). Leaf, tiller, node and ear development has been associated with the temperature and day-length, based on a previously established model of Milne et al., (2003). A similar approach is taken for broad-leaved weeds except that the number of stages calculated is smaller. The growth stage of the most precocious cohort is used within the decision model and is presented to users on the ‘within-season’ screen (Fig. 3).
Crop Yield Loss
The estimation of crop yield loss is based on a combination of an ecophysiological model that predicts the early growth of wheat and weeds, combined with a simple empirical yield loss equation. The growth of each weed species in the community from emergence to canopy closure is simulated using an ecophysiological model (Kropff & van Laar, 1993). The initial green area of each cohort of weeds and wheat is ‘grown’, primarily based on the attributes of the species and the temperature, until the total green area index (GAI) reaches 0.75, which is taken as the point of canopy closure. Yield loss from each species is predicted from the relative proportions of the crop and weed leaf area, according to the model of Kropff et al., (1995). The yield loss from each species depends on the relative green leaf area at canopy closure and the competitive ability of the species defined as the damage coefficient (q). Yield losses from several species are summed, assuming no interspecific competition. Although this is not scientifically accurate, it is an adequate approximation, since most weed populations will not be in the very high category, where such competition could be important.
Weed control measures
an efficacy that varies with the species, the product/method used and the weed growth stage. Each weed species, growth stage and product combination has been assigned a level of weed kill varying from 91% for weeds susceptible to a treatment down to 1% for weeds resistant to a particular treatment. If a sequence of operations is proposed the model calculates the consequences using a multiplicative survival method. The reduction in leaf area of the weeds is then fed into the yield loss model and the reduction in yield loss calculated. In order to simplify the computation of yield losses the model assumes that the reduction in green area is effective at canopy closure and therefore does not include elements associated with effects of the timing of control on the yield loss incurred. It was felt that for most weed treatments in autumn and early spring this was an acceptable approximation.
Observations
The core calculations of this biological model have assumed that the user is using Weed Manager as a strategic tool prior to sowing the winter wheat. The user simply inputs the weed density anticipated. It can also be used once the crop has been sown. Using the observation dialogue the user can input weed densities or weed ground cover, and alter predicted growth stages. This information is used to refine the model predictions to date and for the rest of the season.
Outputs from the model
The fundamental output from the model is the yield loss caused by the weed(s) present. This is then given a financial value based on the value of the crop and the anticipated weed free yield (information provided by the user). The financial loss is balanced by the costs incurred in preventing that loss by controlling the weeds. These costs include cultivation and establishment costs, and herbicide plus application costs. The balance between costs and benefits of control is used in the optimisation programme to select the most cost-effective treatment.
The impact of the weeds on crop yield is changed by a wide range of factors, as outlined above, that influence the time and periodicity of emergence of the weeds, the time of emergence of the crop, the vigour of the weeds and the crop and the performance of weed control techniques (herbicides and mechanical weeding). The user can change the following factors:
19 5. crop drilling date and density
6. date of weed control treatment
7. type of weed control treatment (primarily herbicide choice) 8. maximum anticipated weed free yields (t/ha)
9. price of wheat (£/t)
Some of these factors (e.g. crop harvest date, crop price, crop density) are set as ‘default values’ by the system unless the user changes them, but the system will initially assume no weed control treatments have been applied. This provides information on the competitive impact of the weed under the infestation level, cultivation, sowing date and weather conditions provided by the user.
1.4.1.2 Examples of outputs from Weed Manager - Within-season Model
Comparison of twelve weeds with contrasting primary cultivations
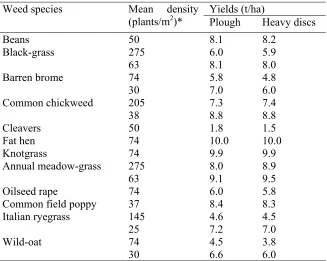
Table 2 Modelled yield losses by the 12 weed species following ploughing or heavy discs as the primary cultivation, in the absence of weed control.
(Bedford weather, primary cultivation 15 September, sowing date 1 October, weed-free yield 10 t/ha, crop density 150-199 plants per m2).
Weed species Mean density Yields (t/ha)
(plants/m2)* Plough Heavy discs
Beans 50 8.1 8.2
Black-grass 275 6.0 5.9
63 8.1 8.0
Barren brome 74 5.8 4.8
30 7.0 6.0
Common chickweed 205 7.3 7.4
38 8.8 8.8
Cleavers 50 1.8 1.5
Fat hen 74 10.0 10.0
Knotgrass 74 9.9 9.9
Annual meadow-grass 275 8.0 8.9
63 9.1 9.5
Oilseed rape 74 6.0 5.8
Common field poppy 37 8.4 8.3 Italian ryegrass 145 4.6 4.5
25 7.2 7.0
Wild-oat 74 4.5 3.8
30 6.6 6.0
* Densities presented are the mean values of the relevant density bands (Table 1)
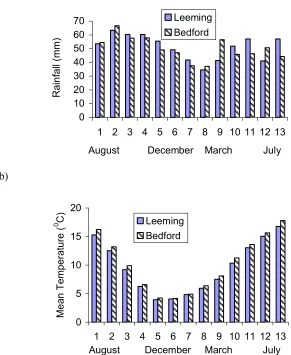
Table 3 Comparison of the effects of weather/climate/location on the competitive effects of weeds, as reflected in wheat yields (t/ha): a) Bedford and b) Leeming weather (weed free yield = 10 t/ha)
Bedford Leeming Weed species Mean density
(plants/m2) Plough Heavy
discs
Plough Heavy discs
Black-grass 275 6.0 5.9 5.6 6.3
Barren brome 74 5.8 4.8 4.2 3.3 Common chickweed 205 7.3 7.4 6 6.3
Cleavers 50 1.8 1.5 2.1 1.1
Comparison of the effects of climate/location
21
rainfall primarily drive these competition effects, but as rainfall was adequate at both sites (Fig. 5) this was probably not a critical factor. As the model uses a higher base temperature for wheat than most weeds, the crop is more sensitive to difference in winter temperatures, possibly explaining the difference between the two sites.
a)
0 10 20 30 40 50 60 70
1 2 3 4 5 6 7 8 9 10 11 12 13
Rainfall (
m
m
)
Leeming Bedford
August December March July
b)
0 5 10 15 20
1 2 3 4 5 6 7 8 9 10 11 12 13
M
ean T
em
per
atu
re (
0 C) Leeming
Bedford
August December March July
Fig. 5 Comparison of the weather data from Leeming and Bedford a) total rainfall and b) mean temperature over a yearly set of thirteen 4-week periods starting from 1 August.
Effects of weed control
florasulam (Boxer) is applied at a high rate it will control the weed but a lower rate will not. Trifluralin will give some control, slightly increasing yields, whilst amidosulfuron (Eagle) has no effect and yield losses are the same as the untreated. These different weed responses are based on the control values in the herbicide data base (section 1.6) which are used to calculate the reduction in the weed green area and thus the yield loss the weeds can cause (see above).
The models have also been modified to accommodate the presence of herbicide resistant biotypes of some weeds. Table 5 gives an example for the most abundant species exhibiting resistance, black-grass. Clodinafop + trifluralin (Hawk) and iodosulfuron + mesosulfuron (Atlantis) will give high control of black-grass and thus yields approach the 10t/ha weed free yields. Isoproturon is less effective on the weed and thus yields are lower. If the black-grass has target site resistance the clodinafop treatment will also fail, but this type of resistance will not affect the other two products. If the weed has the ability to metabolise the herbicides the clodinafop and the isoproturon will be less active and so yields decline. The most robust treatment is the iodosulfron + mesosulfuron mixture, as this protected yields from competition from all three types of black-grass. However, it should be pointed out that although little resistance exists currently to Atlantis, careless use could result in increased resistance. The herbicide resistance sub-model will emphasise inappropriate product use that increases this risk of resistance.
Table 4 Response of crop yields to the use of several treatments to control common chickweed at 205 plants/m2 (products and dates of treatment) (Leeming site, ploughed, crop
sown 1 October, weed free yield 10t/ha).
Herbicide treatment Dose (kg or l/ha) Date of application Wheat yields (t/ha)
None N/a N/a 6.0
Quantum 0.02 kg/ha 23-Mar 9.4
Alpha Isoproturon 5.0 l/ha 23-Oct 9.4
3.0 l/ha 23-Oct 6.0
5.0 l/ha 23-Nov 7.4
Boxer 0.1 kg/ha 23-Mar 9.4
0.05 kg/ha 23-Mar 6.0
Alpha trifluralin 2.3 l/ha 05-Oct 7.3
23
Table 5 Response of crop yields to the use of several treatments to control susceptible, target site and metabolic resistant black-grass at 275 plants/m2. (Leeming site, ploughed, crop sown
1 October, weed free yield 10t/ha, herbicides all applied 23 December).
Herbicide treatment Dose (kg or l/ha) Resistance status of black-grass
Susceptible Target Site
Resistant
Metabolic Resistant
None 5.6
Alpha Isoproturon 5/l/ha 6.8 6.8 6.4
Hawk 2.5l/ha 9.2 6.1 7.7
Atlantis 0.4 kg/ha 9.4 9.1 9.1
Thus, the biological models will accommodate a series of different scenarios, ranging from different cultivations, through effects of drilling dates and sites, to the effects of pre- and post-emergence herbicides.
1.4.2 The biological model of weed dynamics in a crop rotation
One of the main aims of Weed Manager was to provide information and advice on strategic management of weed populations over several years in a crop rotation. Unlike most other plant protection decisions, the consequences of weed management can persist for many seasons. The biological model of weed dynamics was designed to provide the quantitative information for the rotational view in the Weed Manager program and to be used by the corresponding decision model. A detailed description can be found in Appendix D.
The model is based on the life cycle model developed by Moss (1990) for black-grass (Alopecurus myosuroides Huds), but can be applied to many annual plant species. In essence, it is based on estimation of seed fecundity and survival. Similar models have been proposed by Doyle et al. (1986) and Cousens et al. (1986) to describe the life cycle of black-grass and wild oats (Avena fatua L.) respectively. Because of the large uncertainties present in the weed life cycle, it is necessary to describe the population changes by probability distributions, leading to a stochastic model. However, using probabilities for every step is likely to make the model unnecessarily complicated. In the present model, the population is described by a distribution, but the operations performed on it are deterministic.
The state variables in the model are the seedbanks (seeds/m2) immediately after harvest in two
A series of processes determines the seedbank the following year. Cultivations cause an exchange of seeds between the two soil layers. Ploughing moves almost all of the seeds from the shallow layer to the deep one and brings up a substantial proportion of seeds from the deep layer. Non-inversion operations cause much lower proportions of the seeds to be exchanged. A proportion of the seeds in the shallow layer germinate to produce immature plants. Cultivations or herbicides kill some of these, those remaining develop into mature plants. The mature plants produce seeds, of which some are non-viable and some are lost to herbivory. The remaining viable seeds are added to the shallow layer. At the same time, a proportion of the ungerminated seeds die during the year.
Some of the processes outlined above depend on the weed species, some on the operations applied and some on both. The effect of cultivations on the exchange of seeds between the layers is independent of the weed species and the timing, because it depends only on the physical operations. Other than the parameters quantifying these exchanges, all of the others are stored in databases so that they can be revised independently of the model.
The germination rate depends on the species: very low in poppy, for example, and almost all of the seeds in volunteer oilseed rape and field beans. Similarly the mortality rate varies widely, up to the extreme case of barren brome, which does not survive between seasons in the deep layer. In contrast poppy seeds are highly persistent. Similarly, the number of seeds produced and their viability are species dependent.
25
In order to provide a clear display to the user, and to enable the weed control programme to be optimised by the decision model, the seedbank variables are divided into discrete ranges. These are related to the bands used to set the initial weed density for the within-season model, but the full range is divided into 6 bands (instead of 4 input bands) to give greater resolution. The effects of cultivation methods on the seedbank are substantial and systematic. Therefore, the bands for the shallow layer are derived from the weed density bands in such a way that the top five seedbank bands generate weed populations, covering the full range when ploughing is used in the absence of herbicides. The lowest band is set to correspond to the lowest weed density band when using non-inversion cultivation. This ensures that the behaviour of the first year of the rotational model is consistent with the within-season model. Other than the cultivation method, the most important parameter linking the two sets of bands is the germination rate: if it is high then the number of seeds required to produce a given weed density is low.
The deep layer bands are derived from the shallow ones, by calculating the ratio between them that would exist if the model were in steady state. Although this is rarely the case in practice, it gives a reasonable estimate for well-controlled weeds. The ratio depends on the parameters for seed movement between the layers and on the seed mortality rate.
When the model is initialised from the within-season model, the plant density numbers corresponding to the ends of the band chosen by the user are converted by the same method to give an initial range of seed populations in each layer. It is assumed that the actual number in each layer is a random number uniformly distributed over this range. The model described above is applied to the four states corresponding to all the combinations of the upper and lower bounds for the two layers. The lowest and highest values resulting for each layer are taken, and the seed populations are assumed to be uniformly distributed across this range. The required state variables, the probabilities of being in each band, are then the proportions of the total range lying within each band. For the purposes of the interactive display, the state is then assumed to be the band with the highest probability. However, the decision model uses these probabilities and uses them as the initial state for the following year, resulting in a stochastic model.
1.5 Decision models
1.5.1 The decision model for management of weeds within a season
The within-season decision model is used when the user selects the suggest treatments action from the within-season view in Weed Manager. The objective is to suggest a range of different herbicide and cultivation plans that result in good margins for the current season, based on the previous season’s harvest date and a fixed sowing date. The margin used is the value of the grain less the herbicide and cultivation costs. The suggested treatment list is produced within a reasonable time on a typical office PC. The decision model is described in more detail in Appendix F.
The biological model has three main aspects that are relevant to the decision model: the timing of emergence of the crop and cohorts of weeds; the growth of the crop and untreated weeds to canopy closure; and the impact of treatments on the green leaf area (GAI) of the weeds and wheat at the time of canopy closure. As described above, the timing of weed emergence is determined by the previous harvest date, the sowing date, and the tillage operations between these dates. The other cultivation operations, such as rolling or tine weeding, operate in the model in the same way as herbicides and are treated as such by the decision model. The emergence timings then determine the growth of the untreated crop and weeds to canopy closure. This date is unaffected by any herbicide treatments applied during the season. Within the model, the effect of herbicides is simulated by reducing the GAIs of the weeds at the predetermined canopy closure date, and calculating the effect on crop yield based on these GAIs. This separation of the effects of cultivations and herbicides is important for the decision model, because the effects of herbicides on yield can be evaluated very quickly, whereas any operation that changes the timing of canopy closure requires a full run of the model. The decision model operates in a series of phases to reduce the time taken to reach a set of solutions.
27
and drill on 3 consecutive days, and direct drilling. If a cultivation has already taken place, the search is limited to considering a second cultivation. If there have been no cultivations, but the date is within 2 days of drilling, the only option is direct drill.
Having chosen up to 3 cultivation sequences, the second phase is to select the herbicides to be considered. The user will have specified a working list of herbicides, but post-drilling cultivations (eg. tine weeding) are also considered. Some herbicides can be applied at different doses, but there are several rules that restrict when they can be applied. The most important rules are the product approvals, which are mandatory and cover dose and timing. There are also recommendations from the herbicide manufacturers that cover circumstances in which efficacy may be reduced, such as cold weather and particular growth stages. As the decision model is trying to achieve good weed control, it only considers programmes that meet the recommendations. Finally, product mixtures are restricted to include only those on the system’s recommended list. Note that some mixtures, where there are known synergistic effects, are treated as products in their own right. The decision model defines 4 consecutive spraying periods: pre-emergence, autumn, spring and desiccant (pre-harvest). Within each of these, application dates are selected at intervals of 14 days. Each herbicide is checked against the rules at each of these application dates; those that pass are then considered in the next phase.
In the third phase, the effect of each herbicide is evaluated at each of the timings within each spray period to find which timing in each period gives the lowest yield loss. All permitted mixtures of 2 products are evaluated in the same way. Any product or mixture that has efficacy equal to or lower than a cheaper one is eliminated. The result is a list for each period containing applicable herbicides and mixtures with their best timings.
The fourth phase uses the results of the third to evaluate all the permitted programmes containing combinations of the remaining herbicides and timings. This results in a list of programmes, ranked by the resulting margin.
several herbicides. It is then reduced progressively until the desired list length has been reached. The normal target is 20 when the lists for all the cultivation options are combined.
1.5.2 The decision model for management of weeds in a rotation
The rotation decision model is used when the user chooses the suggest treatments command from the rotation view. Using the biological model of seedbank dynamics it optimises the choice of sowing date, type of cultivation and herbicide cost to find the best strategy throughout a rotation of up to 6 years. Full details are given in Appendix E.
As described above, the biological model is a stochastic simulation of seedbank dynamics using two soil layers, 0–50 mm and 50–250 mm, to describe the seedbank. Within each layer, the seedbank is divided into 6 bands, so the state variable for a single weed is a pair of integers (i, j), each lying between 1 and 6, representing the number of seeds in each layer following the harvest of the previous crop. The decision variables are the sowing date (early, mid or late), the type of cultivation (plough or non-inversion) and the herbicide cost (in one of 4 cost bands). The choice of crop is not a decision variable: the user must choose the rotation before attempting to optimise the other decisions. The model takes the state and the decision, and predicts the probability distribution of states at the end of the year, that is the seedbank following the next harvest.
This formulation of the model allows it to be optimised using a finite horizon, stochastic dynamic programme (Howard, 1960). Stochastic dynamic programming is designed to solve sequential decision problems of this type. The solution takes the form of the policy that maximises the long-term expected (mean) return. A policy defines the decision to take for every possible state of the system. If the model is stationary (the available states, decisions and transition probabilities are identical each year) and obeys the axioms of a Markov process, it is possible to obtain an infinite horizon, by iterating for many years until a steady-state is reached. The finite horizon solution used in Weed Manager maximises the expected return over a period of 8–10 years depending on the length of the rotation. It could be converted into an infinite horizon problem by using a hierarchical approach (Kristensen, 2000), in which a complete rotation was one iteration of the larger problem, but the solution time would be prohibitive.
29
weeds required 15540 s (over 4 hours). As a result, Weed Manager simply considers the two most competitive weeds in the optimisation.
In Weed Manager, the return from a single year is the gross margin for the crop. This is calculated from the base yield, the yield loss due to weeds, the crop price, a cost for the type of cultivation, the herbicide cost and a crop-dependent sum for the other variable costs. The expected return for a single year is the sum of the returns for all the possible states, weighted by their probabilities. The expected return over the rotation is the sum of the returns for the years, weighted by a discount factor to account for interest and inflation, plus a terminal return for the state in the final year. The terminal return is required in a finite horizon dynamic programme, because the final state will have an effect on future years. Without it the cost of leaving a high final seedbank would be underestimated. The value used is the single-year return that would result if the system were maintained in steady-state, weighted by the discount factor (Sells, 1995).
Tables 6-9, which are taken directly from the program output, illustrate the results. A base case was set up as shown in Table 6, using a rotation of 2 years of wheat followed by a winter break crop, with a mixture of cultivations, moderate herbicide costs and mid sowing dates. The weeds considered were black-grass with target site resistance and barren brome. The initial plant densities were set to the second band, which would equate to low-moderate seedbanks. Note that the table shows the results at the end of the first season, when the seedbanks had increased. The expected margin was £152/ha with a range of £0–303, and the weed seedbank was higher at the end than the start. Table 7 shows the results of optimising this system. The sowing date was changed to late in every year, non-inversion tillage was replaced by ploughing, and the herbicide cost on the wheat, but not the break crops, was increased. The expected margin was £246/ha, with much less variability. The barren brome seedbank was well controlled, and the black-grass fairly well. Note that the optimisation begins in the second season; the first is unchanged.
oilseed rape. Looking at the individual years, the margins of all the crops following the break had increased, but the margin for the break crop itself was lower, as would be expected. The most significant difference was the improvement in the control of the black-grass population.
31
Table 6 Rotational model example, winter cropping, before optimisation.
Season 2005 / 2006 2006 / 2007 2007 / 2008 2008 / 2009 2009 / 2010 2010 / 2011 Crop Winter wheat Winter wheat Winter oilseed rape Winter wheat Winter wheat Winter beans Cultivation Plough Non-inversion Plough Plough Non-inversion Plough
Sown Mid Mid Mid Mid Mid Mid
Cost (£/ha) 40 - 75 40 - 75 40 - 85 40 - 75 40 - 75 40 - 65 Number of seeds in the shallow soil layer
black-grass (target
resistance) high very high high very high very high very high brome: barren high very high moderate-high moderate-high very high high
Margin (£/ha) 259 140 160 190 148 14
Average margin over rotation £152/ha (0-303)
Table 7 Rotational model example, winter cropping, after optimisation.
Season 2005 / 2006 2006 / 2007 2007 / 2008 2008 / 2009 2009 / 2010 2010 / 2011 Crop Winter wheat Winter wheat Winter oilseed rape Winter wheat Winter wheat Winter beans Cultivation Plough Plough Plough Plough Plough Plough
Sown Mid Late Late Late Late Late
Cost (£/ha) 40 - 75 75 - 105 40 - 85 75 - 105 75 - 105 40 - 65 Number of seeds in the shallow soil layer
black-grass (target
resistance) high low-moderate moderate-high low-moderate low-moderate low-moderate brome: barren high low-moderate low very low very low very low
Margin (£/ha) 259 307 194 320 322 72
Average margin over rotation £246/ha (209-283)
Table 8 Rotational model example, including a spring crop, before optimisation.
Season 2005 / 2006 2006 / 2007 2007 / 2008 2008 / 2009 2009 / 2010 2010 / 2011 Crop Winter wheat Winter wheat Spring oilseed rape Winter wheat Winter wheat Winter beans Cultivation Plough Non-inversion Plough Plough Non-inversion Plough
Sown Mid Mid Mid Mid Mid Mid
Cost (£/ha) 40 - 75 40 - 75 40 - 75 40 - 75 40 - 75 40 - 65 Number of seeds in the shallow soil layer
black-grass (target
resistance) high very high low very high very high high brome: barren high very high very low very low low-moderate low
Margin (£/ha) 259 140 86 199 222 43
Average margin over rotation £158/ha (35-281)
Table 9 Rotational model example, including a spring crop, after optimisation.
Season 2005 / 2006 2006 / 2007 2007 / 2008 2008 / 2009 2009 / 2010 2010 / 2011 Crop Winter wheat Winter wheat Spring oilseed rape Winter wheat Winter wheat Winter beans Cultivation Plough Plough Non-inversion Non-inversion Plough Plough
Sown Mid Late Late Late Late Late
Cost (£/ha) 40 - 75 75 - 105 < 40 75 - 105 75 - 105 40 - 65 Number of seeds in the shallow soil layer
black-grass (target
resistance) high low-moderate low low-moderate low low brome: barren high low-moderate very low very low very low very low
Margin (£/ha) 259 307 134 337 331 77
1.6 Herbicide data collation and storage
The data related to weed control were gathered and collated by SAC. The data were initially sourced from the participating agrochemical companies: BASF, Bayer CropScience (initially Aventis), Dow Agrochemicals, DuPont (UK) Ltd and Syngenta.
In order to ensure that there were examples of active ingredients not produced by those companies, agreement was obtained from Agrichem Ltd, Headland Agrochemicals Ltd, Makhteshim-Agan (UK) Ltd and Monsanto (UK) Ltd to include certain of their products. In most of these cases, SAC entered the data sets because the companies did not have the staff to undertake such work. SAC also entered data for the key participating companies where required and as requested.
The relevant company audited any data entered by SAC, except where there was an agreement that SAC would audit. A different staff member did this from the person who had done the initial data entry where possible, and was only undertaken for the secondary group of companies: Agrichem, Headland and Makhteshim Agan.
Data on physical and cultural weed control was entered by SAC utilising key literature (notably Davies & Welsh, 2001), and available expertise.
The herbicide data that should be included in the system was agreed during the WMSS project Group Leaders and Herbicide Group meetings. The WMSS Herbicide Group including representative of each of the key funding companies, the UKASTA and AICC representatives of the WMSS Steering Group and members of the WMSS Group Leaders as required. The Herbicide Group not only discussed herbicide data management, but also assisted in responding and advising in system design and in selection of herbicide information for the encyclopaedic modules.
Herbicide data collected - Herbicide X Weed Interactions
33
recommended dose against each growth stage of each weed was entered on a scale S (>90% control; 95% for black-grass), MS (75-90%), MR (50-75%), R (<50%) and U unknown.
It was agreed the basic selection programme would be based on label dose recommendations (level 1) but that extra information on weeds with those doses would be provided where possible (level 2). Again when available, some companies donated data on lower than recommended rates (level 3) – but this was only included as encyclopaedic data rather than part of the selection programme, because of liability concerns.
Other published data on low doses was entered by SAC onto the encyclopaedic section, as was information on a screening programme of rarer weeds undertaken by ADAS Boxworth and SAC Edinburgh (level 4) (see Appendix A).
To obtain mixtures of herbicides, key mixtures were entered as if single products but the system was designed to be able to mix products using an additive control approach. The companies provided information on recommended mixtures and mixtures to be avoided for various reasons, and further spreadsheets were provided for such data entry.
The need for sequences to be part of the herbicide selection programme entailed the development of a further spreadsheet that indicated the time interval allowed between use of individual herbicide products. To this was added a further spreadsheet which included following crop and cultivation requirements after using specific herbicides or mixtures/sequences of herbicides. This information was to be included in the encyclopaedia.
Further information on herbicides collected for the encyclopaedic section included statutory information via LIAISON, a pesticide database programme based at CSL York, and Environmental Information Sheets from the agrochemical companies. Further label information was included, along with lists of weeds and levels of control derived from the spreadsheets described above.
Problems and Solutions
Frequent changes in product approvals and recommendations show the need for regular updating of the database, although once a year, probably in early summer, is probably an acceptable compromise. The basic information/data was collected as required by the Milestones, but updating, detail checking and auditing continued throughout and up to the end of the project.
The lack of information on minor weed species and species with biodiversity and rarity value became very evident as the data was collated. A herbicide screen of less common/rarer weed species of biodiversity value was undertaken at ADAS Boxworth and SAC Edinburgh (Section 1.7and Appendix A). The principle herbicide active ingredients were included in the screen at half recommended and double recommended doses. The work was split between sites because of the large number of treatments involved. However, again due to liability considerations, the data from these screens was included as advisory information in the encyclopaedic section rather than imbedded within the decision process.
This lack of information on most of the more unusual and rarer species, will hinder the use of the system as a tool for species conservation and management. This would require extensive further screening work to provide a comprehensive database. Nevertheless, a reasonably substantial database has been developed for the Weed Manager encyclopaedia, which will assist users in making treatment selections to assist in species conservation.
1.6.1 Herbicide data import
The herbicide data provided by the chemical companies has to be added to the database so that it is available for use in the encyclopaedia and decision support module. These data have to be updated once or twice a year so dialog applications were written to perform the major tasks required:
• import herbicide sensitivity
• import tank mix data
• import product sequence data
• validate herbicide data
These programs are used by a person responsible for updating the system prior to release of the system. Therefore, in this section the term ‘user’ does not refer to the farmer/adviser using Weed Manager.
35 1.6.2 Herbicide sensitivity data
The data were supplied on predefined spreadsheets (Section 1.6 & Appendix I). The header of the spreadsheets contained some basic information about the product so that the data could be linked to the correct statutory product information held in the DSE pesticide database. The header also contains the HRAC groups for the product, which are used in assessing the risk of developing herbicide resistance. The rest of the data on the spreadsheet defined the sensitivity of each weed to the product at each stage.
The herbicide sensitivity importer is a dialog-based program (more detail can be found in Appendix G). The importing of the data is carried out in a worker thread. The program is designed for level 1, 2 (company data) and 4 (glass house trials) data (see section 1.6). In order to check that there are no inconsistencies in the data a herbicide data validation program has been written.
The spreadsheets could contain actual products or generic names. The generic names are converted into actual products, which have the same composition. This is necessary because the module takes the cost of products into account when calculating the efficacy of the treatment.
1.7 Herbicide screening trials
Objective
To investigate the herbicide tolerance of rare and beneficial weed species native to Britain, where no data were available.
1.8 Validation
1.8.1 Desk-based validation
As the project reached its later stages the weed agronomists in the project team spent a number of days together exploring the outputs from the models and assessing from their experience whether the results were realistic. As there were many combinations of weeds, cultural practices and herbicide treatments this took some time. As a result of this activity a number of the parameter values in both the within-season and rotational models were reviewed. The assessments also made the experts reconsider some of their perceptions, as the outputs from the system can challenge pre-conceived ideas. The experts consulted with the system designers to record and discuss the problems and make the necessary changes to the models.
1.8.2 Field validation trials Objective
To test that the growth and competition models in Weed Manager can predict yield loss in winter wheat from observations of green area index (GAI). The following questions needed to be answered:-
1. Given the GAI of each weed species at canopy closure, can the loss in wheat yield at harvest be predicted?
2. Given the GAI of each weed species shortly after seedling establishment, can the GAI at canopy closure of each component weed species be predicted?
3. Given the efficacy of a particular herbicide for a given weed species at a specified growth stage of application, can the change (reduction) in GAI due to the application of the herbicide be predicted?
4. Given a change in GAI of weed species due to a particular herbicide, can its effect on change in crop yield loss due to the weed damage be predicted by assuming that this change in GAI had occurred at time of canopy closure?
37
1.9 Weeds and herbicide encyclopaedia
The encyclopaedia had to support three criteria:
1. To make all information used in the rotational and within-season modules of Weed Manager available to the user.
2. To provide a simple interface that would be user friendly and intuitive and incorporated user data requests.
3. To ensure that the design made the encyclopaedias easy to update.
Full details of the structure of the Weed encyclopaedia can be found Appendix C.
System design
If data had to be available both to the Weed Manager modules and to the encyclopaedia then it would have to be held in a database available to both. It was decided that all encyclopaedic information should be held in a central database, which would reduce problems of updating and would provide the simplest way of satisfying the last aim. Parts of this could be accessed both by the Weed Manager system and the encyclopaedias, so that the system information was both current and available. Where information was unlikely to change, ‘static’ pages could be generated, while the database structure would determine that new static pages would have the same design as older pages. Although local databases could be held at different sites, they would be merged several times a year to create an updated permanent central database.
User needs
Users helped draw up the design brief at the first focus groups held in December 2000. They specified:
For products:
• Basic information on products
• Some information on tank mixes and adjuvants
• Less importance of off label information
• Environmental information For weeds:
• A single up-to-date source of weed biology
• Basic information on the full range of weeds
• Simple, clear text
• Good quality images and graphics
Additions:
• Weed identification system
• Some information on weed management specifically for herbicide resistance management
The interface design was refined and presented to users in an iterative process during the WMSS project.
Specifications
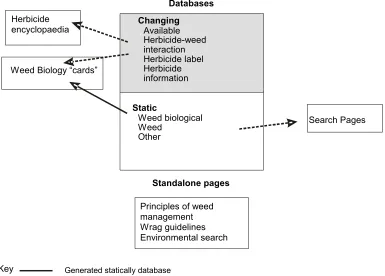
Encyclopaedic information has been designed for viewing within the ArableDS Browser. This means that the format uses HTML and JavaScript as languages to build and run the pages. The encyclopaedias run like an extended web site, with simple pages whose content is stable and pages drawn from databases. The final specification led to an encyclopaedia in several parts. The relationship of the encyclopaedias and databases are shown in Fig. 6.
Static
Weed biological Weed
Other
Principles of weed management Wrag guidelines Environmental search
Search Pages
Databases
Changing
Available Herbicide-weed interaction Herbicide label Herbicide information Herbicide
encyclopaedia
Weed Biology “cards”
Standalone pages
Key Generated statically database
Drawing dynamically from database
Fig. 6 The relationship of the encyclopaedias and databases in Weed Manager