Method Development and Validation for Simultaneous estimation of Metformin Hcl and Sitagliptin by RP-HPLC in Tablet Dosage Form
9
0
0
Full text
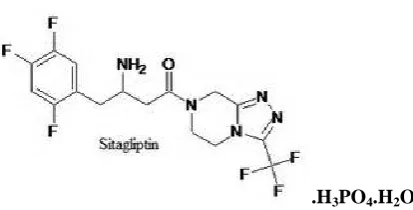
(2) 127 Sudheer Kumar Sapavat et al / Int. J. of Pharmacy and Analytical Research Vol-3 (1) 2014 [126-134]. spectrophotometric11,12 and HPLC have been reported. Simultaneous determination of MET and STG in bulk and tablet dosage form were reported by using spectrophotometric13,14 15 spectroflourometric and HPLC16,17 methods. However very few HPLC methods were reported. for the simultaneous estimation of MET and STG in tablet dosage form. The aim of present work was to develop and validate a sensitive HPLC method that can be applied for simultaneous estimation of MET and STG.. .Hcl Figure 1. Structure of Metformin hydrochloride. MATERIALS AND METHODS Instrumentation. .H3PO4.H2O Figure 2. Structure of Sitagliptin phosphate.. Standard stock solution preparation. Chromatography was performed with A HPLC system (Shimadzu) Series Software (Prominence SPINCHROM) HPLC systems provided with Hamilton Syringe, auto sampler and UV-Visible detector. All HPLC systems were equipped with a column compartment with temperature control and an on-line degasser. Data acquisition, analysis, and reporting were performed by Empower (Shimadzu) chromatography software.. Reagents and chemicals The reference samples of MET HCL and SITP were provided as gift samples from Chandra lab, Hyderabad. HPLC grade Acetonitrile, HPLC grade Methanol, HPLC grade Potassium dihydrogen orthophosphate, HPLC grade Ortho phosphoric acid, HPLC grade Ammonium acetate and all other chemicals were obtained from Merck chemical division, Mumbai. HPLC grade water obtained from Milli-Q water purification system was used throughout the study. Commercial tablets (JUNMET: 500mg Metormin + 50mg of Sitagliptin) were purchased from the local pharmacy.. PREPARATION OF SOLUTIONS Preparation of mobile phase 0.295gms potassium dihydrogen phosphate and 0.0545 gms of Di potassium hydrogen phosphate in 100ml water adjust pH 5.8 with dilute phosphoric acid : Acetonitrile 55:45 v/v. Weigh and transfer 125 mg of Metformin working standard and 12.5 mg of Sitagliptin working standard into 100 mL volumetric flask, add 60 mL of diluent and sonicate to dissolve and dilute to volume with diluent.. Working Standard preparation Transfer 10 ml of standard stock solution into 100 ml volumetric flask and dilute to volume with diluent. Sample Preparation Finely grind pre weighed 20 tablets. Transfer grinded Sample quantitatively equivalent to 125 mg of Metformin and 12.5 mg of Sitagliptin in to 100 mL volumetric flask add 60 mL of diluent, sonicate to dissolve for 10 minutes and dilute to volume with diluent. Further filter the solution through 0.45µ filter paper. Dilute 10 ml of filtrate to 100 ml with mobile phase. ANALYTICAL METHOD DEVELOPMENT Initially method development work as started by taking UV-Visible spectra from 200-400nm of Metformin Hcl and sitagliptin standard solutions .By observing the overlapping spectra of standard solutions λ max 244nm was taken for trials to develop HPLC method. The spectrum was given in Fig-3. www.ijpar.com.
(3) 128 Sudheer Kumar Sapavat et al / Int. J. of Pharmacy and Analytical Research Vol-3(1) 2014 [126-134]. Fig.No:3 Isobestic point of Metformin Hcl and Sitagliptin Table:1 OPTIMISED CHROMATOGRAPHIC CONDITIONS OPTIMISED CHROMATOGRAPHIC CONDITIONS Mode of separation Mobile phase. Isocratic elution PH 5.8 KH2PO4+K2HPO4buffer: ACN-(55:45). Column Flow rate Detector wavelength Injection volume Oven temperature Run time. ZODIAC C18, 250X 4.6 mm, 5µ, 1.0 ml/min 244 nm 20l 30°C 6min. Retention Time. Metformin. 2.1. Sitagliptin. 4.9. FIG :4 Optimised chromatogram of Metformin and Sitagliptin METHOD VALIDATION PARAMETERS The method was validated in accordance with ICH guidelines17. The parameters assessed were linearity, accuracy, limit of detection (LOD), limit of quantification (LOQ), precision, reproducibility and robustness.. Linearity Five different concentrations of the mixed standard drugs of MET and STG were prepared for linearity studies and injected into system (n=5). The response was measured as peak areas. Each. www.ijpar.com.
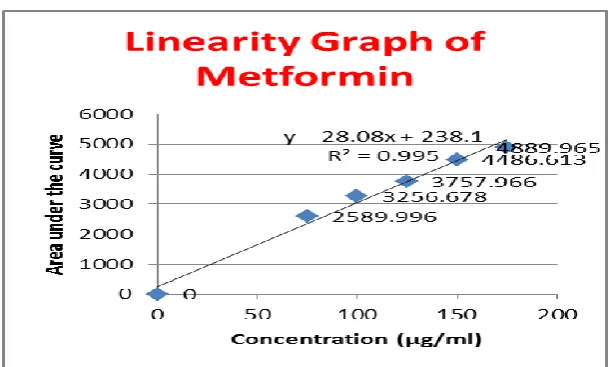
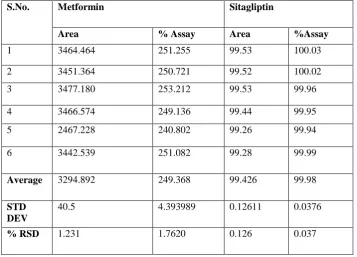
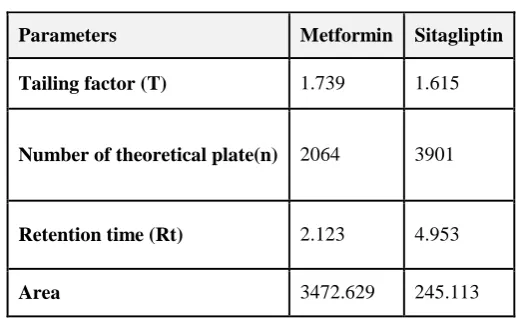
(4) 129 Sudheer Kumar Sapavat et al / Int. J. of Pharmacy and Analytical Research Vol-3 (1) 2014 [126-134]. concentration was prepared from individual stock solution. The peak areas were plotted against concentrations to obtain the calibration curve.. μg/ml for MET and STG respectively. Linear regression data for the calibration curves are given in Table 2.. Accuracy The accuracy was carried out by adding known amounts of each analyte corresponding to three concentration levels (105,130, and 155%) of the labeled claim to the excipients. At each level, three determinations were performed and the accuracy results were expressed as percent analyte recovered by the proposed method.. Accuracy The % mean recovery obtained for MET and STG was 99.70 % and 99.40% respectively. The %RSD is less than 2, results were given in Table 3.. Precision The precision of analytical method is the degree of agreement among the individual test results, when the method is applied repeatedly to multiple sampling of homologous samples. The precision of the method was checked by repeatability of injection, repeatability (intra-day), intermediate precision (inter-day) and reproducibility. Injection repeatability was studied by calculating the percentage relative standard deviation (%RSD) for six determinations of peak areas of MET and STG. Detection limit and quantification limit The limit of detection (LOD) and limit of quantification (LOQ) were calculated according to Equation 1 & 2, respectively. LOD = 3.3 X SD/S……………….. (1) LOQ = 10 X SD/S……………….. (2) Where SD is the standard deviation of response (peak area) and S is the average of the slope of the calibration curve. Robustness Robustness was assessed by introducing small changes in the mobile phase composition and flow rate measuring the effects of result. Specificity Specificity is the ability of the analytical method to measure the analyte response in the presence of interferences including degradation products and related substances.. RESULTS Method validation Linearity The calibration curve obtained by plotting peak area against concentration showed linearity in the concentration range of 75-175 μg/ml and 7.5-17.5. Precision Results for repeatability expressed as %RSD, results were given in Table 3. The low values of %RSD indicate that the method is precise. Reproducibility was checked by analyzing the samples by another analyst using same instrument and same laboratory. There was no significant difference between the %RSD values, which indicates that the proposed method was reproducible, results were showed in Table 4. Detection limit and quantification limit LOD for MET and STG was 0.282 and 0.036 μg/ml respectively, while LOQ was 0.05 and 0.111 μg/ml respectively. Table no. 5. Robustness There was no significant change in the peak areas and retention times of MET and STG when the composition of mobile phase ±1 ml and flow rate was varied by ±0.2 ml. The results are showed in Table 6. Specificity No interference from any of the excipients was found at retention times of the examined drugs. In addition, the chromatogram of each drug in the sample solution was found identical to the chromatogram received by the standard solution at the wavelengths applied. These results demonstrate the absence of interference from other materials in the pharmaceutical formulations and therefore confirm the specificity of the proposed method. Table no.7. System suitability The acceptance criteria are % RSD of peak areas and retention time less than 2%, theoretical plates numbers (N) at least 2000 per each peak and tailing factors less than 2 for MET and STG and the results are shown in the Table 8. DISCUSSION. www.ijpar.com.
(5) 130 Sudheer Kumar Sapavat et al / Int. J. of Pharmacy and Analytical Research Vol-3(1) 2014 [126-134]. In order to achieve simultaneous estimation of the two components, initial trials were performed with the objective of selecting adequate and optimum chromatographic conditions. Parameters, such as ideal mobile phase and their proportions, detection wave length and concentrations of the standard solutions were carefully studied. Several solvents were tested in varying proportions. Finally, a mixture of Potassium Phosphate Buffer: ACN 55:45v/v was selected as the optimum mobile phase. The optimized chromatographic conditions were selected based on sensitivity, retention times and peak shape. The method was validated in terms of linearity, accuracy, precision, LOD, LOQ, robustness and specificity as per ICH guidelines. The accuracy data shows that the method is accurate within desired range. The LOD and LOQ values were low which indicates that the method is sensitive. The method was robust as minor changes. in the chromatographic parameters did not bring about any significant changes in peak area and retention times of MET and STG. CONCLUSION The developed method for the simultaneous determination of MET and STG has advantage of sensitivity, accuracy, precision and low cost. The non-interference of tablet excipients make the method suitable for the simultaneous estimation of these drugs in tablets and hence can be used for routine quality control of MET and STG in pharmaceutical dosage form. ACKNOWLEDGEMENTS The author wishes to thanks Mohan Goud.V, Dr.J.V.C.Sharma Mr.Pragati Ranjan Satpathy for providing pure metformin hydrochloride and sitagliptin phosphate as gift samples.. Table 2: Linear regression data for the calibration curves Metformin. Sitagliptin. Concentration (µg/ml). Area. Concentration (µg/ml). Area. 75. 2589.996. 7.5. 188.517. 100. 3256.678. 10.0. 226.106. 125. 3757.966. 12.5. 249.907. 150. 4486.613. 15.0. 297.234. 175. 4889.965. 17.5. 334.666. Fig no.5 Linearity graph of Meformin. www.ijpar.com.
(6) 131 Sudheer Kumar Sapavat et al / Int. J. of Pharmacy and Analytical Research Vol-3 (1) 2014 [126-134]. Fig no.6 Linearity graph of Sitagliptin. Table 3: Accuracy data for proposed method Injection sample Metformin. Sitagliptin. Spike Level 105%-1. Average Area 3478.217. Amount add 104.59. Amount recovered 104.12. %Recovered. 130%-1. 3472.629. 129.54. 129.12. 99.675. 155%-1. 3464.888. 154.45. 154.31. 99.90. 10.5%-1. 234.256. 10.49. 10.410. 99.23. 13.5%-1. 245.113. 13.45. 13.41. 99.702. 15.5%-3. 300.586. 15.41. 15.30. 99.28. 99.55. Table 4: Precision of the proposed HPLC method S.No.. Metformin. Sitagliptin. Area. % Assay. Area. %Assay. 1. 3464.464. 251.255. 99.53. 100.03. 2. 3451.364. 250.721. 99.52. 100.02. 3. 3477.180. 253.212. 99.53. 99.96. 4. 3466.574. 249.136. 99.44. 99.95. 5. 2467.228. 240.802. 99.26. 99.94. 6. 3442.539. 251.082. 99.28. 99.99. Average. 3294.892. 249.368. 99.426. 99.98. STD DEV. 40.5. 4.393989. 0.12611. 0.0376. % RSD. 1.231. 1.7620. 0.126. 0.037. www.ijpar.com. % of mean recovery 99.70. 99.40.
(7) 132 Sudheer Kumar Sapavat et al / Int. J. of Pharmacy and Analytical Research Vol-3(1) 2014 [126-134]. Table No.5 Detection limit and quantification limit results DRUG NAME Metformin. LOD=3.3(SD/S). 0.282. LOQ = 10(SD/S). 0.05. Sitagliptin. 0.036. 0.111. Table 6: Results of robustness for proposed method. Inj.Sample. Metformin. Flow Rate(ml/min). USP Count. Plate. 0.8. 2222. 1.821. 1.2. 4431. 1.783. 0.8. 1938. 1.789. 1.2. 4076. 1.697. Wavelength (nm). USP Tailing. 244 248 244. Sitagliptin. 248. USP Count. Plate. USP Tailing. 2045. 1.783. 4569. 1.600. 2147. 1.739. 4377. 1.474. Table no.7: Specificity results Sample ID. Retention Time. Blank. No peaks observed at retention time of principle peaks.. Placebo. No peaks observed at retention time of principle peaks.. Interference at METFORMIN SITAGLIPTIN Nil Nil. Nil. Nil. Table 8: System suitability parameters Parameters. Metformin. Sitagliptin. Tailing factor (T). 1.739. 1.615. Number of theoretical plate(n). 2064. 3901. Retention time (Rt). 2.123. 4.953. Area. 3472.629. 245.113. www.ijpar.com.
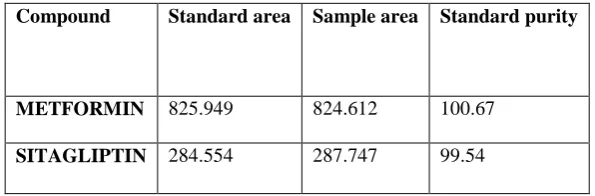
(8) 133 Sudheer Kumar Sapavat et al / Int. J. of Pharmacy and Analytical Research Vol-3 (1) 2014 [126-134]. Table no.9 ASSAY RESULT Compound. Standard area. Sample area. Standard purity. METFORMIN. 825.949. 824.612. 100.67. SITAGLIPTIN. 284.554. 287.747. 99.54. REFERENCES [1] Zhou G, Myers R, Li Y, Chen Y, Shen X, Fenky-Melody J, Wu M, Ventre J, Doebber T, Fujii N, Musi N,Hirshman MF, Goodyear LJ and Moller DE. Role of AMP-activated protein kinase in mechanism of metformin action. The Journal of Clinical Investigation. 2001;108(8):1167-1174. [2] Badyal DK and Kaur J. Sitagliptin: a new class of oral drug for type 2 diabetes. JK Science. 2008;10(2):93- 98. [3] Chu XY, Bleasby K, Yabut J, Cai X, Chan GH, Hafey MJ, Xu S, Bergman AJ, Braun MP, Dean DC and Evers R. Transport of the dipeptidyl peptidase-4 inhibitor sitagliptin by human organic anion transporter 3, organic anion transporting polypeptide 4C1, and multidrug resistance P-glycoprotein . The Journal of Pharmacology and Experimental Therapeutics. 2007;321(2):673-683. [4] Herman GA, Bergman A, Yi B and Kipnes M. Tolerability and pharmacokinetics of metformin and the dipeptidyl peptidase-4 inhibitor sitagliptin when co-administered in patients with type 2 diabetes. Current Medical Research and Opinion. 2006;22(10): 1939-1947. [5] Goswami L, Mukhopadyay S and Durgapal S. Simultaneous estimation of metformin and pioglitazone by ultraviolet spectrophotometry. Indian Journal of Pharmaceutical Sciences. 2010;72(4):508-510. [6] Mubeen G, Noor K and Vimala MN. Spectrophotometric method for estimation of metformin hydrochloride. International Journal of Chem Tech Research. 2010;2(2):1186-1187. [7] Sujana K, Swathi Rani G, Bhanu Prasad M and Saheethi Reddy M. Simultaneous estimation of pioglitazone hydrochloride and metformin hydrochloride using UV spectroscopic method. Journal of Biomedical Science and Research. 2010; 2(2):110-115. [8] Bhavesh D, Chetan G, Bhat KM and Shivprakash. Estimation of pharmacokinetics of metformin in human volunteers. Indian Journal of Pharmaceutical Education and Research. 2007;41(2):135-139. [9] Sahoo PK, Sharma R and Chaturvedi SC. Simultaneous estimation of metformin hydrochloride and pioglitazone hydrochloride by RPHPLC method from combined tablet dosage form. Indian Journal of Pharmaceutical Sciences. 2008;70(3):383-386. [10] Shweta H and Sunil D. Estimation of metformin in bulk drug and in formulation by HPTLC. Journal of Nanomedicine and Nanotechnology. 2010;1(1):1-3. [11] Bala Sekaran C and Prameela Rani A. Development and validation of spectrophotometric method for the determination of DPP4 Inhibitor sitagliptin, in its pharmaceutical dosage forms. International Journal of Pharmacy and Pharmaceutical Sciences. 2010;2(4):138-142. [12] Parag P, Imran Md, Vinod B and Yogesh A. Development and validation of stability indicating UV Spectrophotometric method for the estimation of sitagliptin phosphate in bulk and tablet dosage form. Journal of Pharmacy Research. 2011;4(3):871-873. [13] Anil D, Rizwanbasha K, Jayasankar K, Venkat M, Samanta MK. Bioanalytical method development and validation of sitagliptin phosphate by RP-HPLC and its application to pharmacokinetic study. International Journal of Pharmacy and Pharmaceutical Sciences. 2012; 4(2): 691-694. [14] Khan G, Dinesh Sahu Agrawal YP, Neetu S, Avnish J and Gupta AK. Simultaneous estimation of metformin and sitagliptin in tablet dosage form. Asian Journal of Biochemical Pharmaceutical Research. 2011;1(2):352-358. [15] Ramzia El-Bagary I, Ehab Elkady F and Bassam Ayoub M. Spectroflourometric andspectrophotometric methods for the determination of sitagliptin in binary mixture with metformin. www.ijpar.com.
(9) 134 Sudheer Kumar Sapavat et al / Int. J. of Pharmacy and Analytical Research Vol-3(1) 2014 [126-134]. and ternary mixture with metformin and sitagliptin alkaline degradation product. Internatonal Journal of Biomedical Sciences. 2011;7(1):62- 69. [16] Shyamala M, Mohideen S, Satyanarayana T, Narasimha Raju Ch, Suresh Kumar P and Swetha K.Validated RP-HPLC for simultaneous estimation of sitagliptin phosphate and metformin hydrochloride in tablet dosage form. American Jounal of Pharm Tech Research. 2011;1(2):93-101. [17] International Conference on Harmonization (ICH) of Technical Requirements for Registration of Pharmaceutical for Human Use: Harmonized Triplicate guideline on Validation of Analytical procedures:Methodology, Recommended for Adoption at Step 4 of the ICH Process on November 1996 by The ICH Steering Committee, IFPMA, Switzerland. *******************************. www.ijpar.com.
(10)
Figure

+3
Related documents
Due to the initial lack of resistance mechanisms that could explain the resistance developed during therapy, we submitted the initial clinical isolates to passaging experiments
As the region of high speed wind is limited and also the area required for installation of conventional windmill is high, bladeless windmill based on vortex induced
The purposes of this study were three-fold: (1) to evaluate the default performance of existing state-of-the-art deep learning based dependency parsers on clinical text; (2) to
Moreover, the fitting of the radiological guide model, obtained by processing DICOM images on the gypsum cast has been verified (Figure 9A) ( mean value -0.004 mm, SD 0.082 mm)..
Recent studies have shown conflicting results regard- ing the decision to use reference intervals (RI) of TSH suitable for the elderly or not [7,8]. On studies with re- view of
In fact, all five strains genotyped as SIT149:A were drug resistant according to the line probe assay (Additional file 1 : Table S1), and four of these five strains were
Participants of the present study had to be generally healthy (absence of coronary heart disease, hypertension, diabetes; dyslipide- mia), overweight or obese (defined by a body
The magnesium nitrate and magnesium phosphate which impregnated coir pith showed a gradual increase at the level of the cation, magnesium in all concentrations of
