Vol. 15, No. 2, 2017, 341-350
ISSN: 2279-087X (P), 2279-0888(online) Published on 11 December 2017
www.researchmathsci.org
DOI: http://dx.doi.org/10.22457/apam.v15n2a20
341
Annals of
Benchmarking and Data Envelopment Analysis: An
Approach to Rank the Best Performing Engineering
Colleges Functioning in Tamil Nadu
M.Kameswari1, P.Mariappan2, M.AntonyRaj2 and Jennifer3
1
Department of Mathematics, Thiagarajar College of Engineering, Madurai 2
PG Department of Actuarial Science, Bishop Heber College, Trichy 3
Research and PG Department of Mathematics, Bishop Heber College Trichy, Tamilnadu, India
Received 20 November 2017; accepted 10 December 2017
Abstract. The aim of the research work is to investigate and examine performance efficiency of Engineering Institutions functioning in Tamil Nadu individually and to identify the best performing Engineering Institutions.
For this study, researchers collected data on the Engineering Institutions for the financial years 2013-2016 from the official websites of individual Institution, then considering two input and four output variables. The Data Envelopment Analysis technique (CRS & VRS) and Benchmarking Analysis have been employed.
Our Study reveals that as per the analysis of
CRS: IIT Madras, NIT Trichy, PSG, Sri Siva Subramaniya and Thanthai Periyar
VRS:IIT Madras, NIT Trichy, SRM, PSG, R.M.K, Sri Siva Subramaniya and Thanthai
Periyar
Thanthai Periyar
Altogether Thanthai Periyar functioning effectively and efficiently and the remaining Engineering Institutions are not functioning up to that expected level.
Keywords: Data envelopment analysis, decision making units, performance, efficiency, benchmarking analysis.
AMS Mathematics Subject Classification (2010): 90B05
1.Introduction
It is one of the main activities of any firm to monitor its efficiency. In the current scenario, there are a number of methods based either on the traditional approach to evaluate the efficiency of a system. Efficiency measurement methods can be divided into three main categories: Ratio Indicators, Parametric and Non-Parametric methods. In selecting indicators to measure efficiency one can focus primarily on a firm’s inputs and outputs.
342
sources of their inefficiency is a precondition to effectively improve the performance of any such unit in a competitive environment.
Educational Institutions can be considered as production units too. In general, they are homogeneous units performing similar activities. All inputs and outputs have an impact on the efficient operation of such units, even though some are relatively considered to be more important or less important to each other. Based on the economical term, efficiency refers to the ratio of outputs to inputs. Input refers to the scarce resource and output in terms of goods and services offered to the consumers.
The large number of EngineeringInstitutionsis located in Tamilnadu, the quick Technological Change and the increased competition has added more pressure to improve performance. Instead of studying partial services of Educational Institutions, with the available Financial Management Tool like Ratio Analysis. In this context, the author has introduced the concept of the DEA model in this research paper. This system has the benefit of developing a data-driven technological frontier that necessitates no specification of any scrupulous functional shape or error structure. This study fills the gap in the literature by leaving from the traditional method of evaluating the efficiency of the Educational Institutions.
DEA was first introduced by Charnes et al., (1978) as a Mathematical Programming Model with the help of the theoretical framework given by Farrell, (1957), for computing the relative efficiencies of multiple Decision Making Units (DMUs), and it falls under the special category of Fractional Programming. DEA is a special technique which offers a comparative ratio for each unit in terms of output and input. The ratio is stated as efficiency scores for each unit. The measure of performance lies in the range 0 to 1. If the performance measure is 1 then the organization is considered to be highly efficient and if the measure is tending towards 0, the efficiency is otherwise. One of the significant roles of DEA is that the efficiency scores indicate the gap for potential improvements and developments for inefficient DMUs.
In the Educational Institutions, the DEA model is preferable to an econometric approach of efficiency measurement because it has a number of advantages. There are:
It can simultaneously analyze several inputs and outputs, which is an alternative characteristic, because production in the Educational Institutions often involves multiple inputs and outputs.
It does not require any assumptions about the functional form of technology, and It calculates a maximal performance measure for each production unit relative to
all other production units in the observed population with the sole condition that each production unit lies on or below the external.
2. Review of literature
All the relevant review of literature collected by the researcher based on the proposed title is listed below year wise.
Performing Engineering Colleges Functioning in Tamil Nadu
343
(Chuen Tse Kuah, Kuan Yew Wong, 2011) has discussed the Efficiency assessment of universities.The researcher analyzed DEA model for jointly evaluating the relative teaching and research efficiencies of universities. The model was tested using a hypothetical example and implications in university performance measurement were described.
(Wei-Hsin Kong and Tsu-Tan Fu,2011)evaluated the performance of business colleges in Taiwan using data envelopment analysis.The researcher constructed a student-based performance evaluation model for business schools in Taiwan.The research study brings that the assurance region data envelopment analysis is better than DEA in measuring the performance of the business colleges in Taiwan.
(Pranesh R.V and John Rajan A. 2013) evaluated the performance measures of Indian Institute of Technology, Chennai and Anna University, Chennai. It was also formulated taking eight Private Deemed Universities relative performance efficiency in relation to input and output variable.
(Samar Al-Bagoury, 2013) has adopted the two stage efficiency analysis and used it to compare the efficiency of African higher education systems in fifteen countries using DEA. And then researcher used the tobit regression to determine the most environmental factors that affecting the efficiency of this institute.
(Michał Pietrzak, Piotr Pietrzak and Joanna Baran, 2016) has studied the Efficiency assessment of public higher education using DEA. Also defines benchmarks for inefficient Higher education institutions and quantify the gaps to be fulfilled by them in order to become efficient.
This paper differs entirely from all other previous works by investigating and examining the current performance of the Engineering Institutions of Tamil Nadu individually, in terms of their efficiency for the period [2013 – 2016] using the Data Envelopment Analysis and especially Benchmarking analysis is used to identify the best Benchmarking College to make the inefficient college into an efficient college. Based on the study, it also classifies the Engineering Institutions into two categories as efficient and inefficient. The remedial measures are discussed in order to improve the efficiency of the Educational Institutions.
3. Research methodology 3.1. Data collection
For this study, the required data of selected Thirty Engineering Institutions based on the availability of reputed data have been taken from the Official Website for the years 2013– 2016.
3.2. Selection of input and output variables
344
Sl. No. Input Variables Output Variables
1 Total no. of students Number of students graduating 2 Total no. of faculties No. of Students Placed
3 No. of students selected for Higher studies
4 Financial Resource
3.3. Problem definition
3.3.1. Fractional DEA program
Let there be N DMUs whose efficiencies have to be compared. Let us take one of the DMUs. Say the DMU. And maximize its efficiency, according to the formula given above. Here the DMU is the reference DMU.
The mathematical problem is,
=
∑
∑
= = I i im im J j jm jmx
u
y
v
1 1Subject to the Constraints
0 ≤
∑
∑
= = I i in im J j jn jm x u y v 1 1≤1; n= 1,2,K,J
, ≥ 0; = 1,2, , ; = 1,2, where,
is the efficiency of the DMU, is the output of the DMU, is the weight of that output, is the input of the DMU, is the weight of that input, and
and are output and input, respectively, of the nth DMU, n = 1,2,…,N.
Note that here n includes m.
3.3.2. Constant returns to scale model
Unit works under constant returns to scale provided an increase in inputs results in a proportionate growth in the output levels. If the input values for a unit are all doubled, then the unit must make twice as much output. In a single input and output case, the efficiency frontier reduces to a straight line.
General form of CCR model:
The general form Output Maximization DEA [CCR] model can be exemplified in the form of Fractional Programming Model as follows:
Performing Engineering Colleges Functioning in Tamil Nadu
345
= ∑∑ !"
# !"
Subject to the constraints
∑!"
∑ #!" ≤ 1; % = 1,2, … , '
, , , ≥ 0 ()* ++ = 1,2, . . -; = 1,2, . . , % = 1,2, … '
Solving this Fractional Programming Problem directly is so tedious; so the Fractional Programming model is changed into regular Linear Programming model as described below:
= .
!"
Subject to the constraints
.
#
!"
= 1
.
!"
− . ≤ 0 #
!"
; % = 1,2, … '
, , , ≥ 0 ()* ++ = 1,2, . . -; = 1,2, . . , % = 1,2, … '
The general form of Input Minimization DEA [CCR] Linear Programming model can be represented as follows:
' = .
#
!"
Subject to the constraints
.
!"
= 1; . !"
− . #
!"
≤ 0; % = 1,2, … , '
, , , ≥ 0 ()* ++ = 1,2, . . -; = 1,2, . . , % = 1,2, … '
3.3.3. Variable returns to scale model
If it is suspected that an increase in inputs does not result in a proportional change in the outputs, a model which allows Variable Returns to Scale (VRS) such as the BCC model should be viewed.
General form of BCC model:
The DEA envelopment program for considering variables return to scale is as follows: ' 0
Subject to the Constraints 1 ≥ ; 1 ≤ 2 . 1
3
!"
= 1;
346
4. Empirical results
4.1. Constant return to scale [CCR model]
Table 4.1 indicates that as per the CCR Model among the 30 Engineering institutions taken for the study five Engineering institutions attained the maximum efficiency score as 1.
Table 4.1: Constant return to scale–efficiency table
Name of the College 2013-14 2014-15 2015-16 Mean
IIT MADRAS 1 1 1 1
NIT Trichy 1 1 1 1
SRM 0.765 1 1 0.921667
PSG 1 1 1 1
COIMBATORE INSTITUTE 0.819 0.949 0.941 0.903
ALAGAPPA CHETTIAR 0.867 0.879 0.81 0.852
MEPCO SCHIENK 0.88 0.874 1 0.918
SONA 1 0.865 1 0.955
SRI KRISHNA 0.514 0.737 1 0.750333
KONGU 0.803 0.882 0.898 0.861
KUMARAGURU 0.81 0.91 0.987 0.902333
K.S.RANGASAMY 0.905 0.843 0.886 0.878
SRI RAMAKRISHNA 0.705 0.742 0.924 0.790333
VALLIAMMAL 0.501 0.67 0.73 0.633667
KONGUNADU 0.498 0.611 0.795 0.634667
R.M.K 0.953 1 1 0.984333
KAMARAJ 0.732 0.766 0.91 0.802667
VELALAR 0.67 0.697 0.835 0.734
KARPAGAM 1 0.963 1 0.987667
KCG 0.568 0.625 0.814 0.669
ST.PETERS 0.556 1 1 0.852
NATIONAL 0.911 0.999 0.917 0.942333
SRI SAI RAM 0.634 0.752 0.972 0.786
KNOWLEDGE INSTITUTE 0.593 0.64 0.835 0.689333
C.ABDUL HAKKEM 0.687 0.836 0.76 0.761
SRI SIVA SUBRAMANIYA 1 1 1 1
K S R 0.81 0.84 0.911 0.853667
PSNA 0.606 0.68 0.809 0.698333
ST.XAVIER'S CATHOLIC 1 0.998 0.953 0.983667
THANTHAI PERIYAR 1 1 1 1
Mean 0.7929 0.8586 0.9229
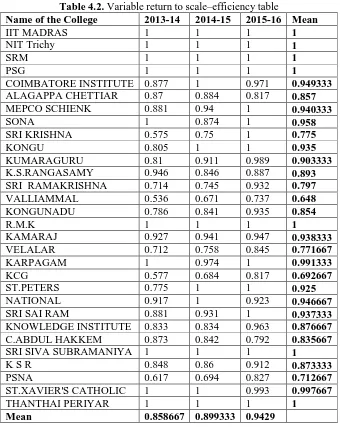
4.2. Variable return to scale [BCC model]
Performing Engineering Colleges Functioning in Tamil Nadu
347
Table 4.2. Variable return to scale–efficiency table
Name of the College 2013-14 2014-15 2015-16 Mean
IIT MADRAS 1 1 1 1
NIT Trichy 1 1 1 1
SRM 1 1 1 1
PSG 1 1 1 1
COIMBATORE INSTITUTE 0.877 1 0.971 0.949333
ALAGAPPA CHETTIAR 0.87 0.884 0.817 0.857
MEPCO SCHIENK 0.881 0.94 1 0.940333
SONA 1 0.874 1 0.958
SRI KRISHNA 0.575 0.75 1 0.775
KONGU 0.805 1 1 0.935
KUMARAGURU 0.81 0.911 0.989 0.903333
K.S.RANGASAMY 0.946 0.846 0.887 0.893
SRI RAMAKRISHNA 0.714 0.745 0.932 0.797
VALLIAMMAL 0.536 0.671 0.737 0.648
KONGUNADU 0.786 0.841 0.935 0.854
R.M.K 1 1 1 1
KAMARAJ 0.927 0.941 0.947 0.938333
VELALAR 0.712 0.758 0.845 0.771667
KARPAGAM 1 0.974 1 0.991333
KCG 0.577 0.684 0.817 0.692667
ST.PETERS 0.775 1 1 0.925
NATIONAL 0.917 1 0.923 0.946667
SRI SAI RAM 0.881 0.931 1 0.937333
KNOWLEDGE INSTITUTE 0.833 0.834 0.963 0.876667
C.ABDUL HAKKEM 0.873 0.842 0.792 0.835667
SRI SIVA SUBRAMANIYA 1 1 1 1
K S R 0.848 0.86 0.912 0.873333
PSNA 0.617 0.694 0.827 0.712667
ST.XAVIER'S CATHOLIC 1 1 0.993 0.997667
THANTHAI PERIYAR 1 1 1 1
Mean 0.858667 0.899333 0.9429
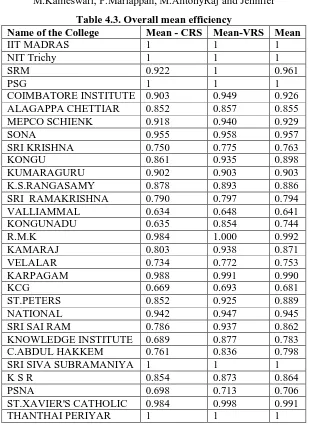
4.3. Overall mean efficiency
348
Table 4.3. Overall mean efficiency
Name of the College Mean - CRS Mean-VRS Mean
IIT MADRAS 1 1 1
NIT Trichy 1 1 1
SRM 0.922 1 0.961
PSG 1 1 1
COIMBATORE INSTITUTE 0.903 0.949 0.926 ALAGAPPA CHETTIAR 0.852 0.857 0.855 MEPCO SCHIENK 0.918 0.940 0.929
SONA 0.955 0.958 0.957
SRI KRISHNA 0.750 0.775 0.763
KONGU 0.861 0.935 0.898
KUMARAGURU 0.902 0.903 0.903
K.S.RANGASAMY 0.878 0.893 0.886 SRI RAMAKRISHNA 0.790 0.797 0.794
VALLIAMMAL 0.634 0.648 0.641
KONGUNADU 0.635 0.854 0.744
R.M.K 0.984 1.000 0.992
KAMARAJ 0.803 0.938 0.871
VELALAR 0.734 0.772 0.753
KARPAGAM 0.988 0.991 0.990
KCG 0.669 0.693 0.681
ST.PETERS 0.852 0.925 0.889
NATIONAL 0.942 0.947 0.945
SRI SAI RAM 0.786 0.937 0.862
KNOWLEDGE INSTITUTE 0.689 0.877 0.783 C.ABDUL HAKKEM 0.761 0.836 0.798
SRI SIVA SUBRAMANIYA 1 1 1
K S R 0.854 0.873 0.864
PSNA 0.698 0.713 0.706
ST.XAVIER'S CATHOLIC 0.984 0.998 0.991
THANTHAI PERIYAR 1 1 1
4.4. Benchmarking analysis
This analysis is used to identify the Best Benchmarking Engineering Institutions among all the efficient Engineering Institutions. This helps to select the best among the best. According to this report Thanthai Periyar College being the best.
Table 4.4. Bench marking values
Name of the College 2013-14 2014-15 2015-16 Mean
IIT MADRAS 4 1 1 2.00
NIT Trichy 12 13 3 9.33
SRM 0 0 0 0.00
PSG 2 2 5 3.00
Performing Engineering Colleges Functioning in Tamil Nadu
349
ALAGAPPA CHETTIAR 0 0 0 0.00
MEPCO SCHIENK 0 0 1 0.33
SONA 8 0 8 5.33
SRI KRISHNA 0 0 1 0.33
KONGU 0 0 0 0.00
KUMARAGURU 0 0 0 0.00
K.S.RANGASAMY 0 0 0 0.00
SRI RAMAKRISHNA 0 0 0 0.00
VALLIAMMAL 0 0 0 0.00
KONGUNADU 0 0 0 0.00
R.M.K 1 9 3 4.33
KAMARAJ 0 0 0 0.00
VELALAR 0 0 0 0.00
KARPAGAM 10 0 8 6.00
KCG 0 0 0 0.00
ST.PETERS 0 0 1 0.33
NATIONAL 0 4 0 1.33
SRI SAI RAM 0 0 4 1.33
KNOWLEDGE INSTITUTE 0 0 0 0.00
C.ABDUL HAKKEM 0 0 0 0.00
SRI SIVA SUBRAMANIYA 3 10 8 7.00
K S R 0 0 0 0.00
PSNA 0 0 0 0.00
ST.XAVIER'S CATHOLIC 8 1 0 3.00
THANTHAI PERIYAR 18 17 14 16.33
5. Conclusion
The Efficiency Analysis based on Constant Returns to Scale reveals that five Engineering Institutions (IIT MADRAS, NIT Trichy, PSG, SRI SIVA SUBRAMANIYA, and THANTHAI PERIYAR) stand first and the analysis based on Variable Return to Scale Communicates that seven Engineering Institutions (IIT MADRAS, NIT Trichy, SRM, PSG, R.M.K, SRI SIVA SUBRAMANIYA and THANTHAI PERIYAR) takes the first place. Comparing both the analysis one can conclude that IIT MADRAS, NIT Trichy, PSG, SRI SIVA SUBRAMANIYA &THANTHAI PERIYAR is doing exceedingly well.
Among the five top performing Institutions, Thanthai Periyar is the best one according to bench mark analysis. The other remaining 25 Institutions should identify their weaker areas and should try to improve their performance in near future.
REFERENCES
350
2. K.Al Khathlan and S.A.Malik, Are saudi banks efficient? evidence using data envelopment analysis (DEA), International Journal of Economics and Finance, 2(2) (2010) 53-58.
3. A.Charnes, W.W.Cooper and E.Rhodes, Measuring the efficiency of decision making units, European Journal of Operation Research, 2 (1978) 429-444.
4. C.T.Kuah, K.Y.Wong, Efficiency assessment of universities through data envelopment analysis, Procedia of Computer Science, 3 (2011) 499-506.
5. M.J.Farrel, The measurement of Productivity efficiency, Journal of Royal Statistical Society (A), 120 (1957) 253-281.
6. P.Mariappan, Operations Research Methods and Application, New Century Publication, (2010).
7. J.Maudos, J.M.Pastor, F.Perez and J.Quesada, Cost and profit efficiency in European banks, Journal of International Financial Markets, Institutions and Money, 12 (2002) 33-58.
8. Michał Pietrzak, Piotr Pietrzak and Joanna Baran, Efficiency assessment of public higher education with the application of Data Envelopment Analysis: The evidence from Poland, Online Journal of Applied Knowledge Management A Publication of the International Institute for Applied Knowledge Management, 4(2) (2016) 59-73. 9. R.Ramanathan, An Introduction to Data Envelopment Analysis: A Tool for
Performance Measurement, Sage Publications, New Delhi 2003
10. Wei-Hsin Kong and Tsu-Tan Fu, Assessing the performance of business colleges in Taiwan using data envelopment analysis and student based value-added performance indicators, The International Journal of Management Science (Omega), 40 (2012) 541-549.
11. Samar Al-Bagoury, Using DEA to evaluate efficiency of African higher education, Educational Research, 4(11) (2013) 742-747.