Volume 04 Issue 04 April- 2019, Page No.-570-577
DOI:10.31142/etj/v4i4.02, I.F. - 4.449
© 2019, ETJ
570
Nahom Ghebremeskel
1, ETJ Volume 04 Issue 04 April 2019
ECG Arrhythmia Classification Using a Convolution Neural Network
Nahom Ghebremeskel
1, Vahid Emamian
21Department of Electrical Engineering, St. Mary’s University, 1 Camino Santa Maria, San Antonio, TX 78228,USA 2School of Science, Engineering and Technology, St. Mary’s University, San Antonio, TX 78228, USA
Abstract:
In this research paper, we propose a method for electrocardiogram (ECG) arrhythmia classification using a convolutional neural network (CNN). CNN has established to have a great performance in ECG classification and pattern recognition. The proposed CNN architecture in here classifies the electrocardiogram (ECG) arrhythmia into four distinct categories: normal sinus rhythm, atrial fibrillation, other rhythms, or too noisy to be classified. The ECG signal is converted into a two-dimensional spectrogram image as an input data for the CNN classifier. The proposed architecture includes various deep learning techniques such as batch normalization, data augmentation, and averaging-based feature aggregation across time. We use resampling and dropout bursts techniques for data augmentation. Our experimental results have successfully proven that the proposed CNN classifier with the augmented ECG data can achieve a classification accuracy of over 86.7%.Keywords:
Electrocardiogram (ECG), Arrhythmia, Convolution Neural Network (CNN), Data Augmentation, Deep LearningI. INTRODUCTION
According to the World Health Organization (WHO), cardiovascular diseases (CVDs) are the number one cause of death today. Over 17.7 million people died from CVDs, which is about 31% of all deaths, and over 75% of these deaths occur in low- and middle-income countries. [1] Arrhythmia is a typical type of CVD that leads to any irregular change from normal heart rhythms. There are several types of arrhythmia including atrial fibrillation, premature contraction, ventricular fibrillation, and tachycardia. Although a single arrhythmia heartbeat may not have a significant impact on life, continuous arrhythmia beats can result in deadly circumstances. For example, the beats of prolonged premature ventricular contractions (PVCs) seldom turn into ventricular tachycardia (VT) or ventricular fibrillation (VF) beats, which can immediately lead to heart failure. Thus, it is important to regularly monitor heart rhythms to control and prevent CVDs. An electrocardiogram (ECG) is a non-harmful medical tool that shows the rhythm and condition of the heart. Therefore, the automatic finding of irregular heart rhythms from ECG signals is an important duty in the field of cardiology. Different approaches have been recently presented for automatic identification of ECG arrhythmia based on signal feature extraction, such as support vector machines (SVM) [2,3], discrete wavelet transformation (DWT) [4,5], feed forward neural networks (FFN) [6], learning vector quantization (LVQ) [7,8], back propagation neural networks (BPNN) [9], and regression neural networks (RNN) [10]. When a large number of datasets is available, deep learning models are a good approach and often surpass human agreement rates [11]. CNN was used for automated
571
Nahom Ghebremeskel
1, ETJ Volume 04 Issue 04 April 2019
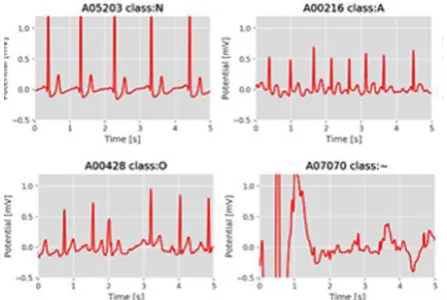
Fig 1. Four classes of the data set such that Normal sinusrhythm (class N),Atrial fibrillation (class A), Other rhythms (class O), or Too noisy (class ~)
II. METHODOLOGY
In order to classify the input ECG signal into four classes of interest, the recordings are first cut, and the data is nominated based on the labels. Each data instance is then converted into an image via spectrograms. The images are then fed into a pre-trained CNN, a 24-layered deep CNN, and features are extracted by finding the output of those layers. In the end, these features are classified with averaging-based feature aggregation across time. Our CNN based ECG arrhythmia classification consists of the following steps: data processing, future extraction using block of convolutional layers, and aggregation of features across time by averaging.
A. ECG Data Pre-Processing
In this research we used the MIT-BIH arrhythmia database for the CNN model training and testing. We used 5952 training sets and 2558 test sets of a single-lead ECG recordings, which last from 9 seconds to 61 seconds [13]. Since CNN requires an input of two-dimension, we used several data pre-processing methods.
Zero Padding: The zero-padding concept is used to add zeros to the end of time domain signal to increase its length. Since the input for CNN must be of equal size, we padded the ECGs with zero to have an equal sequence length since the data set recording lengths varied between 3s and 20s.
Fig 2. Example ECG sequence with zero padding
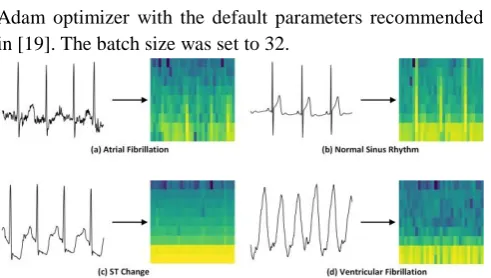
Spectrograms: Electrocardiograms are representations of the periodic cardiac cycle. ECG signals can be represented both in the time and the frequency domain. We can apply Fourier transformation to read frequency information and normalize the frequency contributions to get the power spectrum of the ECG shown above. In order to maintain
both the time and frequency content of the signal, we combine the power Spectral Density and the time series. A spectrogram returns the short-time Fourier transformation for a sequence calculated using a sliding window. The short-time Fourier transformation (STFT) is a short-time-dependent Fourier transformation, which has numerous applications in speech, sonar, and radar processing. The spectrogram of a sequence is the magnitude of the time-dependent Fourier transformation versus time. A logarithmic transformation is applied in order to increase the classification accuracy. It also improves the dynamic range of frequency. The spectrogram is computed using a Tukey window of length 64 (corresponding to 213ms at the 300Hz sampling rate of the challenge data and resulting in 33 effective frequency bins) with shape parameter 0.25 and 50% overlap [14].
Fig 3. Power spectral density (PSD)
Fig 4. (a) spectrogram without transform and (b) spectrogram with log transform
B. Feature Extraction
572
Nahom Ghebremeskel
1, ETJ Volume 04 Issue 04 April 2019
Convolutional Blocks in which each block had four layers each. The number of filters is initially set to 32 for the first three convolutional layers but increases by 32 in the last layer of each convolutional block and this last layer also applies stride 2 while all other layers keep a stride of 1[13]. We reduce the size of the output image after each block by
using stride 2 for the last layer in each block. We use sequence length of 18286, hanning window size of 64 and overlap size of 32 to set up our spectrum conversion. This results in a 570 x 33 x 1 input dimension of the network. The Convolutional neural network at the output of the last Block provides for the feature aggregation.
Fig 5. Convolutional neural network of our proposed network
Activation Function: The role of activation function is to define the output value of kernel weights in the model. In modern CNN models, nonlinear activation is widely used, including rectified linear units (ReLU), leakage rectified linear units (LReLU) [17], and exponential linear units (ELU) [18]. While ReLU is the most widely used activation function in CNN, a small negative value is generated by LReLU and ELU because the ReLU translates whole negative values to zero. This results in the dropping of participation of some nodes in learning. We used ELU after the experiment as the performance for ECG arrhythmia classification was better than LReLU. ReLU, LReLU, and ELU are shown in the following [16]:
ReLU (x) = max(0,x)
LReLU (x) = max(0,x) +
ELU (x) =
C. Aggregation of features across
While feature selection removes features from the input file, feature aggregation brings together input features into a smaller set of features called aggregated features. Variable length outputs are produced when the Convolutional Blocks process the variable length input ECG signals in full length. These variable length outputs need to be gathered across time before they are fed to a standard classifier, which typically needs the dimension of the input to be unchanging. Averaging can be used to attain temporal aggregation in our CNN architecture.
Fig 6. Architecture of proposed CNN Model
III.DATASET
The ECG arrhythmia recordings were retrieved from the MITBIH arrhythmia database. The database holds 8528 single lead ECG recordings of length varying from 9 to 61. The ECG recording is sampled at 300 samples per second. The MIT-BIH database contains approximately 110,000 ECG beats with 15 different types of arrhythmia including normal. The aim of this paper is to validate the performance of the proposed CNN. From the MIT-BIH database, each record was labelled as normal beat (NOR), AF rhythm, other rhythm, and noise record. For our network architectures we used the cross-entropy loss (reweighted as to account for the class frequencies) as training objective and employed the
Adam optimizer with the default parameters recommended in [19]. The batch size was set to 32.
573
Nahom Ghebremeskel
1, ETJ Volume 04 Issue 04 April 2019
A. Training and Evaluation
The proposed CNN algorithms used 70% of the total data for training and 30% for testing. Furthermore, the training dataset was divided into 80% for actual training and 20% for validation. Each ECG signal in the dataset was 10 s long and contained one rhythm class. An illustration of the distribution of ECG signals used for training, testing, and validation procedures can be seen in Figure 8.
Fig 8.The distribution of ECG segments used for training and testing.
We trained the CNN end-to-end from scratch without encountering any issues. Training the convolutional layers in the CNN from scratch, on the other hand, did not lead to convergence. We therefore used feature averaging across time and the convolutional layers, which were trained together with a linear classifier for 800 epochs. We also used data augmentation to overcome overfitting.
Data Augmentation:Poor generalization performance of a model is a result of overfitting, which occurs due to training on too few examples. Infinite training data can eradicate overfitting as every possible instance can be considered. Obtaining new training data is not easy in most machine learning applications, especially in image classification tasks, thereby limiting us to the training set at hand. We can, however, generate more training data through data
augmentation, which enhances the training data by randomly transforming the existing data by generating new examples. Therefore, overfitting is reduced through the artificial boosting of the size of the training set. Data augmentation can also be considered as a regularization technique. When we were trying our model, we found serious overfitting in preliminary experiments. This can be approved based on the fact that the number of parameters in the proposed architectures is large compared to the size of data set exploited for evaluation. It was demonstrated in [20] that data augmentation can regularize and prevent overfitting in neural networks and improve classification performance in problems with imbalanced class frequencies [21]. Therefore, we implemented a simple data augmentation scheme and modified the ECG data at hand. Specifically, we employ two data augmentation techniques, namely dropout bursts and random resampling.
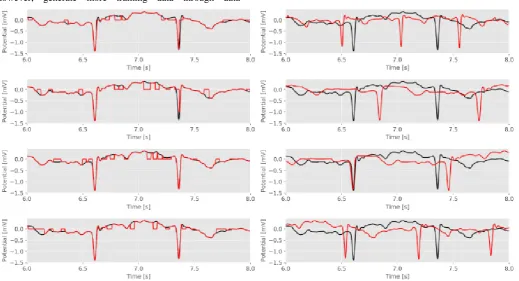
Dropout bursts are created by selecting time instants uniformly at random and setting the ECG signal values in a 50ms vicinity of those time instants to 0. Hence, dropout bursts model short periods of weak signal due to e.g. bad contact of ECG leads [13].
Assuming a heart rate of 80bpm for all training ECG signals, random resampling emulates a broader range of heart rates by uniformly resampling the ECG signals such that the heart rate of the resampled signal is uniformly distributed on the interval [60,120] bpm [13]. These emulated heart rates may be unrealistically high or low due to the assumption of an 80bpm heart rate independently of the signal [13].
Fig 9. ECG signal Augmented using Dropout and resample
574
Nahom Ghebremeskel
1, ETJ Volume 04 Issue 04 April 2019
B. Testing of Data
After completion of each training epoch, the algorithms will perform testing on the CNN model to give test accuracy. Our CNN algorithms used 800 epochs for the test data set. Twenty percent of the total training data (70% of the original dataset) was used as the validation part and was used after completion of every epoch to improve accuracy. As shown in figure 8, 30% of the total data was used for testing.
IV.RESULTS
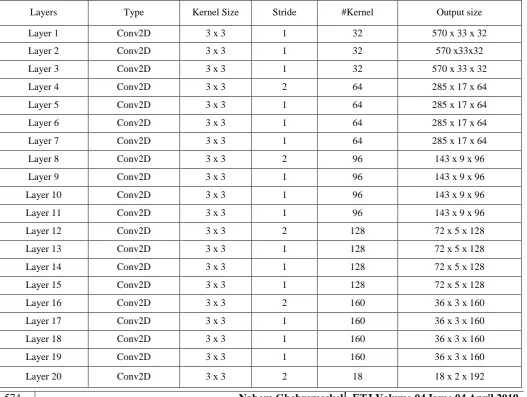
Our research further proves the convolution neural networks’ superior ability to extract all the dissimilar features, which are relatively invariant to local spectral and temporal variations. This has resulted in many breakthroughs in higher accuracy performance. The proposed CNN algorithm contains three stages: (1) data pre-processing of input; where ECG signals are processed so that the computer can understand different diseases, (2) stacking of convolution layers to extract the features, (3) layering of a fully connected layer and activation of the sigmoid function, which will predict the disease [22]. Table 1 shows the parameters of the CNN layers and their filter size and output size. The proposed CNN algorithm was
used to classify between normal sinus rhythm (N), atrial fibrillation (A), other rhythm (O), or too noisy (~). We used 24 hidden layers. The ReLU function was used to activate each hidden layer, and batch normalization was used to normalize the input layer by adjusting and scaling the activations. After the convolutional layers, the resulting outputs were passed to layer reshape. This was followed by the linear activation function in the output layer.
The network was trained with 800 epochs. It gave an accuracy of 86% for the PhysioNet/CinC Challenge 2017 dataset. Figure 7 shows the visual confusion matrix for the training part of the dataset. The confusion graph is a plot of true label versus predicted label. The network outputs are accurate, as shown by the high number of correct responses in the blue squares and the low number of incorrect responses in the white squares. The dataset contains a total of 8528 ECG recordings, 5076 (60%) data set are normal sinus rhythm(N), 758 (9%) are Atrial Fibrillation (A), 2415 (28%) are other rhythm(O) and 279 (3%) represent a too noisy rhythm (~). As mentioned previously, we used 70% of the data for training, which are 5952 ECG signals. 508, 3580, 1663 and 201 of those signals represent atrial fibrillation (A), normal sinus rhythm (N), other rhythm (O), or too noisy (~) respectively.
Table 1 Architecture of proposed CNN Model
575
Nahom Ghebremeskel
1, ETJ Volume 04 Issue 04 April 2019
Layer 21 Conv2D 3 x 3 1 18 18 x 2 x 192 Layer 22 Conv2D 3 x 3 1 18 18 x 2 x 192 Layer 23 Conv2D 3 x 3 1 18 18 x 2 x 192 Layer 24 Conv2D 3 x 3 2 9 9 x 1 x 244
Layer 25 Full 2016 4
Layer 26 Out 4
From the training data, 410 Atrial Fibrillation, 3455 normal sinus rhythm, 1179 other rhythms and 126 noisy arrythmia signals were successfully classified by the algorithm, an improvement in the accuracy of the CNN model. Figure 10 shows a graphic representation of the confusion matrix for the CNN algorithm. The network provides a reasonable prediction accuracy for the diseases. We expect a reasonable confusion because of unbalanced classes in the data set.
(a)
(b)
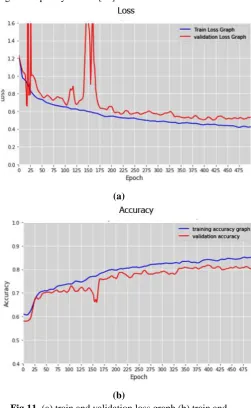
Fig 10. Confusion matrix (a) with normalization and (b)without normalization of the CNN algorithm. Fig 11 demonstrates that the model converges very well approaching 86% accuracy for the validation set. The prominent peaks in the validation accuracy are most likely caused by the unbalanced classes in the data set. This effect might be reduced by adding weight factors to the loss
function which would penalize those weights that belong to higher-frequency classes [14].
(a)
(b)
Fig 11. (a) train and validation loss graph (b) train and validation accuracy graph
V. CONCLUSION
cross-576
Nahom Ghebremeskel
1, ETJ Volume 04 Issue 04 April 2019
validation. The algorithms achieved a successful result in finding all disease state in each signal with substantial accuracy by using CNN models (Table A1). As a result, the proposed algorithms can achieve efficient diagnoses of various cardiovascular diseases with 86.7% accuracy for CNN. The results show that detection of arrhythmia with ECG spectrogram and CNN model can be an important method to help the experts to analyse cardiovascular diseases which can be find out from ECG signals. Furthermore, proposed ECG arrhythmia classification method can be applied to the medical robot or the scanner that can monitors the ECG signals and helps the medical experts to identify ECG arrhythmia more precisely and easily.
REFERENCES
1. World Health Organization (2017). Cardiovascular disease (CVDs).
http://www.who.int/mediacentre/factsheets/fs317/e n/Accessed 18 Apr 2018.
2. Melo, S.L.; Caloba, L.P.; Nadal, J. Arrhythmia analysis using artificial neural network and decimated electrocardiographic data. In Proceedings of the IEEE Conference on Computers in Cardiology, Cambridge, MA, USA, 24–27 September 2000; IEEE: Piscataway, NJ, USA, 2000; pp. 73–76.
3. Moody, G.B.; Mark, R.G. The impact of the MIT-BIH arrhythmia database. IEEE Eng. Med. Biol. Mag. 2001, 20, 45–50. [CrossRef][PubMed]
4. Salam, A.K.; Srilakshmi, G. An algorithm for ECG analysis of arrhythmia detection. In Proceedings of the IEEE International Conference on Electrical, Computer and Communication Technologies (ICECCT), Coimbatore, India, 5–7 March 2015; IEEE: Piscataway, NJ, USA, 2015; pp. 1–6.
5. Debbal, S.M. Model of differentiation between normal and abnormal heart sounds in using the discrete wavelet transform. J. Med. Bioeng. 2014,
3, 5–11. [CrossRef]
6. Perez, R.R.; Marques, A.; Mohammadi, F. The application of supervised learning through feed-forward neural networks for ECG signal classification. In Proceedings of the IEEE Canadian Conference on Electrical and Computer Engineering (CCECE), Vancouver, BC, Canada, 15–18 May 2016; IEEE: Piscataway, NJ, USA, 2016; pp. 1–4.
7. Palreddy, S.; Tompkins, W.J.; Hu, Y.H. Customization of ECG beat classifiers developed using SOM and LVQ. In Proceedings of the IEEE 17th Annual Conference on Engineering in Medicine and Biology Society, Montreal, QC, Canada, 20–23 September 1995; IEEE: Piscataway, NJ, USA, 1995; pp. 813–814.
8. Elsayad, A.M. Classification of ECG arrhythmia using learning vector quantization neural networks. In Proceedings of the 2009 International Conference on Computer Engineering & Systems, Cairo, Egypt, 14–16 December 2009; IEEE: Piscataway, NJ, USA, 2009; pp. 139–144.
9. Gautam, M.K.; Giri, V.K. A neural network approach and wavelet analysis for ECG classification. In Proceedings of the 2016 IEEE International Conference on Engineering and Technology (ICETECH), Coimbatore, India, 17–18 March 2016; IEEE: Piscataway, NJ, USA, 2016; pp. 1136–1141.
10. Zebardast, B.; Ghaffari, A.; Masdari, M. A new generalized regression artificial neural networks approach for diagnosing heart disease. Int. J. Innov. Appl. Stud. 2013, 4, 679.
11. Acharya, U.R.; Fujita, H.; Lih, O.S.; Adam, M.; Tan, J.H.; Chua, C.K. Automated detection of coronary artery disease using different durations of ECG segments with convolutional neural network.
Knowl. Based Syst. 2017, 132, 62–71. [CrossRef]
12. Nilanon, T.; Yao, J.; Hao, J.; Purushotam, S.; Liu, Y. Normal/abnormal heart recordings classification by using convolutional neural network. In Proceedings of the IEEE Conference on Computing in Cardiology Conference (CinC), Vancouver, BC, Canada, 11–14 September 2016; IEEE: Piscataway, NJ, USA, 2016; pp. 585–588.
13. Convolutional Recurrent Neural Networks for Electrocardiogram Classification. Martin Zihlmann, Dmytro Perekrestenko, Michael Tschannen, Dept. IT & EE, ETH Zurich, Switzerland.
14. A convolutional neural network to detect atrial fibrillation from a single-lead ECG
https://github.com/awerdich/physionet
15. Shadi, G.; Mostafa, A.; Nasimalsadat, M.; Kamran, K.; Ali, G. Atrial fibrillation detection using feature-based algorithm and deep conventional neural network. In Proceedings of the Conference on Computing in Cardiology (CinC), Rennes, France, 24–27 September 2017; IEEE: Piscataway, NJ, USA, 2017.
16. Cardiac Arrhythmia Classification by Multi-Layer Perceptron and Convolution Neural Network ShalinSavalia and VahidEmamian
17. Maas AL, Hannun AY, Ng AY (2013). Rectifier nonlinearities improve neural networkacoustic models. International Conference on Machine Learning 30(1):3
577
Nahom Ghebremeskel
1, ETJ Volume 04 Issue 04 April 2019
19. Kingma DP, Ba J. Adam: A method for stochasticoptimization. In Proc. Int. Conf. on Learn. Representations (ICLR). 2015; .
20. Simard P, Steinkraus D, Platt J. Best practices for convolutional neural networks applied to visual document analysis. In Proc. Int. Conf. on Document Analysis and Recognition. 2013; .
21. Chawla N, Bowyer K, Hall L, Kegelmeyer W. Smote: Synthetic minority over-sampling technique. Journal of Artificial Intelligence Research 2002.