Applying Spatial Geostatistical Analysis Models for Evaluating
Variability of Soil Properties in Eastern Shiraz, Iran
E. BIJANZADEH
1**, M. MOKARRAM
1*andR.NADERI
1*1
College of Agriculture and Natural Resources of Darab, Shiraz University, I. R. Iran
Received 12 March2013, Accepted 13 October 2013, Available Online 3 March 2015
ABSTRACT- The information on the spatial properties of soil is vital to improve soil management and to increase the crop productivity. Geostatistical analysis technique is one of the most important methods for determining the spatial properties of soil. The aim of this study was to investigate spatial variability of soil chemical and physical attributes for field management in eastern Shiraz, Iran, in 2010. In the study area, for applying geostatistical analysis, eighty soil samples were taken randomly. The variability of saturation percentage (SP), electrical conductivity (EC), soil pH, sand%, silt%, clay%, nitrogen (N), phosphorus (P) and potassium content (K) of the soil used to determine the spatial properties of soil by geostatistical analysis techniques. Soil properties were analyzed both geostatistically and statistically on the basis of the Semivariogram models. Thus, each soil parameter was used for different Semivariogram models such as spherical, circular and exponential because of their different spatial structures. The results showed that the best model to generate soil properties map was ordinary kriging with spherical and exponential Semivariogram models. The best model for soil pH, SP, K and N was the spherical model whereas for sand%, silt%, clay%, EC and P, the best model was the exponential model. Based on the models, the range of spatial dependency was found to vary within soil parameters. EC had the longest (134 meter) and pH had the shortest (19.1 meter) range of spatial dependency. Additionally, spatial patterns may vary among soil parameters in the study area. Therefore, Semivariogram models can be useful tools to determine spatial.
Keywords:Broadcast Planting, Crude Protein, Digestibility, Medicago species, Row Planting
INTRODUCTION
Evaluation of the agricultural land management practices requires knowledge of soil spatial variability (8). Wheat is one of the most important food crops in South of Iran such as Fars province. This province is also the largest wheat producer in Iran (14). Thus, studying the spatial soil properties is one of the prime concerns for field management. Spatial variability is used to predict values at unsampled locations within area (2). Natural variability of soil results from complex interactions among topography, parent material, geology, climate as well as soil
use (17, 28). Therefore, soil properties can exhibit marked spatial variability (3, 37).
Several researchers have demonstrated that soil chemical and physical attributes are correlated with soil spatial distribution (38, 35, 6). The distribution of the attributes may be influenced by soil management which leads to variability that covers an area of cultivated soils (4). Digital soil mapping is characterized as a quantitative geostatistical production of soil properties (25).
Geostatistics has been widely used for quantifying the spatial pattern of environmental variables (27). The Kriging method has been used for Geostatistical interpolation and has been proved to be sufficiently huge for estimating values at unsampled locations based on the sampled data (15, 39, 27). In recent years, soil scientists focused on using geostatistics and different kriging methods to predict soil properties at unsampled locations and to better understand their spatial variability pattern over small to large spatial scale. (7, 35, 40).
The ordinary kriging method is one of the kriging methods (26) which plays an important role in interpolation and mapping of soil properties (1, 31, 20). Triantafilis and Buchanan (34) and Juan et al. (18) used ordinary kriging to study soil. Geostatistical analyses are useful in soil science for mapping spatial variation of soil properties (24). Geostatistics analyses use the modeled variance to estimate values between samples(43). Accordingly, one of the largest wheat producing regions was located in the east of Shiraz, Fars province. Therefore, the aim of this study was to investigate spatial variability of soil chemical and physical attributes for better field management in the east of Shiraz, Iran.
MATERIALS AND METHODS Study area
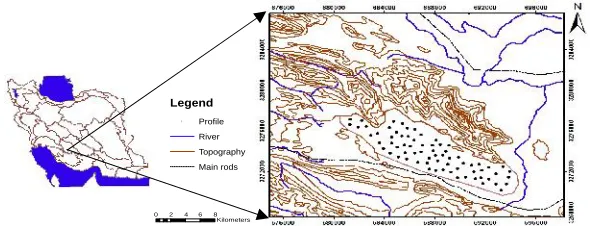
The study area was located in the east of Shiraz, Iran, between latitudes 29° 62' 00" N-29° 54' 00" N and longitudes 52° 86' 00" E- 53° 02′ 00"E with an area 48 km2 (Fig. 1); the highest elevation is 1677 m above mean sea level with semi-arid climate.
Fig. 1. Geographical location of case study
Data collection and sampling
The dataset was extracted from a land classification study done by the Fars Soil and Water Research Institute in the year 2010 with 80 soil samples consisted of: saturation percentage (SP), electrical conductivity (EC), soil pH, sand%, silt%, clay%, nitrogen,
Legend
! Profile River Topography Main rods
0 2 4 6 8
37
phosphorus and potassium applied to the soil (ppm) [(Department of Natural Resources and Watershed of Fars province, 2010), 12].
Geostatistical analysis models
Geostatistical models, including analyses of Semivariograms models, kriging and mapping of kriged estimates (15), were used to determine the variance structure of the soil properties measurements. The soil properties were analyzed using geostatistics models. Semivariance is defined by the following Eq. (15, 26, 21):
(1)
Where γ (h) is the Semivariogram models for a lag distanceh between observations z(xi)
and z(xi+h), z(xi) represents the measured value of the soil property at location xi, and
n(h) is the number of data pairs separated by a lag distance equal to h. Three models
were fitted to the experimental Semivariograms (circular, spherical and exponential). The study area were calculated using three types of kriging for estimate soil properties.
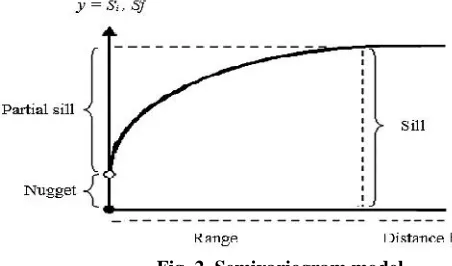
Geostatistical procedures were assessed using parameters nugget, sill and range which helped to choose the most appropriate model to predict soil parameters. In Fig. 2, the value at which the Semivariogram model attains the range, representing the value on the y-axis,is called the sill. A partial sill is the sill minus thenugget. (30).
Fig. 2. Semivariogram model
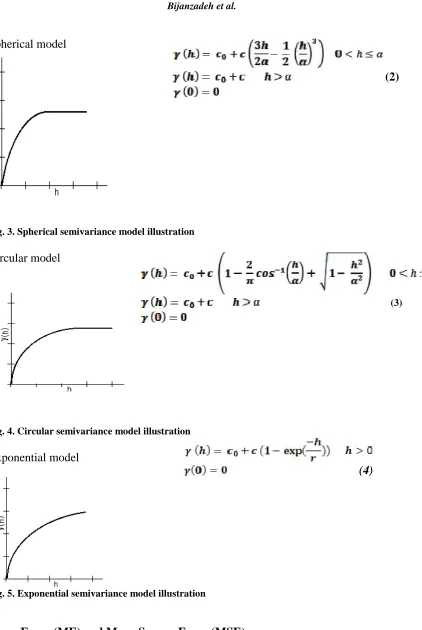
Several Semivariogram models functions, such as spherical model, exponential model and circular model, were evaluated to choose the best fit with the data. Spherical or exponential models were fitted to the empirical Semivariograms models (Fig. 3 to 5), defined in the following Eq.s of2 to 4 (30):
Spherical model
(2)
Fig. 3. Spherical semivariance model illustration
Circular model
(3)
Fig. 4. Circular semivariance model illustration
Exponential model
(4)
Fig. 5. Exponential semivariance model illustration
Mean Error (ME) and Mean Square Error (MSE)
39
and experimental values are summarized using mean error (ME) and mean square error (MSE) as follows:
(5)
(6)
Where Z* are the prediction values, Z are the mean values and n is the total number of prediction for each validation case.
RESULTS AND DISCUUSION
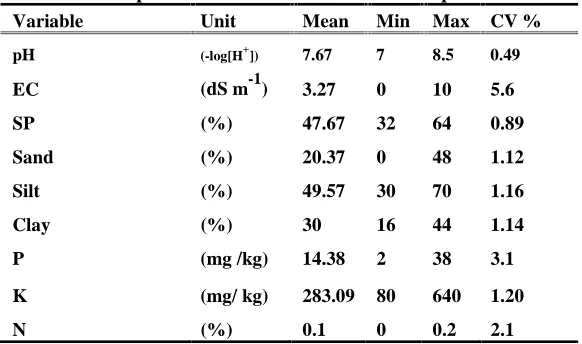
In order to conduct spatial investigation of suitable land for crop cultivation, a number of factors, such as saturation percentage (SP), electrical conductivity (EC), soil pH, sand%, silt%, clay%, nitrogen, phosphorus and potassium applied to the soil (ppm), should be assessed and measured (32). First of all, Kolmogorov-Smirnov Test (K-ST) was applied for testing the normal distribution of data and then variance of each factor was calculated in GIS software (23). The summary of the statistics of soil variable (Table 1) showed that the coefficient of variation for all of variables was low; the highest and lowest CV % was related to EC (5.6%) and pH (0.49%), respectively. In this study, CV values for selected soil properties were low, indicating the possibility of homogenous management on top soil. Descriptive statistic for soil parameters according to Table 1 Consist of: K soil ranging from80 to 640 (mg/kg), P soil rangingfrom2 to 38 (mg/kg) in 0-300 cm depth and N ranging from 0 to 0.2 (%). Most of texture soil is silt with the mean of 49.57 (%) of sand and clay. SP ranged from 32 to 64 (%) with the mean of 47.68. Mean and CV of soil EC ranged from 5.6 to 3.27 (ds/m). Mean soil pH in 0–300 cm depth was 7.67 (- log [H+]).
Table 1. Descriptive statistics for variables for a depth of 0 -300 cm.
Variable Unit Mean Min Max CV %
pH (-log[H+]) 7.67 7 8.5 0.49
EC (dS m-1) 3.27 0 10 5.6
SP (%) 47.67 32 64 0.89
Sand (%) 20.37 0 48 1.12
Silt (%) 49.57 30 70 1.16
Clay (%) 30 16 44 1.14
P (mg /kg) 14.38 2 38 3.1
K (mg/ kg) 283.09 80 640 1.20
N (%) 0.1 0 0.2 2.1
represents the average distance at which the semivariogram reaches the peak value (29). According to Table 2, the ranges of spatial dependences gave a large variation (from 19.1 meter for pH up to 134 meter for EC). The range values showed considerable variability among the parameters. There were great differences between ranges of the different soil variables, as had been already reported in several studies. Weitz et al. (42) found that most of the soil properties had variable range between 30 and 100 m. In addition, Cambardella et al. (5) reported the measure of 80 m for total organic N at a farm in Iowa, USA. Doberman (9) fitted the spherical models to variograms ranging between 80 to 140 m.
According to spatial ratio parameters of SP (spherical model), EC and sand% (exponential model) were lower than 25% and thus, were strongly spatially dependent whereas spatial ratio in pH, N, K (spherical model) and P, silt, clay (exponential model) were between 25 to 75% that were moderately spatially dependent (10,11).
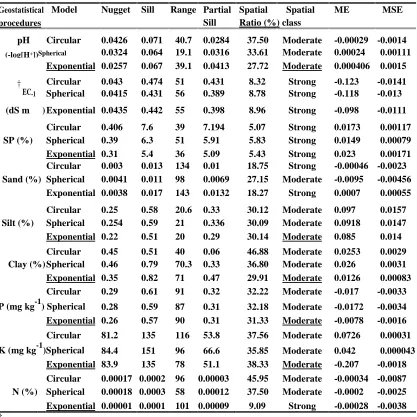
Table 2. Nugget, Sill, Range and Partial Sill of the fitted Semivariogram models for ordinary kriging in the study area
Geostatistical Model Nugget Sill Range Partial Spatial Spatial ME MSE
procedures Sill Ratio (%) class
pH Circular 0.0426 0.071 40.7 0.0284 37.50 Moderate -0.00029 -0.0014 (-log[H+])Spherical 0.0324 0.064 19.1 0.0316 33.61 Moderate 0.00024 0.00111
Exponential 0.0257 0.067 39.1 0.0413 27.72 Moderate 0.000406 0.0015
†
EC-1
Circular 0.043 0.474 51 0.431 8.32 Strong -0.123 -0.0141 Spherical 0.0415 0.431 56 0.389 8.78 Strong -0.118 -0.013 (dS m ) Exponential 0.0435 0.442 55 0.398 8.96 Strong -0.098 -0.0111
SP (%)
Circular 0.406 7.6 39 7.194 5.07 Strong 0.0173 0.00117 Spherical 0.39 6.3 51 5.91 5.83 Strong 0.0149 0.00079 Exponential 0.31 5.4 36 5.09 5.43 Strong 0.023 0.00171 Circular 0.003 0.013 134 0.01 18.75 Strong -0.00046 -0.0023 Sand (%) Spherical 0.0041 0.011 98 0.0069 27.15 Moderate -0.0095 -0.00456
Exponential 0.0038 0.017 143 0.0132 18.27 Strong 0.0007 0.00055
Silt (%)
Circular 0.25 0.58 20.6 0.33 30.12 Moderate 0.097 0.0157 Spherical 0.254 0.59 21 0.336 30.09 Moderate 0.0918 0.0147 Exponential 0.22 0.51 20 0.29 30.14 Moderate 0.085 0.014
Clay (%)
Circular 0.45 0.51 40 0.06 46.88 Moderate 0.0253 0.0029 Spherical 0.46 0.79 70.3 0.33 36.80 Moderate 0.026 0.0031 Exponential 0.35 0.82 71 0.47 29.91 Moderate 0.0126 0.00083 Circular 0.29 0.61 91 0.32 32.22 Moderate -0.017 -0.0033 P (mg kg-1) Spherical 0.28 0.59 87 0.31 32.18 Moderate -0.0172 -0.0034 Exponential 0.26 0.57 90 0.31 31.33 Moderate -0.0078 -0.0016 Circular 81.2 135 116 53.8 37.56 Moderate 0.0726 0.00031 K (mg kg-1)Spherical 84.4 151 96 66.6 35.85 Moderate 0.042 0.000043
Exponential 83.9 135 78 51.1 38.33 Moderate -0.207 -0.0018 Circular 0.00017 0.0002 96 0.00003 45.95 Moderate -0.00034 -0.0087 N (%) Spherical 0.00018 0.0003 58 0.00012 37.50 Moderate -0.0002 -0.0025 Exponential 0.00001 0.0001 101 0.00009 9.09 Strong -0.00028 -0.0038
†
41
Our findings were similar to those of Ayoubi Studies et al. (1), who reported that the range of spatial dependency was found to be varying within soil parameters and N had the shortest range of spatial dependence (23.99m) and K had the longest (93.92m). Weindorf and Zhu (41) used Semivariogram model for spatial variability of soil properties that had similar results. A large range indicates that observed values of the soil variable are affected by other values of this variable over greater distances than soil parameters that have smaller ranges (22). In the study area, a range of more than 134 m for EC indicates that EC values influence the neighboring values of EC over greater distances than other soil parameters (Table2).
In order to prepare the interpretation map for each parameters, according to Table 2, among the three models (spherical, circular and exponential Semivariogram models), the best model had the lowest mean error (ME) and mean square error (MSE). The best model for soil pH, SP, K and N were spherical model whereas for other parameters (sand%, silt%, clay%, and EC), exponential model were thebest model.
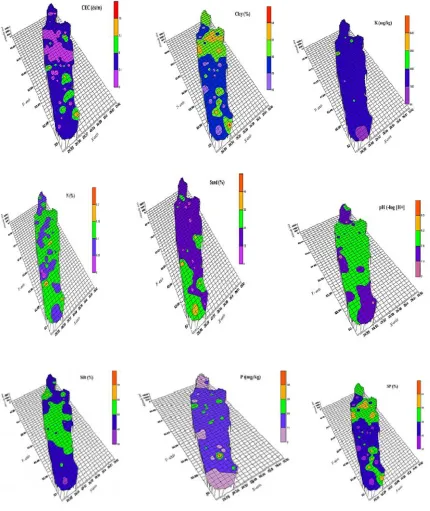
Fig. 6. Maps of soil properties prepared by ordinary kriging in the study area
CONCLUSIONS
43
widespread spatial structure. Hence, it can be used to estimate the amount of regional variable at unknown points. The ranges of some soil properties, including pH, K, N, silt, clay and P content, were higher and more widespread than other soil characteristics. The ranges were 19.1 - 134 m, showing the spatial pattern variations among soil parameters in the study area. The results of this study can be used to make recommendations for the better management and modeling of soil and plant relationships in future studies. Our results showed that the spatial distribution of soil properties might vary even within a similar agricultural management. Findings of this study can be of great help to those in charge of agricultural region to know how an area should be undertaken. Our findings showed the spatial structure found in the soil properties at the field scale in the study area. Understanding soil properties with their spatial dependency is of crucial importance for understanding the behavior of soil and hence providing better soil mangenets.
REFERENCES
1. Ayoubi, S. H., S. Mohammad Zamani and F. Khormali. 2007. Spatial variability of some soil properties for site specific farming in northern Iran. Int. J. Plant Pro. 1:36-45.
2. Bandyopadhyay, A. 2005. Sustainable agriculture. New Delhi: Northern Book Centre. 326 p.
3. Brejda, J., J. Moorman, T. B. Smith, J. L. Karlen, D. L. Allan and T. H. Dao. 2000. Distribution and variability of surface soil properties at a regional scale. Soil Sci. Soc. Am. J. 64: 974-982.
4. Buol, S. W. 1990. Suelos tropicales: clasificación y características. In: SALINAS, J.G.; GOULEY, L.M. Sorgo para suelos ácidos. Cali: CIAT, p. 49-62.
5. Cambardella, C. A., T. B. Moorman, J. M. Novak, T. B. Parkin, D. L. Karlen, R. F. Turco and A. E. Konopka. 1994. Field-scale variability of soil properties in central Iowa soils. Soil Sci. Soc. Am. J. 58: 1501- 1511.
6. Carvalho, M. P., E. Y. Takeda and O. S. Freddi. 2003. Variabilidade espacial de atributos de um solo sob videira em Vitória Brasil (SP). Revista Brasileira de Ciência do Solo, v. 27,pp. 695-703.
7. Chien, Y. J., D. Y. Lee, H. Y. Guo and K. H. Houng. 1997. Geostatistical analysis of soil properties of mid-west Taiwan soils. Soil Sci. 162. 291-298.
8. Diiwu, J. Y., R. P. Ridry, W. T. Dickenson and G. J. Wall. 1998. Effect of tillage on the spatial variability of soil water properties. Can. Agri. Eng. 40: 1-8.
9. Doberman, A. 1994. Factors causing field variation of direct- seeded flooded rice. Geoderma. 62: 125-150.
10. Duffera, M., J. G. White and R. Weisz. 2007. Spatial variability of South eastern U.S. Coastal Plain soil physical properties: Implications for site- specific management. Geoderma. 137: 327-339.
properties by spatial variability in saline and sodic soils in Arsanjan plain, southern Iran. Pakistan J. Bio. Sci. 11 (2): 238-243.
12. Emam, Y. 2007. Cereal Production. 3rded., ShirazUniversity Press. 192 pp.
13. Ewis Omran, E. S. 2012. Improving the prediction accuracy of soil mapping through geostatistics. Int. J. Geosci. 3: 574-590.
14. Fars Soil and Water Research Institute. 2010. (Personal communication).
15. Goovaerts, P. 1997. Geostatistics for Natural Resources Evaluation. Oxford University Press, NewYork. 496. p.
16. Huo, X. N., H. Li, D. F. Sun, L. D. Zhou and B. G. Li. 2012. Combining geostatistics with Moran’s I analysis for mapping soil heavy metals in China. Int. J. Environ. Res. 9: 995-1017.
17. Jenny, H. 1980. The soil resource: origin and behavior. Ecological Studies vol.37, Springer-Verlag, New York. 377 p.
18. Juan, P., J. Mateu, M. M. Jordan, J. Mataix-Solera, I. Meléndez-Pastor and J. Navarro-Pedreño. 2011. Geostatistical methods to identify and map spatial variations of soil salinity. J. Geo. Exp. 108: 62-72.
19. Kavianpoor, H., A. Esmali Ouri, Z. Jafarian Jeloudar and A. Kavian. 2012. Spatial Variability of Some Chemical and Physical Soil Properties in Nesho Mountainous Rangelands. Am. J. Environ. Eng. 1: 34-44.
20. Lark, R. M. 2002. Optimized spatial sampling of soil for estimation of the variogram by maximum likeliwood. Geoderma. 105:49–80.
21. Lopez-Granados, F., M. Jurado-Exposito, J. M. Pena-Barragan and L. Garciatorres. 2005. Using Geostatistical and remote sensing approaches for mapping soil properties. Europ. J. Agron. 23: 279-289.
22. Lopez-Granados, F., M. Jurado-Exposito, S. Atenciano, A. Garcia-Ferrer, M. S. De la Orden and L. Garcia-Torres. 2002. Spatial variability of agricultural soil parameters in southern Spain. Plant Soil. 246: 97-105.
23. Marsaglia, G., W. W. Tsang and J. Wang. 2003. Evaluating Kolmogorov’s Distribution. J. Stat. Software. 8 (18): 1- 4.
24. Materon, G. 1963. Principles of geostatistics. Econ. Geol. 58 1246-1266.
25. Mcbratney, A. B., M. L. Mendonca Santosa and B. Minasny. 2003. On digital soil mapping. Geoderma117: 3-52.
26. Meul, M. and M. Van Meirvenne. 2003. Kriging soil texture under different types of nonstationarity. Geoderma. 112: 217-233.
27. Nielsen, D. and O. Wendroth. 2003. Spatial and Temporal statistics-Sampling Field Soils and Their Vegetation. GeoEcology textbook, Catena-Verlag,Reiskirchen, 614 p.
28. Quine, T. A. and Y. Zhang. 2002. An investigation of spatial variation in soil erosion, soil properties and crop production within an agricultural field in Devon, U.K. J. Soil Water Con. 57: 50-60.
45
30. Schmidt, E., H. Tilahun, M. Kedir and H. Shiferaw. 2011. An Introduction to Geographical Information Systems. Int. Food PolicyRes. Instit.. 22:60-92
31. Sumfleth, K. and R. Duttmann. 2008. Prediction of soil property distribution in paddy soil landscapes using terrain data and satellite information as indicators. Ecol. Indic. 8: 485-501
32. Sys, C., E. Van Ranst and J. Debaveye. 1993. Land Suitability, part Ш: crop requirements, International Training Center for post graduate soil scientists. Chent university, Ghent, 199 p.
33. Trangmar, B. B., R. S. Yost and G. Uehara. 1985. Spatial dependence and interpolation of soil properties in West Sumatra. Indonesia: I. Anisotropic variation. Soil Sci. Soc. Amer. J. 50: 1391-1395.
34. Triantafilis, J. and S. M. Buchanan. 2010. Mapping the spatial distribution of subsurface saline material in the Darling River valley. J. App. Geo. 70: 144-160. 35. Tsegaye, T. and R. L. Hill. 1998. Intensive tillage effects on spatial variability of soil
test, plant growth, and nutrient uptake measurements. Soil Sci. 163:155-165.
36. Utset, A., T. Lopez and M. Diaz. 2000. A comparison of soil maps, kriging and a combined method for spatially prediction bulk density and field capacity of Ferralsols in the Havana-Matanaz Plain. Geoderma. 96:199-213.
37. Vieira, S. R. and A. Paz Gonzalez. 2003. Analysis of the spatial variability of crop yield and soil properties in small agricultural plots. Bragantia.Campinas. 62:127-138. 38. Vieira, S. R., J. L. Hatfield, D. R. Nielsen and J. W. Biggar. 1983. Geostatistical
theory and application to variability of some agronomical properties. Hilgardia. 51:65-75.
39. Webster R. and M. A. Oliver. 2001. Geostatistics for Environmenntal Scientists. Statistics in practice. Willy, Chichester, 265 p.
40. Webster, R. and M. A. Oliver. 2007. Geostatistics for Environmental Scientists. John Wiley& Sons, pp. 3-10.
41. Weindorf, D. C. and Y. Zhu. 2010. Spatial variability of soil properties at Capulin volcano, New Mexico, USA: Implications for sampling strategy, Pedosphere. 20: 185-197.
42. Weitz, A., D. Bunte and H. Hersemann. 1993. Application of nested sampling technique to determine the scale of variation in soil physical and chemical properties. Catena20: 207-214.