journal homepage: http://civiljournal.semnan.ac.ir/
Modeling of Dynamic Behavior and Estimation of
Damage Incurred by Self-Centering Rocking Walls
A. Jafari1, M.R. Ghasemi2*, H. Akbarzadeh Bengar3, B. Hassani4
1. Ph.D. Candidate, Department of Civil Engineering, University of Sistan and Baluchestan, Zahedan, Iran.
2. Professor, Department of Civil Engineering, University of Sistan and Baluchestan, Zahedan, Iran.
3. Assistant Professor, Department of Civil Engineering, University of Mazandaran, Babolsar, Iran. 4.Professor, Department of Mechanical Engineering, Ferdowsi University of Mashhad, Mashhad, Iran. Corresponding author:[email protected]
ARTICLE INFO ABSTRACT
Article history:
Received: 15 February 2017
Accepted: 03 April 2017 Self-centering rocking walls are known as viable alternatives
to typical shear walls, as they provide a number of solutions for eliminating seismic flaws of conventional designs. These rocking walls have a generally positive impact on the seismic behavior of structural systems, but their design makes them susceptible to concrete crushing around their base, which can lead to significantly adverse effects on their seismic performance. This paper first models the dynamic behavior of these walls under cyclic loading and then uses a new approach to estimate the extent and quality of damage incurred by the wall at element level. The damage index used for this purpose acts as a quantitative scale measuring the quality of damage incurred by the concrete and therefore gauging the status of the wall. This paper uses the PERFORM 3D software for theprocedure of modeling and damage estimation. To assess the accuracy of the modeling technique, results of numerical analyses are compared with the results of a full-scale load test. The quantitated damage incurred by the wall is then plotted for its surface and these damages are then compared with the actual results obtained from the test. The results indicate that the technique used by this paper to model the dynamic behavior of these walls can accurately simulate their behavior. Also, the damage index used in this paper provides an adequately accurate estimate of the damages incurred by this type of walls.
Keywords:
Self-Centering rocking walls, Damage index,
Post-Tensioning tendons,
Modeling of nonlinear behavior.
1. Introduction
A major objective of civil engineering is to create a design that would prevent or limit the extent of earthquake-induced damage in
effects. [1] A multitude of tests carried out on RC structural walls built with conventional steel reinforcement have reported their adequate flexural ductility [2], even in the event of sustaining considerable damages in the plastic zone of their base or under the risk of shear slip. [3] Meanwhile, the earthquake-induced large deflections highlight the need for adequate capacity of highly ductile walls, which can be provided by extensive inelastic deformation in the plastic zone of the wall. Plastic rotation of the base of the wall accompanied with a managed yield of reinforcement bars can be used to provide adequate structural ductility and energy dissipation under cyclic load and dampen earthquake-induced inertial force. However, this approach will result in severe damage to the base of the wall and permanent deformation of structure, which will require difficult and costly repairs or demolition of damaged sections. Furthermore, preventing the loss of life is no longer the sole purpose of earthquake-resistant designs, as designers are currently required to make sure of structure’s post-earthquake serviceability with minimum repair and renovation. This has encouraged the researchers to search for novel seismic designs that not only would ensure maximum safety of residents but also would minimize the damages incurred by the structure itself.
Many researchers [4], [5] have suggested that reinforced concrete rocking walls can act as an alternative to conventional shear walls for preventing or limiting earthquake-induced structural damages. The major advantage of rocking systems is their ability to remain stable under massive displacements without incurring a severe damage. This feature makes these systems an attractive design option for those buildings that need to maintain continuous service in post-earthquake conditions. Rocking walls are structural walls that are reinforced by unbonded post-tensioned cables. These
cables allow the wall to move with the load and then return to the center after the end of each loading cycle. Application of rocking walls is not limited to new structures, since they can also be used to retrofit conventional RC walls exhibiting an inadequate seismic resistance or the structure of already damaged buildings. [6]
a conventional plastic RC hinge. To overcome this flaw, researchers have tested and suggested a number of damper tools to accelerate the energy dissipations of rocking systems [15], [4] or proposing the hybrid system like the precast rocking walls with end columns (PreWEC) with employing the O-Connector for improving the energy dissipating of the rocking wall system [16]. An experimental study conducted by Boroschek and Yanez [17] showed that rocking mechanism has a generally positive impact on the displacement of the entire structure. They reported that due to the more stable cyclic behavior of rocking RC structures in large displacements, they suffer much lesser earthquake-induced damage than conventional RC structures. They added that using post-tensioned cables in place of conventional reinforcement bars can allow the designer to control these structures and avoid any damage through plastic buckling of rebars. As previously mentioned, the conventional structural walls are highly susceptible to plastic buckling of rebars, which is the most probable form of ductile behavior in the plastic zone of base of the walls, and this may lead to crushing of concrete and failure of reinforcement bars in those regions [18], [19], [20]. Preti and Giuriani [21] studied the slip strength of self-centering rocking walls subjected to lateral loads and reported that the weakness of these walls is the low slip strength of their base, which can be easily addressed by adding a shear key at those sections, strengthening them against shear failures.
Preti and Meda [22] studied the retrofitting of damaged monolithic rocking walls using high strength fiber concrete, and reported that after retrofitting, rocking walls exhibited a good and safe behavior against exerted loads and are therefore a viable option for reducing the repair costs and extending the serviceability of structure. Yooprasertchai et
around their base and toe (at the point where they are connected to the foundation), so their behavior highly depends on to the extent of damage incurred by their base. To investigate the behavior of these walls, this study first uses the results of a loading test conducted on a full-scale monolithic self-centering rocking wall to develop a model for its nonlinear behavior, and then assesses the validity of the developed model. After assessing the accuracy of the model, the extent and quality of damage incurred by wall base is calculated by a novel damage index. This paper uses this index, which can express important aspects of concrete’s nonlinear behavior, to obtain the element level of the concrete damage index and then it plotted for its surface. The quality and extent of damage incurred by the wall during a desired load cycle will be obtained by calculating this index for the wall elements using the quantitative scale corresponding to the qualitative damage. To gauge the accuracy of the developed damage index, the calculated values will be compared with the extent of damage caused in the actual test, and the estimated quality of the incurred damage will be discussed.
2. Damage Estimation
Finding a damage index that can properly and quantitatively expresses the damage incurred by a structure is an objective that has long preoccupied the minds of many researchers. This index must provide a quantitative measure of damages incurred by the structure under desired loading, and subsequently allow a conclusive decision to be made about the damaged structure. Damage indices are often categorized into two levels: element-level (local) and structure-level (global). These indices are often expressed as a value between 1
(representing the diminished strength of the structure) and zero (representing the perfect health of the structure). Some of the damage indices use numbers such as 0.7 or 1.27, instead of 1, to express the diminished strength of the structure.
Table 1 lists some of the most widely used structure-level damage indices [26], [27], [28] along with their values and corresponding levels of damage. Most element-level indices have a cumulative nature and reflect the dependence of damage to both amplitude and number of loading cycles. The main disadvantages of most element-level damage indices include the difficulty to find appropriate coefficients for different structural members, the lack of a precise calibration process for varying degrees of damage incurred by different members, and the difficulty of defining the impact of damage incurred by individual members on the instability of the entire structure.
walls. This highlights the importance of using an index that would be able to accurately measure the damage incurred by the base of the wall. This study uses damage
index developed by Kim et al. [29] to estimate the damage incurred by the self-centering rocking walls.
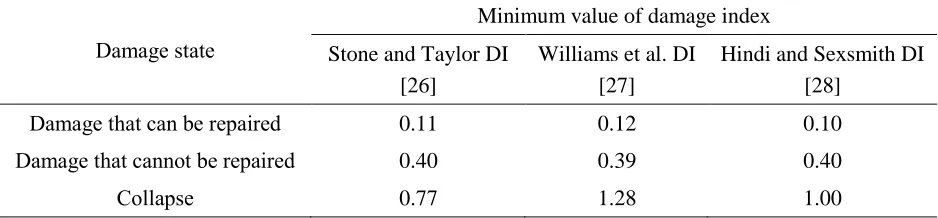
Table 1. Correlations of the damage index with the damage state
Damage state
Minimum value of damage index Stone and Taylor DI
[26]
Williams et al. DI [27]
Hindi and Sexsmith DI [28]
Damage that can be repaired 0.11 0.12 0.10
Damage that cannot be repaired 0.40 0.39 0.40
Collapse 0.77 1.28 1.00
This index has been developed through parametric studies conducted via finite element analysis. In this index, the value 0.1 represents the onset of damage or the presence of negligible damage; the value 0.4 represents significant (not easily repairable) damage, for example, significant crushing of concrete cover due to bending or shear cracking after the yield of longitudinal rebars; the value 0.75 represents the point of failure (rupture of longitudinal rebars or crushing of concrete); and the value 1.00 represents failure of most rebars and structural collapse. This damage index, which has been developed specifically for RC structures, can be calculated in two modes: compressive and tensile. The compressive damage index only represents the severity of damage in concrete sections and the tensile damage index considers only the damages incurred by rebars of RC structure. The rocking walls studied in this paper lack any longitudinal rebars, so the extent of damage is assessed only by compressive damage index.
3. Nonlinear modeling of the
self-centering rocking wall
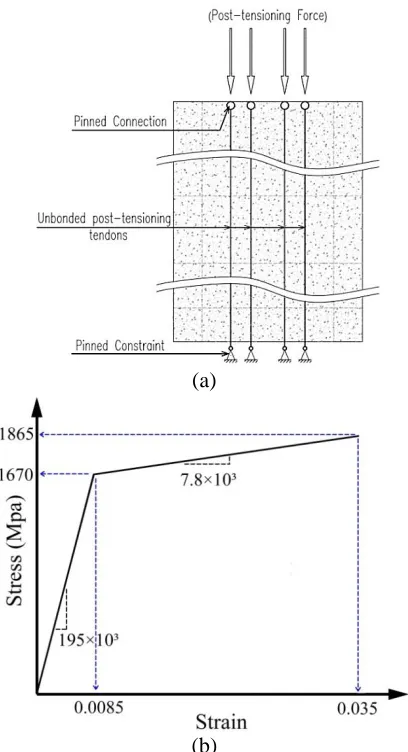
Preti et al [30] have conducted a full-scale test on a monolithic self-centering rocking
wall. This wall was post-tensioned by unbonded tendons. Preti et al [30] used two walls for this test (Fig. 1-a), the reaction wall which was a highly post-tensioned shear wall, and the self-centering rocking wall, acting as the test subject. The tested wall was designed as part of a hypothetical 5-storey building (Fig. 1-b) and was subjected to a load proportionate to this assumption. Height of the tested wall was considered to be hw =
10 m to ensure that the shear span induced at the highest level by the horizontal force would be equal to that in the supposed building. Horizontal load was applied at the height of hf = 8.80 m (from foundation) (Fig.
(a) (b) (c)
Fig. 1 Full scale experimental rocking wall (a), Full scale test wall (b), and position of the post-tensioned unbonded tendons and dowels (c) [30]
Transverse reinforcement of the wall had two different layouts. As Fig. 2 shows, in the bottom 4.00 meters of the wall, transverse reinforcement had a heavier and denser layout. Cross-section of the wall was subjected to an axial force of Fv = 2500 kN
applied through 8 tendons, each composed of three 0.6 inches diameter steel strands,
creating a post-tensioning stress of 700 MPa. It should be noted that 1000 kN of this axial force was equivalent to the gravitational forces exerted on the wall and the remaining 1500 kN was to subject the tendons to prestressing. The reciprocating horizontal force Fh was exerted by a hydraulic pump to
a point located at the height of 8.80 meters.
Fig. 2 cross-section of the wall, layout of transverse reinforcement in both sections, and position of the tendons and metal sheaths [30]
In this study, nonlinear behavior of self-centering rocking wall is modeled with PERFORM 3D (Version 4.0.0). Considering the aspect ratio of tested wall, it can be regarded as a slender wall and its nonlinear behavior can be considered to be controlled
curves of fibers of each element are assumed similar to that of materials used in the wall (steel reinforcement or concrete). To model the axial-bending behavior of the wall, cross section of each element is developed by defining an adequate layout of steel and concrete fibers in one or several layers. After that, the behavior of the wall is modeled by defining a layer with strictly shear behavior and then forming a parallel attachment between this layer and the axial-bending layer.
3.1. Wall elements
Considering the absence of longitudinal rebars, the behavior of tested rocking wall is modeled by using a single layer for axial-bending behavior and a single layer for shear behavior. Due to lack of any interaction between post-tensioning tendons and concrete, behavior of these tendons is modeled separately from the wall elements.
Considering the absence of consistency in irregular meshing and connection of two differently-sized elements, the wall is meshed as shown in Fig. 3-a. Tendons are connected to the two ends of the wall (base and top), so transverse meshing at the tendon-wall connections is inevitable. In the remaining two ends, at left and right, the wall is divided into two equal parts. In the longitudinal direction, height of the elements is selected according to their aspect ratio, geometry and structure of the wall, and loading conditions. In those sections where the steel sheaths are used as a shear key (heights of lower than 4.00 meters), height of the elements is selected to be 50cm to ensure a near-1 aspect ratio for most of these elements. In the rest of the wall, height of the elements is selected to be 1 meter to ensure that the lowest aspect ratio would be about 0.3. Due to application of concentrated horizontal loading to the top of the wall, this section is modeled by 80 and 120-cm high elements.
(a) (b)
Fig. 3 Multilayer finite element model of the wall (sorted by the type of concrete fiber) (a), and uniaxial stress-strain curve of confined and unconfined concrete fibers (b) [32]
3.2. Axial-bending and shear layers
of wall elements
elements consist of two layers: axial-bending layer and shear layer. Those regions that have a high potential for cracking or crushing, like edges, are modeled by relatively smaller fibers. The smaller area of these fibers ensures their quicker cracking or crushing with the increase of force, which leads to adequately accurate modeling of these regions as well as adequate shift of concrete’s neutral axis. As Fig. 2 shows, the entire area of cross-section (A-A), which pertains to the lower 4 meters, includes confinement reinforcement and so exhibits a behavior similar to that of confined concrete. In cross section (B-B), which pertains to rest of the wall, only two edges of the wall have confinement reinforcement; so in this cross section, concrete of those two edges are assumed to be confined and that of other sections are modeled with unconfined status. In Fig. 3-a, those elements wherein concrete fiber of axial-bending layer is confined are marked with hatching. Properties of axial-bending layer of concrete fibers are defined by Kappos equations [32].
Kappos suggested stress-strain relations for confined and unconfined concretes (Fig. 3 -b): 2 2 c c
c cc c cco
cco cco
f
Eq. (1)
25
25 1 ( )
0.25
c cc c cco cco c cc
c cc c cc
f u
f
Eq. (2)
According to Eq. (1), Eq. (2) and Fig. 3-b, the uniaxial stress-strain curve is comprised of two parts:
i) The ascending part (Eq. (1)): in this part, the stress is increased up to the maximum
confined concrete strength (fcc),
corresponding to the strain of εcco, defined as:
cc c
f k f
Eq. (3) 2
cco k co
1 ( w y )b c f k a f
where, k is the confining index, fy is the yield
strength of reinforcement; and, a and b are experimental coefficients which depend on the hoop reinforcement layout (Fig. 3-b). ii) The descending part (strain softening): in this part (Eq. (2)), the stress is linearly decreased with respect to the decreasing rate, u:
0.5 3 0.29 0.75 145 1000 cc c c w cco c w f u f b k f s k Eq. (4)
where fc, ρw, bc, and Sw are the maximum
(a) (b)
Fig. 4 Shear layers of multilayer finite elements of the wall (sorted by type) (a) and shear stress-strain curve of shear layers [31] (b)
According to Fig. 2 and Fig. 4-a, the shear layer types 1 and 3 are defined based on shear strength of the wall and confinement reinforcements, the shear layer type 2 is defined based on shear strength of concrete, steel sheaths, and confinement reinforcements, and the shear layer type 4 is defined only by the shear strength of concrete. The behavior of shear layer of the wall elements is assumed to be non-linear and independent of axial force and its properties are defined based on Esfandiari equations [31]. The proposed shear stress-strain curve (Fig. 4-b) can be used to model the behavior of shear layer of element, but this requires the introduction of a few parameters. The first part of this shear stress-strain curve exhibits a slope of G = 0.4 Ec until
reaching the cracking strength (fcr) and its
corresponding strain 0.0002. In the second part, shear strength of the section equals its nominal shear capacity (Vn), which is calculated using
the recommendations of ASCE41-06 [32]. Based on recommendations of Esfandiari, the shear strain corresponding to this shear strength is set to 0.004, and the maximum shear strain in all shear layers is assumed to be 0.01.
3.3. Modeling of unbonded
post-tensioning tendons
(a)
(b)
Fig. 5 The bar-shaped elements used for modeling of unbonded post-tensioning tendons plus supports and connections (a) and tensile stress-strain curve
of tendons s [35] (b)
The stress-strain curve of tendons, which is shown in Fig. 5-b, is tri-linear and has a slight strain hardening after yield. This curve is defined based on material properties provided in [30] as well as Walsh and Kurama recommendations [35]. After modeling the wall, the post-tensioning force of tendons (exerted on the wall) is modeled by calculating the strain equivalent to the stress induced by application of tensile force Fv = 2500 kN on 8 tendons, and then
incorporating this strain into the initial tensile strain of tendons.
3.4. Modeling of wall supports
Wall supports must be modeled by an element that would be able to properly exhibit its rocking property. According to the result of the test conducted in [30], after the exertion of lateral force, one side the studied wall easily detaches from its support, causing the other side to be pushed further against the support. The rocking property is simulated with the help of nonlinear elastic gap-hook bar elements shown in Fig. 6. These elements have positive and negative reaction displacement (gap) and stiffness. To form the rocking behavior, positive stiffness of these elements are assumed to be very small (10 N/m) and their negative stiffness are assumed to be very large (1×10¹⁴ N/m). Meanwhile, positive gap of these elements is assumed to be relatively large (0.3 m) and their negative gap is assumed to be zero. Based on these properties, when the system is subjected to tensile force, these elements easily detach from the support and move upward, but when it is subjected to compressive force, the wall support exhibits a high stiffness and acts like a rigid support. One end of these elements is connected to the nodes of the wall elements and the other end is connected to the hinged supports. Aroller support is used on one side of the wall to prevent the lateral force from triggering a lateral movement.
Fig. 6 The non-linear elastic gap-hook bar elements and the supports used for modeling of
4. Validity assessment
4.1. Validation of the model of
self-centering rocking wall
To assess the validity of developed model, the experimentally attained lateral load–drift curve provided by [30] is compared with the simulated curve obtained by the developed model. The lateral load test conducted in [30] has been performed in two modes: with friction and without friction; but the present paper only discusses the results obtained in the presence of friction. In the first part of the mentioned test (with friction), which assessed the behavior of self-centering rocking walls subjected to
quasi-static horizontal cyclic loading, seven cycles of cyclic loading, as shown in Fig. 7-a, were applied to the wall. To plot the lateral load–drift curve of the model, after applying the gravitational load and post tensioning force of tendons, we apply and increase the horizontal lateral load to the designated point such that it would create relative displacements similar to those plotted in Fig. 7-a. Next, the base shear and relative displacement induced by seven cycles of this lateral force is measured and plotted as lateral load–drift curve. Comparing the lateral load–drift curve obtained from the test data with the one obtained by the model (Fig. 7-b) demonstrates a good agreement between actual behavior of the wall and simulations of the model, and therefore confirms its validity and precision.
(a) (b)
Fig. 7 Loading history in the test [30] (a) and the curves of lateral load - drift obtained by the test and model (b)
4.2. Validation of damage estimation
As previously mentioned, the damage incurred by the wall is assessed by the damage index proposed by Kim et al [29]. In this damage index, the value 0.75 represents the compressive failure (crushing) of concrete. This compressive failure occurs when principal compressive strain of concrete element reaches εcu (failure
criterion), which can be calculated byEq. (5)
This damage index assigns the value 0.4 to irreparable damage (crushing of a significant portion of concrete cover), i.e. when principal compressive strain of concrete element reaches up to the value of compressive strain at maximum compressive stress of the concrete.
cc sm yh s cu
f f
0.004 1.4 Eq. (5)
In Eq. (5), fcc' is the confined compressive
ratio of transverse confinement reinforcement, fyh is the yield stress of
transverse confinement reinforcement, and εsm is the strain corresponding to the
maximum tensile stress of steel. Kim et al. have developed Eq. (6) for measuring the compressive damage index of concrete:
2 2 ) 2 ( 1 . . cu cs cu c e Compressiv ftg I D Eq. (6) C c AD
ftg 10.3 Eq. (7)
fc C N AD 2 1 Eq. (8)In Eq. (6), ftgc is the concrete fatigue
parameter, which must be calculated by Eq. (7), εcu denotes the ultimate compressive
strain of concrete, and εcs is the principle
compressive strain of concrete at the desired step of analysis. In Eq. (7), ADc is a
parameter representing the fatigue-induced aggregate (cumulative) damage incurred by concrete, which must be calculated byEq. (8), N2fc is the number of full cycles
of loading before failure, which must be calculated byEq. (9).
In Eq. (9), kc is the concrete’s coefficient of
variation, which must be calculated by Eq. (10) and Eq. (11).
Eq. (9) min min max max 2 min 2 max 2 min max 2 1 7 . 0 09 0 7 0 ) ( ) ( ) ( 1 1 7 0 log cu co cu cu co co co co co c fc ε ε ε . , ε . ε ε ε ε ε ε ε β , ε . < k N Eq. (10) k c s
k 2.0
Eq. (11) co cc k f f s
InEq. (11), fcc' and fco' are the confined and
unconfined compressive strength of concrete. In Eq. (9), εco denotes the strain
corresponding to the maximum unconfined
compressive strength of concrete, εmin and
εmax are minimum and maximum values of
strain in a single cycle of loading, and β is a material-based constant, which is 0.0588 for concrete. The next step is to evaluate the damages incurred by the proposed nonlinear model. Considering the high concentration of damage in the base of the wall, this stage of work employs smaller elements, especially in the lower sections. The elements used for the lateral ends of the wall in its bottom 1.40 meters have a dimension of 200×200 mm2. To achieve a uniform meshing, other elements of the wall must inevitably have the same pattern, i.e. to shrink in both directions. After re-meshing the wall, the model is analyzed by force-controlled nonlinear static analyses. After applying the lateral loads equivalent to those shown in Fig. 7-a, the damage index is calculated for the end of cycle at 2% drift.
To calculate the damage index, once numerical analyses are finished, first the parameter N2fc is calculated for each loading
cycle and then parameters ADc and ftgc
pertaining to each wall element and each cycle are obtained. The parameter ADc is
calculated cumulatively over consecutive cycles, and finally damage index of each element at each loading cycle is calculated by the use of parameters εcu (ultimate
compressive strain of concrete) and εcs
(principal compressive strain of concrete). Shear strain and compressive axial strain of elements at each step of cycle are used to calculate their principal compressive strain εcs, and the peak value of this parameter in
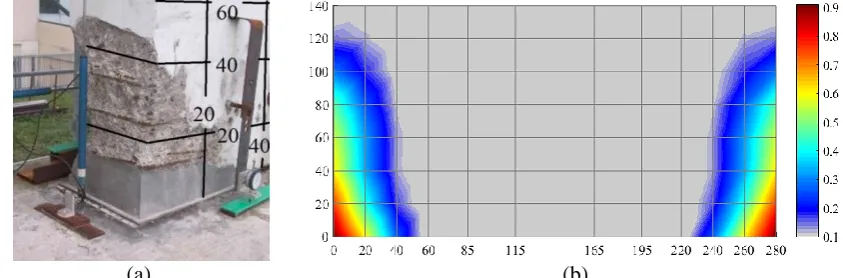
(a) (b)
Fig. 8 Details of the damage sustained by the base of the tested wall as a result of lateral loading (after repairs) [30] (a) and the contour of damage index across the surface of the wall after cyclic
loading leading to relative lateral displacement of 2%
Fig. 8-a shows that concrete of base of the wall has been damaged up to a height of about 60 cm, and the first 20 cm has been damage to the extent that the crushed concrete need to be replaced. The extent of damage has decreased with height, but the damage incurred by concrete cover up to a height of about 60 cm is well evident. On the other hand, the visible depth of damage has been about 40 cm, and this has also decreased with height. According to definitions of damage index used in this paper, the undamaged sections of the wall have a damage index of less than 0.1 (In Fig. 8-b) these regions are colored gray. The onset of formation of minute cracks is equivalent to a damage index of between 0.2 and 0.3, and the points having a damage index of 0.4 to 0.7 represent, respectively, the damaged (dislodged) concrete cover and the onset of crushing. Any point whose damage index is higher than 0.7 has certainly been subjected to concrete crushing conditions and will no longer have its former strength. Those points on the tested wall that have a damage index of between 0.1 and 0.4 have exhibited no tangible damage, but it should be noted that this range of damage index represents a transition from undamaged condition of concrete to start of damage and cracking. Comparing the Fig. 8-a and Fig. 8-b indicates that this damage index can predict the damage incurred by the wall with great precision.
5. Conclusions
The following are the conclusions obtained through numerical analyses and comparison of the obtained results with the results of a full-scale lateral loading test.
This paper used multilayer shell finite elements composed of fiber sections to model the nonlinear behavior of self-centering rocking walls. This behavior was modeled by defining two layers of elements: axial-bending layer and shear layer. Properties of axial-bending layer were defined by defining its cross section using concrete fibers. Properties of shear layer were defined based on concrete’s shear stress-strain curve and shear-resistant cross section of the wall. The unbonded post tensioning tendons were modeled by bar-shaped elements with constitutive mechanical properties similar to those of actual tendons. In the end, the rocking behavior of the wall support was simulated with the help of bar-shaped gap-hook elements. As stated in the previous section, using this method for modeling the behavior of this type of rocking wall leads to a set of results that are acceptably consistent with its actual behavior observed in the test.
estimated by an element-level (local) damage index. The damage index used in this paper, which was formulated based on parametric studies and finite element analysis, provides a quantitative estimation of the extent of damage incurred by concrete elements. Considering the unique structure of self-centering rocking walls, this study only used the compressive mode of this damage index. Comparing the results of numerical analyses conducted for relative lateral displacement of up to 2% with the experiential results showed a good agreement between the actual extents of damage and the quantitative estimation obtained from the damage index (both showed visible damage concentrated around the base of the wall). The results showed that this damage index can properly predict the damage incurred by this type of walls, and so it can be used to acquire an accurate estimate of damage and predict the behavior of these walls for the desired load.
References
[1] EERI (2012). “The Mw 7.1 Erci ş-Van, Turkey Earthquake of October 23,
2011.” EERI Special Earthquake.
[2] Pilakoutas, K., Elnasha, A. (1995). “Cyclic behavior of reinforced concrete cantilever walls, part I: experimental results.” ACI Structural Journal 92(3), 271 -281.
[3] Salonikios, TN., Kappos, AJ., Tegos, IA., Penelis, GG. (2000). “Cyclic load behavior of low-slenderness reinforced concrete walls:failure modes, strength and deformation analysis, and design implications.” ACI Structural Journal
97(1), 132-141.
[4] Holden, T., Restrepo, JI., Mander, JB. (2003). “Seismic performance of precast reinforced and prestressed concrete
walls.” Journal of Structural
Engineering129(3), 286-296.
[5] Ajrab, JJ., Pekcan, G., Mander, JB. (2004). “Rocking wall-frame structures with supplemental tendon systems.” Journal
of Structural Engineering 130(6), 895–
903..
[6] Marini, A., Riva, P., Fattori, L. (2007). “Repair and retrofitting of structural RC walls by means of post-tensioned tendons.” In : 6th international conference on fracture mechanics of
concrete and concrete structures,
Catania, 1157-1165.
[7] Housner, GW. (1963). “The behavior of inverted pendulum structures during earthquake.” Bulletin of the
Seismological Society of America 53(2),
403–417..
[8] Meek, JW. (1975). “Effects of foundation tipping on dynamic response.” Journal of
the Structural Division 101: (7), 1297–
1311.
[9] Aslam, M., Goddon, WG., Scalise, DT. (1980). “Earthquake rocking response of rigid bodies.” Journal of Structural
Engineering106(2), 377–392.
[10] Priestley, MJN., Tao, J. (1993). “Seismic response of precast prestressed concrete frames with partially debonded tendons.”
PCI Journal38(1), 58–69.
[11] Priestley, MJN., MacRae, GA. (1996). “Seismic testing of precast beam-to-column joint assemblage with unbounded tendons.” PCI Journal 41(1), 64–80.
[12] Kurama, Y. (1998). “Seismic design and response evaluation of unbounded posttensioned precast concrete walls.” Earthquake engineering research report, Lehigh University, Lehigh.
Journal of Advanced Concrete
Technology3(2), 207-223.
[14] Mander, JB., Cheng, CT. (1997). “Seismic resistance of bridge piers based on
damage avoidance design.” Technical,
Buffalo.
[15] Shen, Q., kurama, YC. (2002). “Nonlinear behavior of posttensioned hybrid coupled wall sub assemblages.” Journal of
Structural Engineering 128(10),
1290-1300.
[16] Twigden, KM., Sritharan, R, Henry, RS. (2017). “Cyclic testing of unbonded post-tensioned concrete wall systems with and without supplemental damping.” Engineering Structures 140, 406-420
[17] Boroschek, RL., Yanez, FV. (2000). “Experimental verification of basic analytical assumptions used in the analysis of structural wall buildings.”
Engineering Structures22(6), 657-669.
[18] Riva, P., Meda, A., Giuriani, E. (2003). “Cyclic behavior of a full scale RC structural wall.” Engineering Structures
25(6), 835–845.
[19] Preti, M., Giuriani , E. (2007). “Preliminary results on a full scale experiment on seismic rocking structural walls.” In : Third Central European
Congress on Concrete Engineering,
Visegrad, Hungary.
[20] Preti, M., Giuriani, E. (2007). “A Full Scale Test on the Structural Wall
Ductility under Cyclic Loading.”
Technical, Brescia.
[21] Preti, M., Giuriani, E. (2012). “Full Scale Experimental Investigation on Seismic Structural Walls.” In : Fifteenth world
conference on earthquake engineering,
Lisbon, Portugal.
[22] Preti, M., Meda, A. (2015). “RC structural wall with unbounded tendons strengthened with high-performance
fiber-reinforced concrete.” Materials and
Structures48(1), 249–260.
[23] Yooprasertchai, E., Warnitchai, P., Hadiwijaya, I. J. (2016). “Seismic performance of precast concrete rocking walls with buckling restrained braces.”
Magazine of Concrete Research 68(9),
462–476.
[24] Henry, RS., Sritharan, S., Ingham,. M. (2016). “Residual drift analyses of realistic self-centering concrete wall systems.” Earthquakes and Structures
10(2), 409-428.
[25] Hassanli, R., ElGawady, MA., Mills, JE. (2016). “Force–displacement behavior of unbounded post-tensioned concrete walls.” Engineering Structures 106(1), 495–505.
[26] Stone, WC., Taylor, AW. (1993). “Seismic performance of circular bridge column
designed in accordance with
AASHTO/CALTRANS standards.”,
Gaithersburg, Md.
[27] Williams, MS., Villemure, I., Sexsmith, RG. (1997). “Evaluation of seismic damage indices for concrete elements loaded in combined shear and flexure.”
ACI Structural Journal94(3), 315–322.
[28] Hindi, RA., Sexsmith, RG. (2001). “A proposed damage model for RC bridge columns under cyclic loading.”
Earthquake Spectra17(2), 261–290.
[29] Kim, TH., Lee, KM., Chung, YS., Shin, HM. (2005). “Seismic damage assessment of reinforced concrete bridge columns.” Engineering Structures 27(4), 576–592.
[30] Preti, M., Marini, A., Metelli, G., Giuriani, E. (2009). “Full Scale Experimental Investigation on a Prestressed Rocking Structural Wall with Unbonded Steel Dowels as Shear Keys.” In : 13th Conference ANIDIS on Earthquake
[31] Computers & Structures, I. (2006).
“PERFORM Components and Elements
for 3D and
PERFORM-COLLAPSE.” University Ave, Berkeley,
USA.
[32] Kappos, A. (1991). “Analytical prediction of collapse earthquake for RC buildings: suggested methodology.” Earthquake Engineering and Structural Dynamics
20(2), 167-176.
[33] Esfandiari, A. (2009). “Shear Strength of Structural Concrete Members Using a Uniform Shear Element Approach (PhD
Dissertation).” University of British
Columbia
[34] American Society of Civil Engineers (2007). “Seismic Rehabilitation of
Existing Buildings (ASCE41-06) .”
ASCE, Reston, U.S.A.
[35] Walsh, KQ., Kurama, YC. (2009).
“Behavior and Design of Unbounded
Post-Tensioning Strand/Anchorage
![Fig. 1 Full scale experimental rocking wall (a), Full scale test wall (b), and position of the post-tensioned unbonded tendons and dowels (c) [30]](https://thumb-us.123doks.com/thumbv2/123dok_us/8957930.1867298/6.612.232.396.411.584/experimental-rocking-scale-position-tensioned-unbonded-tendons-dowels.webp)
![Fig. 3 Multilayer finite element model of the wall (sorted by the type of concrete fiber) (a), and uniaxial stress-strain curve of confined and unconfined concrete fibers (b) [32]](https://thumb-us.123doks.com/thumbv2/123dok_us/8957930.1867298/7.612.95.517.411.631/multilayer-finite-element-concrete-uniaxial-confined-unconfined-concrete.webp)
![Fig. 4 Shear layers of multilayer finite elements of the wall (sorted by type) (a) and shear stress-strain curve of shear layers [31] (b)](https://thumb-us.123doks.com/thumbv2/123dok_us/8957930.1867298/9.612.107.528.76.305/shear-layers-multilayer-finite-elements-sorted-stress-layers.webp)
![Fig. 7 Loading history in the test [30] (a) and the curves of lateral load - drift obtained by the test and model (b)](https://thumb-us.123doks.com/thumbv2/123dok_us/8957930.1867298/11.612.94.524.324.503/fig-loading-history-curves-lateral-drift-obtained-model.webp)