MODELING FUEL INJECTION TIMING PROBLEM IN TOYOTA 3B ENGINE THROUGH ITS
SOUND USING MATLAB
*
Solomon Kebede, Ayansa Tolesa and Hailu Geremew
Department of Physics
ARTICLE INFO ABSTRACT
The target of this
The sound signals of three selected engine parts were examined using spectral analysis to detect the fault in Toyota 3B engine. These sound signals are sound from normal
faulty advanced engine and sound from faulty retarded engine in Toyota 3B engine. These all sounds have a unique spectral representation and have a unique sound which different from the normal engine sound. Sound capturing proc
microphone stand and engine and these sound signals were recorded in isolated room to avoid interference from surrounding sounds. Two signal visualization techniques were used in this work and these sound signal visualization techniques are time wave form and line spectrum. The plot of line spectrum was obtained after time domain is converted to frequency domain with help of FFT. This conversion is performed with aid of MATLAB soft ware. This th
signal has its own time waveform, line frequency spectrum and power spectrum. It can be concluded that every sound signal has a unique frequency. This work initiates others to detect the fault in engine using spectral
Copyright © 2019, Solomon Kebede, Ayansa Tolesa and Hailu Geremew License, which permits unrestricted use, distribution, and
INTRODUCTION
The engine provides the power to drive the vehicle’s wheels. All automobile engines, both Gasoline and diesel are classified as internal combustion (IC) engines because the combustion or burning that creates energy takes place inside the engine. An internal combustion engine is a device that operates on an open thermodynamic cycle and is used to convert the chemical energy of a fuel to rotational mechanical energy (F.Elamin, 2010). This rotational mechanical energy is most often used directly to provide motive power through an appropriate drive motor for an automotive application. IC engines are seen every day in automobiles, trucks, and buses (M. Esmail, 2009).The name internal combustion refers also to gas turbines except that the name is usually applied to reciprocating internal combustion (I.C.) engines like the ones found in every day automobiles. Basically there are two types of I.C. ignition engines, those which need a spark plug, and those that rely on compression of a fluid. Spark ignition engines ta
fuel and air, compress it, and ignite it using a spark plug. In compression ignition engines the mixture ignites at high temperatures and pressures. This means Compression ignition engines take atmospheric air, compress it to high pressure temperature, at which time combustion occurs. Engines are also divided into four stroke and two stroke engines. In four stroke engines the piston accomplishes four distinct strokes for every two revolutions of the crankshaft.
ISSN: 0975-833X
Article History:
Received 15th November, 2018 Received in revised form 28th December, 2018 Accepted 05th January, 2019 Published online 28th February, 2019
Citation: Solomon Kebede, Ayansa Tolesa and Hailu Geremew
using Matlab software”, International Journal of Current
Key Words:
Modeling, Engine, Fault, FFT, Line spectrum, Power spectral density, Time waveform.
*Corresponding author: Solomon Kebede,
RESEARCH ARTICLE
MODELING FUEL INJECTION TIMING PROBLEM IN TOYOTA 3B ENGINE THROUGH ITS
SOUND USING MATLAB SOFTWARE
Solomon Kebede, Ayansa Tolesa and Hailu Geremew
Physics, Wollo University, P.O.Box 1145, Dessie, Ethiopia
ABSTRACT
The target of this work was the detection of fault in engine through its sound using spectral analysis. The sound signals of three selected engine parts were examined using spectral analysis to detect the fault in Toyota 3B engine. These sound signals are sound from normal
faulty advanced engine and sound from faulty retarded engine in Toyota 3B engine. These all sounds have a unique spectral representation and have a unique sound which different from the normal engine sound. Sound capturing processes was occurred by combining laptop, mini
microphone stand and engine and these sound signals were recorded in isolated room to avoid interference from surrounding sounds. Two signal visualization techniques were used in this work and these sound signal visualization techniques are time wave form and line spectrum. The plot of line spectrum was obtained after time domain is converted to frequency domain with help of FFT. This conversion is performed with aid of MATLAB soft ware. This thesis results indicates that each sound signal has its own time waveform, line frequency spectrum and power spectrum. It can be concluded that every sound signal has a unique frequency. This work initiates others to detect the fault in engine using spectral analysis.
Ayansa Tolesa and Hailu Geremew. This is an open access article distributed under and reproduction in any medium, provided the original work is properly
The engine provides the power to drive the vehicle’s wheels. All automobile engines, both Gasoline and diesel are classified as internal combustion (IC) engines because the combustion or burning that creates energy takes place inside the engine. An l combustion engine is a device that operates on an open thermodynamic cycle and is used to convert the chemical energy of a fuel to rotational mechanical energy (F.Elamin, 2010). This rotational mechanical energy is most often used ive power through an appropriate drive motor for an automotive application. IC engines are seen every day in automobiles, trucks, and buses (M. Esmail, 2009).The name internal combustion refers also to gas turbines except that o reciprocating internal combustion (I.C.) engines like the ones found in every day automobiles. Basically there are two types of I.C. ignition engines, those which need a spark plug, and those that rely on compression of a fluid. Spark ignition engines take a mixture of fuel and air, compress it, and ignite it using a spark plug. In compression ignition engines the mixture ignites at high temperatures and pressures. This means Compression ignition engines take atmospheric air, compress it to high pressure and temperature, at which time combustion occurs. Engines are also divided into four stroke and two stroke engines. In four stroke engines the piston accomplishes four distinct strokes for every
In a two stroke engine there are two distinct strokes in one revolution. Engine is the most important component of a car. If one of its parts fails to work, when working with an engine, it may lead series system breakdown. Diesel engine problems are usually caused by the coolant
installation of fuel line and fuel pump (Ferguson, 2000). fuel supply system is not free from dirt and moisture, the water sediment get into fuel filters. The diesel injection system (injection pump and nozzles) is extrem
presence of any water in the fuel that reaches these components causes over heating of the engine. These impurities may also cause improper combustion and leads to engine parts failure. Engine requires both air and liquid coolant. Bu
uses the liquid coolant which is the mixture of water and antifreeze. Coolant is pumped around passages within the engine and returned to a storage tank via a thermostatically controlled valve. An air cooled heat exchanger located in the intake helps to disperse the heat energy absorbed by the coolant. This coolant prevents over heating of the engine which may cause explosions of engine parts and eventually leads to the destruction of the whole vehicle. Similar work has been attempted to identify fault parts of Toyota 3B engine using spectral intensity. The parts which were investigated were: Piston, piston ring, valve, defect in Nozzle, faulty in high pressure lines and faulty in fuel lines and air intake system (Lemi, 2011; Gemechis, 2013
the same Toyota 3B engine will be investigated to identify the faulty parts of an engine. Engine parts which were not International Journal of Current Research
Vol. 11, Issue, 02, pp.1039-1044, February, 2019
DOI: https://doi.org/10.24941/ijcr.34048.02.2019
Ayansa Tolesa and Hailu Geremew. 2019. “Modeling Fuel injection Timing problem in Toyota 3B engine through its sound
International Journal of Current Research, 11, (02), 1039-1044.
MODELING FUEL INJECTION TIMING PROBLEM IN TOYOTA 3B ENGINE THROUGH ITS
Solomon Kebede, Ayansa Tolesa and Hailu Geremew
1145, Dessie, Ethiopia
work was the detection of fault in engine through its sound using spectral analysis. The sound signals of three selected engine parts were examined using spectral analysis to detect the fault in Toyota 3B engine. These sound signals are sound from normal Toyota 3B engine, sound from faulty advanced engine and sound from faulty retarded engine in Toyota 3B engine. These all sounds have a unique spectral representation and have a unique sound which different from the normal esses was occurred by combining laptop, mini-jack, microphone, microphone stand and engine and these sound signals were recorded in isolated room to avoid interference from surrounding sounds. Two signal visualization techniques were used in this work and these sound signal visualization techniques are time wave form and line spectrum. The plot of line spectrum was obtained after time domain is converted to frequency domain with help of FFT. This esis results indicates that each sound signal has its own time waveform, line frequency spectrum and power spectrum. It can be concluded that every sound signal has a unique frequency. This work initiates others to detect the fault in engine
under the Creative Commons Attribution properly cited.
there are two distinct strokes in one revolution. Engine is the most important component of a car. If one of its parts fails to work, when working with an engine, it may lead series system breakdown. Diesel engine problems are usually caused by the coolant or fuel system or improper installation of fuel line and fuel pump (Ferguson, 2000). If the fuel supply system is not free from dirt and moisture, the water sediment get into fuel filters. The diesel injection system (injection pump and nozzles) is extremely sensitive to the presence of any water in the fuel that reaches these components causes over heating of the engine. These impurities may also cause improper combustion and leads to engine parts failure. Engine requires both air and liquid coolant. But, modern engine uses the liquid coolant which is the mixture of water and antifreeze. Coolant is pumped around passages within the engine and returned to a storage tank via a thermostatically controlled valve. An air cooled heat exchanger located in the ntake helps to disperse the heat energy absorbed by the coolant. This coolant prevents over heating of the engine which may cause explosions of engine parts and eventually leads to the destruction of the whole vehicle. Similar work has been dentify fault parts of Toyota 3B engine using spectral intensity. The parts which were investigated were: Piston, piston ring, valve, defect in Nozzle, faulty in high pressure lines and faulty in fuel lines and air intake system 2013; Woyessa,2013). In this work, the same Toyota 3B engine will be investigated to identify the faulty parts of an engine. Engine parts which were not
INTERNATIONAL JOURNAL OF CURRENT RESEARCH
considered in the previous studies such as (improper injection timing and insufficient coolant amount) will be considered using the spectral analysis. This method may be presented to the garage technician in the form that is easy to understand and used to assist the identification of the affected engine parts. The spectral representations of the sound produced by affected engine parts are highly essential to monitor the status of engine condition through sound signal processing from sound signals sampled and converted to discrete signal (Atta way, 2009; McLaughlin, 2009). Fourier transform is the most powerful tool in signal processing. Discrete Fourier transforms (DFT) and the fast Fourier transform (FFT) are among the most important tools in signal processing. The FFT is a type of Fourier transform designed for arrays of data, especially for computer analysis of sound waves in relatively short time than DFT. The DFT is commonly applied to implement linear filtering, spectral analysis and correlation analysis (Stein and shakarchi, 2003). This study is to develop the sound based technique to detect the damaged parts of engine which is not functional. It can be done by detecting unusual sound produced due to engine parts failure and analyzing the sound produced due to the failure of selected engine parts and relate this sound with the type of damage.
MATERIALS AND METHODS
The Study Design: This study was conducted in the Agro-Technical and Technology College located in Harar. It is a private college which has many departments under automotive stream. The reason why this college was chosen for this study was that it has its own engine on which the students perform practical learning. The engine used this study was seventeen years old. This study was designed on the detection of the Fault in engine parts through its sound (spectral analysis). The materials required in this study include: Toyota 3B Engine, Computer, Microphone, Microphone stand and Mini-jack.
Equipment Set-up: Sound capturing process took places after
arranging the stated equipment above in the following arrangement. First the Mini-jack inserted into the laptop and this Mini-jack was connected to the microphone placed on the microphone stand nearer to the engine at the fixed position. In such arrangement, the sound was taken from the normal and the fault parts of engine.
Sound Capturing: The sound signals from the Toyota 3B
engine were captured by using simple microphone placed in front of the engine head. The process of recording sound from the failed engine part was performed by deliberately inducing faults in the engine parts (improper injection timing and insufficient coolant amount). In the first part, normal part was replaced with the defective part. The sound capturing process was conducted in the sequences replacing one after the other. First the sound of normal engine was recorded and then the sound of failed engine parts recorded. This is useful because of the sound recorded from the failed engine parts were compared with the sound recorded from the failed engine parts. The sampling data was done in the power 2 and this because the developed MATLAB code for fft is sampled at a power of 2. For this reason, the researcher chose 131072(2^17) samples at a sample frequency of 44100Hz. The sample frequency is the number of sample per second during sound recording process and the time taken to record this sound data length is obtained as follows.
Ts=Ns/Fs=131072/44100=2.9722sec.
[image:2.595.308.560.108.196.2]Sound signal analysis process using MATLAB software is shown in figure below
Figure 1. Sound signal extraction process
RESULTS
AND
DISCUSSION
In this study three different sounds were captured into computer and analyzed by the help of MATLAB software. Those recorded sounds data were analyzed by visualization techniques listed below
Sound Recorded From Normal Toyota 3B Diesel Engine:
Sound recorded from normal Toyota 3B engine was analyzed by spectral analyzer techniques illustrated as follows.
Time wave form of sound recorded from normal Toyota 3B engine:Representation of time wave form of the sound from normal Toyota 3B engine is important even though its gives little information about signal. The MALAB code is used to read the recorded sound from normal engine and the plot amplitude versus time is given below.
Figure 3.1 below shows the plot of amplitude versus time of the filtered and unfiltered sound signal from normal Toyota 3B engine. As it can be seen from the figure most information was hidden since the graph is so overcrowded. But, the difference between filtered and unfiltered sound signal was clearly visible. This shows the representation of time wave form is very important to differentiate different types of signal. This means each signal has its own time wave form representation.
Frequency analysis of sound recorded from normal Toyota
3B engine:Frequency analysis is the most important tool used
(a)
[image:3.595.46.279.54.401.2](b)
Figure 3.1. Time wave form of unfiltered and filtered sound signals from normal Toyota 3B engine
(a)
(b)
Figure 3.2. Line spectrum of unfiltered and filtered sound signals from normal Toyota 3B engine
Improper Injection Timing in Toyota3B Engine:The engine’s
injection pump is very important in it to deliver fuel to combustion chamber at a correct time. If the injection pump fails to work properly, the fuel is not injects into the combustion chamber at the right time and it decreases performances of the engine.
Time wave form of sound from faulty advanced Toyota 3B
engine: Injection pump can be advanced or retarded. If
injection pump is toward the cylinder head or gear the pumping speed is advanced and it causes the nozzle sprays the fuel before the valve is opened. Due to this effect the Toyota3B engine produce unusually sound which is different from the normal sound produced by engine. This sound was recorded from the Toyota 3B engine and analyzed by signal analyzer with help of MATLAB software signal visualization techniques. The MATLAB code was used to plot these techniques which filter sound signal and unfiltered sound signal. The above two graphs are plotted time wave form of normal engine. Figure 3.3(a) shows the graph of time wave form of filtered sound signal from normal engine and the graph of 3.3(b) shows the time wave form of unfiltered sound signal from normal engine. The difference between the above two graph was clearly visible. This implies that every sound signal has its own time wave representation.
Line spectrum of sound signal from faulty advanced Toyota 3B engine: The line spectrum of the sound signal from faulty advanced Toyota 3B was obtained from the sound engine produced when the injection pump was towards the gear. The role of line spectrum was to extract the information hidden in time wave form of sound from faulty advanced engine. In this case low pass filter was used to filter out the noise added to the signal and the signal conveys the necessary information clearly since the line spectrum shows the particular frequency of signal. This particular frequency is called dominant frequency of signal. The MATLAB code plots this frequency and the plot of unfiltered and filtered sound signal are given blow. The below two figures, figure 3.4(a) and figure 3.4(b) are the plot of amplitude of sound signal versus frequency. Figure 3.4 (a) is the plot of filtered sound signal from Toyota 3B faulty advanced engine and figure 3.4(b) is the plot of unfiltered sound signal from Toyota 3B faulty advanced engine. From the above figure the maximum amplitude of filtered sound signal from faulty advanced engine is 222.6425db and this maximum magnitude of amplitude is obtained at a frequency of 137.50 Hz. For unfiltered sound signal from faulty advanced engine, the graph shows that the maximum magnitude of amplitude is 142.70907db and this amplitude is obtained at a frequency of 192.6400Hz. This value is obtained using MATLAB software. If the above two results were compared, the frequency of unfiltered sound signal was greater than the frequency of filtered sound signal. This implies that when unfiltered sound signal was passed through filtering its frequency was decreased.
Line spectrum of sound signal from faulty advanced and
normal engine: The line spectrum of sound from faulty
[image:3.595.51.279.432.780.2](a)
[image:4.595.40.289.51.386.2](b)
Figure 3.4. Line spectrum of filtered and unfiltered sound signals from faulty advanced Toyota 3B engine
Figure 3.5. Line spectrum of sound signal from faulty advanced and normal Toyota 3B engine
The maximum magnitude of amplitude for the sound signal from normal Toyota 3B engine was 188.3310db at a frequency of 150Hz and the maximum magnitudes of amplitude of sound signal from faulty advanced engine was 222.6425db at the dominant frequency of 137.50Hz.
Sound Signal Recorded From Faulty Retarded Toyota 3B
Engine: Faulty retarded Toyota 3B engine was occurred when
the injection pump is away from the gear of engine. If the injection pump speed is retarded, the fuel is not correct sprayed into .the combustion chamber at the right time. This means fuel spray is delayed. Then, since the fuel spray is delayed, the engine produces unusually sound which is different from the normal sound of engine produces. This sound was recorded and analyzed by signal visualization techniques blow.
(a)
(b)
[image:4.595.317.554.52.393.2]Figure 3.6. Time wave form of filtered and unfiltered sound signals from faulty retarded Toyota 3B engine. The above graphs, figure 3.6 (a) and figure 3.6(b) are the plots of amplitude versus time. From these graphs one cannot obtain the necessary information since the graphs are so overcrowded and also the differences between the two graphs were clearly known
Figure 3.7. Line spectrum of unfiltered and filtered sound signals from faulty retarded Toyota 3B engine
Time wave form of sound signal from faulty retarded
Toyota 3B engine: Time wave form of sound signal from
faulty retarded Toyota 3B engine was acquired when the injection pump is away from the gear. This sound signal is plotted with the help of MATLAB code and the MATLAB code plot this sound signal and the plot of unfiltered and filtered sound signal are given blow.
Line spectrum of sound signal from faulty retarded Toyota
3B engine: Line spectrum conveys clear information than the
[image:4.595.42.290.429.590.2] [image:4.595.313.557.475.633.2]sound signal is clearly known so that one can know where dominant frequency of signal is. This frequency is obtained after transforming time domain to frequency by using fast Fourier transform. This transformation was implemented by MATLAB software and the MATLAB codes which plot this line spectrum and the plot of both unfiltered and filtered sound signal are given as follows. Figure 3.7.Line spectrum of unfiltered and filtered sound signals from faulty retarded Toyota 3B engine.
Figure 3.8. Line spectrum of filtered sound signal from faulty retarded and normal Toyota 3B engine
The above two figures show the line spectrum of faulty retarded 3B Toyota engine. The figure 3.7 has maximum magnitude of amplitude of value of 254.8570 db at the frequency of 125.72 Hz. This frequency is the frequency of filtered sound signal from faulty retarded Toyota 3B engine..
Line spectrum of sound signals from faulty retarded and
normal Toyota 3B engine: It is known that the line spectrum
of a sound signal is characterized by its frequency and amplitudes.
The amplitude and frequency of the sound signal from faulty retarded and normal Toyota 3B engine is given in one plot. The plot of Line spectrum from faulty retarded and normal Toyota 3B engines is given in one plot as follows. As it can be seen from the above figure, the dominant of frequency sound signal from normal Toyota 3B engine is 150Hz and this frequency shows up the maximum magnitude of amplitudes is 188.3310db. For that of sound from faulty retarded the maximum magnitude of amplitude is254.8570db at a frequency of 125.72Hz. Therefore, one can understand the difference between sound signal from faulty retarded and normal engine.
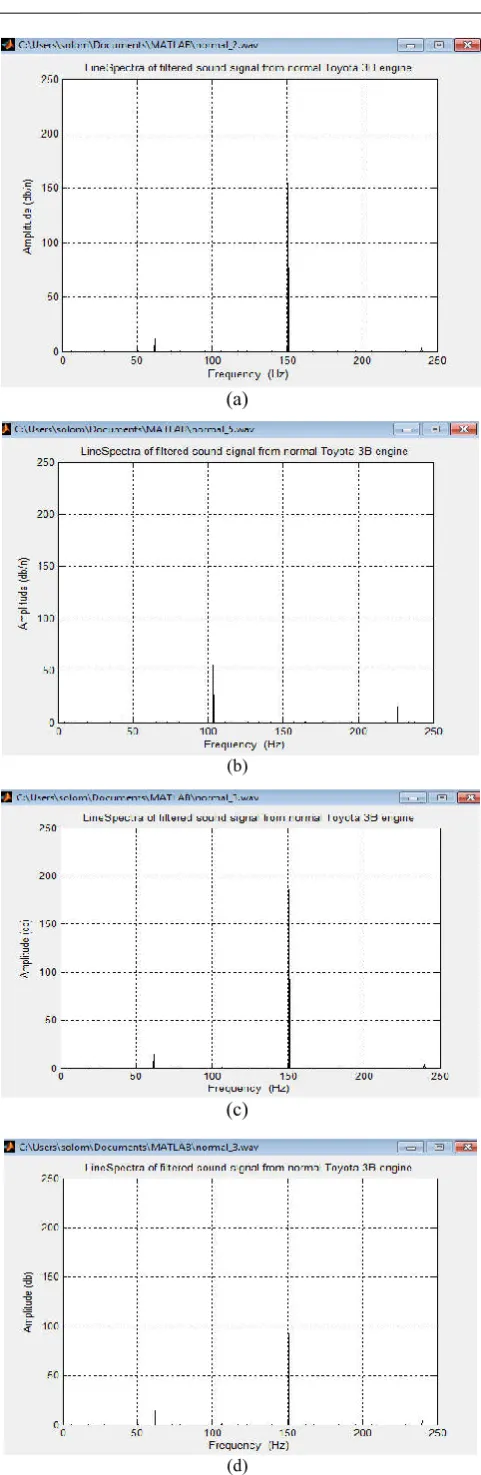
Validation of Results: To check validity of result, three
sounds were recorded in the absences of researcher for each sound recorded from Toyota 3B engine and these recorded sounds was deliberately hidden from the researcher. This because of avoiding personal bias to the result and it was known to the engine technician at Agro- technical and Technology College. These results were compared with the results researcher obtained in the work. The line spectrum of figure above (a, b and c) are the sound signal recorded by technicians from normal engine. These plots are similar with the line spectrum of the researcher obtained in figure above (d). All of them have the similar maximum magnitude of amplitude at exactly the same frequency. Therefore, they are the sound from the normal Toyota 3B engine.
(a)
(b)
(c)
(d)
[image:5.595.41.288.169.345.2]Conclusion
In this study, three sounds from selected engine parts were recorded and analyzed. These sounds were the sound signal from normal Toyota 3B engine, sound signal from faulty advanced Toyota 3B engine and sound signal from faulty retarded Toyota 3B engine. Two signal visualization plots are used in this study. These sound signals visualization techniques are time waveform and line spectrums. In the cases of time wave form, most information is hidden in it since the plot is so overcrowded. Line spectrum is obtained after transforming time domain to frequency domain with the aid of FFT. Therefore, line spectrum gives the detail information about the sound signal. Therefore these two plots are used to address the problems of Toyota 3B engine condition. Two types of sound signals were analyzed in this work. These sound signals are unfiltered and filtered sound signals were taken from Toyota 3B engine. In unfiltered sound signals, its frequency is higher than filtered sound signal. This is because of the fact that when unfiltered signal is passed through the filtering process its frequency is decreased. The filter type used in this study is low pass filter. The reason why low pass filter is chosen is that assuming interference from surrounding is small. This is because sound recording process was taken place in an isolated room to avoid inferences of sound from surroundings.
REFERENCES
Attaway, S., 2009. MATLAB: A Practical Introduction to Programming and Problem Solving. Elsevier, Inc. Jordan
Hill, Oxford. 393-395.
Attia, J., 1999. Electronics and circuit analysis using MATLAB. CRC press LLC. Boca Raton, London.
Boggess, A. and F. Narcowich, 2009. A first course in wavelets with Fourier analysis. Prentice Hall.
Cooley, T. and J. Turkey, 1965. An Algorithm for the Machine Calculation of Complex Fourier series. Mathematics of Computation.
Elali, T.,2005. Discrete systems and digital processing with MATLAB. CRC press. Boca Raton, London 143-156 Elamin, F., Gu, F. and Ball, A.,2010. Diesel engine injector
faults detection using acoustic emissionstechnique. University of Huddersfield Queensgate, Huddersfield, HD1 3DH, UK. Vol. 4, p398-424.
Esmail, M.,2009. An intelligent engine condition monitoring system. PhD dissertation, Newcastle University, UK. Ferguson, C. 2000. International combustion engine
fundamentals. McGraw-Hill, New York.
Gemechis,T.,2013. Air intake system in automotive engine through its sound using spectral analysis, MSc Project Haramaya University, Ethiopia.
Hsu, H.,1995. Schaum’s outlines of theory and problems of signal systems. McGraw-Hill Companies, Inc.
Jeffrey, A., 2002. Advanced engineering mathematics. Harcourt or Academic press. San Diego.
Karris, S.,2003. Signals and systems with MATLAB applications. Second Edition. Orchard publications.
Karris, S.,2004. Numerical analysis using MATLAB and spread sheets. Second Edition.Orchard publications,USA. Lemi Bedjise,2011. Idenfication of automotive engine
condition through its sound using spectral analysis, MSc thesis Haramaya University, Ethiopia.
Mandal, M and M. Asif,2007. Continuous and discrete time signals. Cambridge University press. Cambridge.
Mcloughlin, I.,2009.Applied speech and Audio processing: With MATLAB Examples. Cambridge University press, New York.
Melay, C.,2009. Analog and Digital, Continuous and Discrete signals. Princeton University press.
Mulgrew, B., P., Grant and J.Thompson,2003. Digital signal processing concepts and applications. Second edition. Published by palgrave Macmillan.
Mussoko, V., 2005. Biomedical Signal and Image Processing. Ph.D. Thesis. Prague.
Orfanidis, S., 2010. Introduction to signal processing. Prentice Hall, Inc.
Pulkrabek, W., 2004. Engineering Fundamentals of the
Internal Combustion Engine. Prentice Hall, New Jersely.
314-321.
Rocchesso,D., 2003. Introduction to Sound Processing. http://www.scienze.univr.it/˜rocchess: 77-139.
Salazar, F., 1998. Internal combustion engines. Department of Aerospace and Mechanical Engineering University of Notre Dame.
Shin, K. and J. Hammond, 2008. Fundamentals of Signal
Processing for Sound and Vibration Engineers. John Wiley
& Sons Ltd.
Stein, E. and R. Shakarchi,2003. Fourier analysis: An
introduction. Princeton University Press.Princeton and
Oxford.
Stoica, P. and R. Moses, 1997. Lecture notes to accompany
Introduction to Spectral Analysis. Prentice Hall.
Tonye, K. and M. Ojapah, 2013.Water-cooled petrol engines: a review of considerations in cooling systems calculations with variable coolant density and specific heat. Department of Mechanical Engineering, University of Port-Harcourt, Rivers State, Nigeria. . ISSN: Vol. 6, Issue 2, pp. 659-667. Wong, V., 2006. Signals and Systems Lecture Notes. The
University of Adelaide. Australia.
Woyessa Hordofa, 2013. Monitoring automotive engine fuel system condition through its sound using spectral analysis. MSc project in Haramaya University, Ethiopia.