Glob Change Biol. 2019;00:1–11. wileyonlinelibrary.com/journal/gcb
|
11
|
INTRODUCTION
Sustained and systematic observations of marine ecosystems are needed to understand how the ocean is changing both naturally and as a result of human activities (Hoegh-Guldberg, 2010; Miloslavich et al., 2018). Actions towards a more integrated and sustainable ocean observing system (OOS) to facilitate ocean discovery and environmental monitoring are deemed essential for future progress (Cheng et al., 2017; Duarte, Poiner, & Gunn, 2018; Visbeck, 2018). International efforts, such as the Global Ocean Observing System
(https ://www.gooso cean.org/), are contributing towards the inte-gration of multiple platforms to monitor essential biodiversity vari-ables (Miloslavich et al., 2018; Muller-Karger et al., 2018), essential ocean variables (Lindstrom, Gunn, Fischer, McCurdy, & Glover, 2012) and estimate global ocean indicators, like global ocean heat content and global steric sea level (Von Schuckmann et al., 2014).
The ocean observation network experienced a revolution with the advent of the Argo array of profiling floats since the beginning of this century (Abraham & Baringer, 2013; Riser et al., 2016; Roemmich et al., 2019). Argo is comprised of a global array of free-drifting
Received: 28 May 2019
|
Revised: 10 September 2019|
Accepted: 17 October 2019 DOI: 10.1111/gcb.14902P R I M A R Y R E S E A R C H A R T I C L E
Towards the integration of animal-borne instruments into
global ocean observing systems
David March
1,2|
Lars Boehme
3|
Joaquín Tintoré
2,4|
Pedro Joaquín Vélez-Belchi
5|
Brendan J. Godley
1This is an open access article under the terms of the Creative Commons Attribution License, which permits use, distribution and reproduction in any medium, provided the original work is properly cited.
© 2019 The Authors. Global Change Biology published by John Wiley & Sons Ltd
1Marine Turtle Research Group, Centre for
Ecology and Conservation, University of Exeter, Penryn, UK
2ICTS SOCIB – Balearic Islands Coastal
Observing and Forecasting System, Parc Bit, Palma de Mallorca, Spain
3Sea Mammal Research Unit, Scottish
Oceans Institute, University of St Andrews, St Andrews, UK
4IMEDEA (CSIC-UIB), Mediterranean
Institute of Advanced Studies, Esporles, Spain
5Instituto Español de Oceanografía, Santa
Cruz de Tenerife, Spain
Correspondence and present address David March, Centre for Ecology and Conservation, University of Exeter, Cornwall Campus, Penryn TR10 9EZ, UK.
Email: [email protected]
Funding information
Fundación BBVA; European Union, Grant/Award Number: 794938; Spanish Government, Grant/Award Number: FJCI-2014-20064 and CAS17/00193
Abstract
Marine animals are increasingly instrumented with environmental sensors that provide large volumes of oceanographic data. Here, we conduct an innovative and comprehensive global analysis to determine the potential contribution of animal-borne instruments (ABI) into ocean observing systems (OOSs) and provide a founda-tion to establish future integrated ocean monitoring programmes. We analyse the current gaps of the long-term Argo observing system (>1.5 million profiles) and assess its spatial overlap with the distribution of marine animals across eight major species groups (tuna and billfishes, sharks and rays, marine turtles, pinnipeds, cetaceans, si-renians, flying seabirds and penguins). We combine distribution ranges of 183 species and satellite tracking observations from >3,000 animals. Our analyses identify poten-tial areas where ABI could complement OOS. Specifically, ABI have the potenpoten-tial to fill gaps in marginal seas, upwelling areas, the upper 10 m of the water column, shelf regions and polewards of 60° latitude. Our approach provides the global baseline required to plan the integration of ABI into global and regional OOS while integrating conservation and ocean monitoring priorities.
K E Y W O R D S
profiling floats that measure temperature and salinity of the upper 2,000 m of the ocean (Riser et al., 2016). This project achieved its target of 3,000 active floats in 2007 providing a key component in the assessment of large-scale ocean circulation and associated global ocean climate dynamics (Roemmich et al., 2019). However, despite the extensive coverage of the Argo network, large areas of the ocean still remain under-sampled due to environmental (e.g. sea ice, shallow water, ocean divergence, wind drift), logistical (e.g. remote areas), political (e.g. exclusive economic zones [EEZ]) and security (e.g. piracy) reasons (Von Schuckmann et al., 2014). The main gaps include specific ocean regions such as the deep ocean at >2,000 m, high latitudes (>60°), the surface layer (<10 m), shelf re-gions and the marginal seas, including national EEZ (Von Schuckmann et al., 2016), which still leave systematic biases in the observation sys-tem and can have a large impact on the estimation of global ocean indicators (Henson, Beaulieu, & Lampitt, 2016; Von Schuckmann et al., 2014). Addressing these gaps is one of the key priorities iden-tified in recent reviews of the OOS (Roemmich et al., 2019; She et al., 2019; Tanhua et al., 2019). The deep ocean and high latitudes are technological difficult regions to observe, but recent advances (e.g. Deep Argo programme) have enabled researchers to investigate en-vironmental and even ecosystem processes (Fedak, 2013; Zilberman & Roemmich, 2017). The lack of data from the surface layer of the ocean is addressed using satellite data, voluntary observing ships and data from autonomous systems which can deliver high resolution data close to the ocean's surface (O'Carroll et al., 2019). This has helped to evaluate long-term trends in eastern boundary upwelling systems (Sydeman et al., 2014); however, direct in situ observations are still necessary to evaluate the hypothesis suggested by Bakun (1990) that coastal upwelling intensification will occur in response to continued global warming. Marginal and shelf seas are particularly challenging due to navigational challenges to automated systems and potentially troublesome political issues (Riser et al., 2016). Recent technological advances with two-way satellite communications (e.g. Iridium), and guidance on the use of, for example, floating buoys inside the EEZ of coastal states (IOC, 2008) has allowed the optimization of float endurances in marginal seas and coastal areas (Poulain et al., 2007; Roemmich et al., 2019). This has helped to clarify the details of water mass formation in the Mediterranean (Juza et al., 2019; Kokkini et al., 2019) and to improve predictions of the basin-scale circulation by assimilating profile data into numerical models of the circulation (Nilsson, Dobricic, Pinardi, Taillandier, & Poulain, 2011). However, sampling inside EEZs is still challenging and requires major logis-tical and polilogis-tical support from coastal states (Hermes et al., 2019; Roemmich et al., 2019). Furthermore, there is a need to enhance coverage in critical areas such as tropical regions, with large influ-ence on global climate variability and weather, and western bound-ary regions, with high levels of mesoscale variability (Roemmich et al., 2019; Smith et al., 2019). Therefore, the challenge is to advance towards sustained multi-platform and integrated observing systems that allow systematic monitoring of the wide range of spatial and tem-poral scales of ocean circulation, from local to sub-basin and global basin scale (Tintoré et al., 2013).
Instrumenting animals is not a new idea as it can be a useful tool to collect basic information (e.g. on animals' movements, phys-iology), to gain ecological and evolutionary insights, to assess spe-cies vulnerability to climate change and to project past, current and future species distributions (Boehme et al., 2012; Holloway & Miller, 2017; Kooyman, 1966; McMahon & Hays, 2006; Payne et al., 2018; Wiens, Stralberg, Jongsomjit, Howell, & Snyder, 2009). Furthermore, while this technology can provide key information on essential biodiversity variables (e.g. species distribution, phys-iology, movement, species interactions), animal-borne instruments (ABI) can now also provide essential ocean variables such as tem-perature, conductivity, light level, oxygen and chlorophyll (Bailleul, Vacquie-Garcia, & Guinet, 2015; Boehme et al., 2009; Coffey & Holland, 2015; Harcourt et al., 2019; Laidre, Heide-Jørgensen, Logsdon, Delwiche, & Nielsen, 2010; Teo et al., 2009). Therefore, integrating ABI can complement ocean observing platforms such as Argo floats, gliders and other autonomous vehicles to provide unique and cost-effective data from poorly sampled ocean regions (Block et al., 2016; Bograd, Block, Costa, & Godley, 2010; Fedak, 2004; Harcourt et al., 2019; Hays et al., 2016; Hussey et al., 2015; Roemmich et al., 2010; Roquet et al., 2014). For instance, ABI in the marine environment have been deployed on pinnipeds (Bailleul et al., 2015; Roquet et al., 2014), cetaceans (Laidre et al., 2010), marine turtles (Chambault et al., 2015, 2016; McMahon et al., 2005; McMahon & Hays, 2006; Patel et al., 2018), sharks (Coffey & Holland, 2015; Payne et al., 2018), fish (Block, Costa, Boehlert, & Kochevar, 2002), flying seabirds (Wilson et al., 2002; Wilson & Vandenabeele, 2012), penguins (Charrassin, Park, Maho, & Bost, 2002; Sala, Pisoni, & Quintana, 2017) and sirenians (Hagihara et al., 2018). Animals can travel to regions that are relatively inaccessi-ble to other ocean observing technologies. For example, they can stay in areas in which passive platforms are often pushed away (i.e. upwelling zones; Block et al., 2016) or they have problems trans-mitting their data (e.g. sea ice zones; Nicholls, Boehme, Biuw, & Fedak, 2008). Previous studies using animal instruments have fo-cused on polar areas, where pinnipeds are able to sample the upper 700 m in areas of ice cover that are inaccessible to conventional observing platforms (Fedak, 2013; Riser et al., 2016). In the polar regions, data provided by marine mammals have been used to study the biology of the species, analysing physical ocean processes and improving bathymetric data sets in regions lacking detailed sound-ing data (Fedak, 2013; Padman et al., 2010; Pauthenet et al., 2018; Pellichero, Sallée, Chapman, & Downes, 2018). Few studies, how-ever, have been conducted regarding the use of animal oceanog-raphers at mid and low (tropical) latitudes (McMahon et al., 2005; Patel et al., 2018), where significant gaps in global ocean monitoring still remain (Roemmich et al., 2019; Von Schuckmann et al., 2014).
marine species. In this study, we analyse the gaps in coverage of long-term OOSs and the overlaps with the distribution of multiple species to assess the potential role of ABI in contributing ocean research at global level. The recent development of standardized databases offers an unprecedented opportunity to link marine animal distribution across multiple taxa and operational OOSs at a global scale. The present study uses data from the long-term Argo database and open global biogeographical databases (Halpin et al., 2009; IUCN, 2017; Treasure et al., 2017). First, we analyse the inter-annual persistence of gaps of the Argo network to map under-sampled regions and identify priority areas for ocean moni-toring. Then, we overlap the under-sampled regions with extent of occurrence (EOO) maps of marine vertebrates across multiple taxa to determine the potential locations where ABI could contribute to the Global Ocean Observing System (https ://www.gooso cean. org/). Finally, we focus on pinnipeds and marine turtles as they are often equipped with ABI and incorporate satellite tracking data into our analysis.
2
|
MATERIALS AND METHODS
2.1
|
Gap analysis of the Argo network
We assembled and analysed the Argo database (>1.5 million profiles, >13,000 instruments; Argo, 2000) to map un-sampled and under-sampled areas and assess the persistence of gaps over the 2005– 2016 period. We identified Argo coldspots (i.e. spatial coherent structures larger than 25 square degrees with a gap persistence rate
of ≥80%), and summarized them as function of latitude, bathymetry
and political boundaries (see Methods S1).
2.2
|
Animal-borne platforms
We compiled a comprehensive species list of 183 marine verte-brates which can be equipped with instruments across eight taxo-nomic groups using previous multi-specific reviews (Hussey et al., 2015; Lascelles et al., 2016; Sequeira et al., 2018) and public data-bases (Halpin et al., 2009; Treasure et al., 2017). The list included those species that were equipped with any kind of instruments using satellite communications or cellular networks, in order to il-lustrate those species that have the current or future potential to relay near real-time oceanographic data from remote locations. We represented their spatial distribution at a global scale using extent of occurrence (EOO) maps created from public available databases (BirdLife International, 2017; Halpin et al., 2009; IUCN, 2017; Kot et al., 2016). EOO maps were rasterized using extent areas and summarized by number of species per taxonomic group. A number of species values for each taxon were then normalized by rescal-ing from zero to one, and averaged across taxa by cell for all taxa (Tittensor et al., 2010). In order to compare with EOO maps, we ana-lysed telemetry observations for pinnipeds (n = 10) and marine turtle
(n = 7) species. These two taxonomic groups presented the highest number of satellite tracking studies (Hussey et al., 2015) and data for a large number of animals (>3,000) were available from public da-tabases (Halpin et al., 2009; Treasure et al., 2017; see Methods S2). Maximum dive depths were extracted from public online data-bases (Froese & Pauly, 2019; IUCN, 2017; Palomares & Pauly, 2019; Ropert-Coudert, Kato, Robbins, & Humphries, 2018) and previous reviews (Halsey, Butler, & Blackburn, 2006; Hochscheid, 2014; Ponganis, 2015). Maximum dive depths were not available for 61 species; hence, 122 of the 183 selected species were used to assess the potential vertical coverage.
2.3
|
Spatial overlap
We assessed the spatial overlap between species distributions (i.e. presence/absence from both EOO and tracking data) and Argo coldspots using two complementary indices:
where S is the shared surface between the species range and the coldspot regions, C is the surface occupied only by the coldspots and R is the surface used only by the species. The first index, OVcoldspot, represents the proportion of coldspots that are covered
by the range of a single species. The second index, OVrange, indicates the amount of one species range that overlaps with coldspots sur-faces, and can be understood as an indicator of the specificity of such species to remain within coldspots areas. We calculated the spatial overlap indices for the global ocean (90°S–90°N) and five sectors of the world oceans limited by the 30th and 60th parallels (Von Schuckmann et al., 2014).
2.4
|
Data projection and representation
All spatial data sets were collated at 1° resolution and converted to the Mollweide projection with a WGS84 datum as it is an accurate single global projection that preserves geographic area and allows data transfer and analysis among operating systems and software (see Methods S3).
2.5
|
Data availability statement
The raw data that support the findings of this study are available from their corresponding data providers, but restrictions may apply to the availability of these data, which were used under license for the current study. Raw data are, however, available from the authors upon reasonable request and with permission of third-party data providers. The new generated data sets from this study are available at Figshare (https ://doi.org/10.6084/m9.figsh are.7992572).
(1)
OVcoldspot=S∕C,
(2)
2.6
|
Code availability
All data processing and analysis were completed using R statisti-cal software. All code is available on GitHub at https ://github.com/ dmarc h/abigoos and DOI https ://doi.org/10.5281/zenodo.2638123.
3
|
RESULTS
3.1
|
Gap analysis of Argo network
The spatial pattern of the Argo network reflects a global effort of ocean monitoring with a slightly higher concentration of profiles in the northern hemisphere (Figure S1a). Such a pattern is consistent throughout the years (Figure S2), presenting a higher inter-annual variability at higher latitudes (>60°) and coastal regions (Figure S1b). Sampling gaps considered both un-sampled regions (i.e. areas with-out profiles) and under-sampled regions (i.e. areas pertaining to the
lowest quintile, <20%, of the Argo profile density distribution). The
sampling gap surface was mainly comprised by under-sampled regions
(>70%) and presented a slight decreasing trend throughout the years
(Figures S3 and S4). Consequently, the spatial distribution of the sam-pling gap persistency (i.e. the percentage of years a cell was identified
as sampling gap) is presented in Figure S1c. Only spatial coherent gap areas larger than 25 square degrees with a gap persistence rate of
≥80% were retained as coldspot areas (Figure 1a). The surface of the
coldspot areas totals 69,760,000 km2, representing 18.6% of the esti
-mated global ocean surface (Table S1). Coldspots were concentrated
in higher latitudes (40.4% of the coldspot surface was found pole
-wards of 60°), in tropical regions (37.4%) and shallow waters (34.2%
at <200 m depth; Figure S5). In tropical regions, coldspots were mainly located in shallow waters, equatorial areas and marginal seas, such as the Caribbean or Indonesian Sea. Moreover, coldspots were
mostly found within economic exclusive zones (EEZs, 75.7%). EEZs
with higher coldspot surfaces corresponded to Russia, Indonesia, Antarctica, Canada and United States of America (Table S2).
3.2
|
Global distribution of potential
animal-borne platforms
The selected species of potential animal-borne platforms comprised a broad range of species across multiple taxa. The pooled distribution of all selected species resulted in higher densities at mid- and lower latitudes (Figure 1b; Table S1). Pinnipeds, flying seabirds and penguins peaked at higher latitudes, while the other groups dominate at mid- and lower latitudes (Figure 2). At the taxonomic group level, cetaceans and large bony fishes presented higher range sizes, whereas sirenians exhibited the smaller range sizes (Table S3). At the species level, EOO range sizes spanned from 140,000 km2 for the western gull (Larus
occi-dentalis) to 367,920,000 km2 for the killer whale (Orcinus orca; Data S1).
Information on maximum dive depths (Figure 3; Table S3) illustrates the potential of ABI to support vertical measurements. Most of the
species analysed in this work (63.9%) could potentially support verti
-cal measurements until 200 m depth (i.e. epipelagic zone), while only
a small proportion (15.6%) showed the potential to profile the ocean
down to 1,000 m (i.e. parking depth of Argo floats in global basins).
3.3
|
Overlap between animal-based platforms and
Argo coldspots
Overlap maps by taxonomic group illustrate the regions where ani-mal-based platforms could complement the Argo network at global scale (Figure 4). At higher latitudes, pinnipeds and penguins constitute the main groups that could complement coldspots, with some contri-bution of some species of cetaceans and flying seabirds (Figure S6). At mid- and low latitudes, the remaining groups present a higher overlap with coldspots. Together with sea turtles, cetaceans, sharks and rays and tuna and billfishes are present in most of the coldspot areas. The distribution range of sirenians limits the potential of this group to con-tribute to OOS in a small fraction of coldspots in tropical regions.
The overall overlap across all taxa with the Argo coldspots (i.e. OVcoldspot) was shown to be higher than average in the Antarctic Ocean, followed by the Southern Ocean and Tropical Ocean (Table S1). The spatial overlap at species levels shows higher
variability within and among taxonomic groups (Figure S6). At a
global level, we found that 96 species (52%) overlapped with <10%
of the coldspots (i.e. OVcoldspot), whereas only five species (2.7%) overlapped with >50% of the coldspot surface. Species with higher
range sizes (e.g. cetaceans) overlapped with a higher proportion of
the coldspots (Figure S7a). For example, the proportion of overlap
with coldspots ranged from 0% for species with small range sizes,
like the royal penguin (Eudyptes schlegeli), to values >70% for species
with global distribution ranges like the killer whale (O. orca) or the humpback whale (Megaptera novaeangliae). We found that that 40
species (22%) overlapped >50% of their ranges with coldspots (i.e.
OVrange; Figure S7b). In this case, species with higher range sizes
pre-sented lower values of overlap.
3.4
|
Overlap between telemetry data and
Argo coldspots
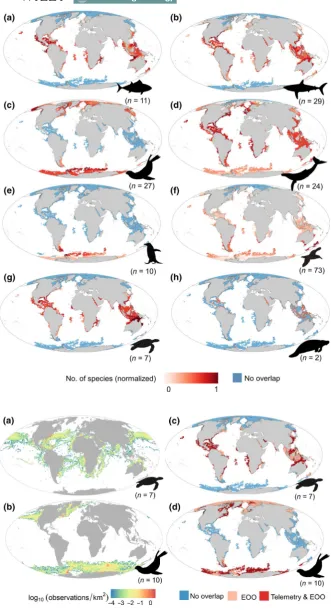
Overlap with satellite tracking data is presented in Figure 5. The restricted patterns of marine turtles and pinnipeds across their latitudinal gradients were consistent between EOO and direct ob-servations from satellite tracking data. Distribution of telemetry observations confirms that pinniped species are currently con-tributing oceanographic data at higher latitudes, while sea turtle species could complement the Argo network in shallow waters from mid- and low latitudes. Telemetry observations of sea tur-tles overlapped with gaps of the Argo network in key regions of oceanographic interest such as boundary currents (i.e. Gulf stream and Kuroshio current), major upwelling areas (e.g. Canary Current, Benguela Current) and marginal seas (e.g. Caribbean and Indonesian Seas). As expected, telemetry locations were restricted within the
F I G U R E 2 Density maps of species subject to telemetry by taxonomic group. (a) Tuna and billfishes, (b) sharks and rays, (c) pinnipeds, (d) cetaceans, (e) penguins, (f) flying seabirds, (g) turtles and (h) sirenians. Maps created by overlaying extent of occurrence maps for all identified species that were equipped with satellite tags in previous works. Colour scaling is adjusted by taxonomic group to optimize contrast. The total number of species per taxonomic group is indicated in parentheses
ranges defined by the EOO maps and presented a smaller overlap with Argo coldspots (Figure S8a). However, our results show that the restricted areas where the telemetry observations took place present higher proportion of overlap of the species distribution (Figure S8b).
4
|
DISCUSSION
This work synthetizes the distributions of marine species across mul-tiple taxa and assesses overlaps with gaps in oceanographic monitor-ing at a global scale. By linkmonitor-ing Argo coldspots with marine animal
F I G U R E 4 Overlap between gaps of the Argo network and marine species subject to telemetry. Maps represent the spatial overlap between gaps of the Argo network and extent of occurrence maps by taxonomic group: (a) tuna and billfishes, (b) sharks and rays, (c) pinnipeds, (d) cetaceans, (e) penguins, (f) flying seabirds, (g) turtles and (h) sirenians. Red cells represent the normalized number of species for each taxon and identify potential areas where animal-based platforms could complement the Argos network. Blue cells indicate Argo gap areas where no species of animal-borne platforms occur. Numbers between parentheses represent the number of species per taxonomic group
[image:6.595.47.379.37.648.2]distributions, this study provides new insights into using ABI more efficiently to complement OOSs at global and regional scales. While animal-borne platforms have been used to complement OOSs in polar regions already (Pauthenet et al., 2018; Pellichero et al., 2018; Roquet et al., 2013, 2014), our study particularly highlights the po-tential contribution in temperate and tropical regions. Such contri-bution could benefit ocean research in reducing monitoring biases and improving our understanding of key oceanographic processes. Our work has focused on the Argo network due to its global cover-age and operational capacity to provide vertical profiles. However, our approach could be extended to other ocean monitoring pro-grammes and could be used to design monitoring networks for other oceanographic platforms.
This work provides a novel framework to assess the gap per-sistency in ocean monitoring that accounts for long-term temporal persistence and takes into consideration the spatial coherence of gap surfaces. Unlike previous studies (Cheng et al., 2017; Kuragano, Fujii, & Kamachi, 2015), our approach not only considers under- sampled regions but also un-sampled areas, thus allowing the iden-tification of gap areas at a global scale. Here, we provide evidence that significant regions are still under-sampled and highlight the political challenges in sampling within EEZs. In addition to high lati-tudes, other larger areas at mid-latitudes and tropical regions such as the Tropical Asian Archipelago would require additional monitoring efforts. This region represents the largest marginal sea in tropical regions and includes the Indonesian Throughflow, a major area of oceanographic interest (Smith et al., 2019; Von Schuckmann et al., 2014). Overall, coldspot mapping provides an objective way to map gaps in coverage, and produced estimates that are consistent with previous approaches (Kuragano et al., 2015; Roemmich et al., 2019; Von Schuckmann et al., 2014, 2016).
The overlap analysis between marine animals and Argo cold-spots reveals areas where ABI could complement global ocean observing strategies. The combination of both EOO maps and tracking observations allowed us to assess the potential and cur-rent capabilities of animal-borne platforms. On the one hand, ex-tant tracking observations provide a good indicator of the current and potential contribution that can be provided by ABI, specifi-cally in pinnipeds and sea turtles. Pinnipeds constitutes the pri-mary group with which oceanographic data have already been collected at higher latitudes and used extensively for oceano-graphic research (Fedak, 2013; Padman et al., 2010). In temperate and tropical regions, tracking studies of sea turtles confirm their presence in regions of high interest to oceanography (i.e. tem-perate and tropical coldspots, boundary currents and equatorial upwellings) and environmental data collected by sea turtles have been used for oceanographic purposes in few studies (McMahon et al., 2005; Patel et al., 2018). On the other hand, the overlap with EOO offers new insights into potential contribution from other taxa and species that could provide oceanographic information. Major areas of overlap are concentrated within coastal waters and marginal seas, like the Caribbean Sea or Indonesia Seas. Our re-sults show that some of the largest coldspots areas in temperate
and tropical areas align with hotspots of assessed marine species. For example, coastal areas and eastern boundary upwelling sys-tems constitute biological hotspots offering a wide range of for-aging habitat to marine megafauna species (Bakun et al., 2015; Rodríguez-Zárate et al., 2018). Information regarding ocean use by marine fauna in regions such as tropical Asia is still relatively lim-ited (Harcourt et al., 2019). Future studies in these regions offer potential for conservation actions while presenting an important opportunity for cross-disciplinary collaboration between ecolo-gists and oceanographers.
We have outlined a novel approach for the identification of po-tential species to fill ocean monitoring gaps of the Argo network at global and regional scales. The high variability in the percentage of cover at the species level reveals the higher heterogeneity of the potential oceanographic collectors within and between tax-onomic groups. Species with large ranges (e.g. cetaceans) tend to have a higher percentage of overlap with coldspots. Given the coastal correspondence of coldspots, species with higher coastal affinity (Sequeira et al., 2018) would be more suitable to comple-ment the Argos network. Moreover, other biological traits that may affect data collection and transmission (e.g. body size, depth range or time spent at the surface) would need to be taken into account (Harcourt et al., 2019). For example, air-breathing animals (e.g. pinnipeds, penguins, sea turtles) present a good balance be-tween vertical profiles and time spent at the surface to relay data via satellite telemetry. Furthermore, differences in life history stage at population or individual levels should need to be taken into account when considering the potential contribution of ani-mal-borne platforms.
Major gaps in the Argo network with regard to the vertical dis-tribution (i.e. not directly related to the spatial disdis-tribution of cold-spots) are found in the upper layer (<10 m depth) and great depths (>2,000 m; Von Schuckmann et al., 2016). Air-breathing taxa can pro-vide profiles of the upper layer on a regular basis. Our results illus-trate that cetaceans and pinnipeds constitute the two air-breathing taxonomic groups that can perform vertical profiles to greater depths (e.g. elephant seals, sperm whales or Cuvier's beaked whales have been observed diving consistently beyond mesopelagic depths of 400–800 m). Some species from other taxonomic groups considered in this study (i.e. sharks and rays, tunas and billfishes) also have the po-tential to collect environmental information at depths >1,000 m, but with a more limited capacity to provide such information in real-time
as air-breathing animals. Overall, only eight species (6.6%) presented
maximum dive depths greater than 2,000 m (i.e. the profiling target for conventional Argo floats). Animal platforms are, therefore, unlikely to complement the Deep Argo programme, and potential contribu-tions of marine animals to deep sea research would be limited to a few specific cases (Danovaro et al., 2017; Padman et al., 2010).
communication system used for wildlife) decreases with decreasing latitude (Jeanniard-du-Dot, Holland, Schorr, & Vo, 2017). However, recent advances in the development of new sensors (Nassar et al., 2018), land-based receiving stations (Jeanniard-du-Dot et al., 2017) and communication systems (e.g. 5G networks, or satellite constel-lations like ARGOS-4, Icarus, Iridium) offer promising opportunities to expand the range of species and increase the amount and diver-sity of environmental data collected at reduced costs. In addition, further integration of animal-borne platforms into open data infra-structures (Block et al., 2016; Treasure et al., 2017), the develop-ment of metadata standards (Campbell, Urbano, Davidson, Dettki, & Cagnacci, 2016) and data collection regulations (Kraska, Crespo, & Johnston, 2015; Lennox et al., 2017) will overcome legal and techno-logical barriers and foster the use of ABI for ocean research.
Our work provides a new foundation to establish, support and improve integrated ocean monitoring programmes, and in particular using ABI, with major implications for global OOSs. Specifically, ma-rine animals could complement observing systems in marginal seas, upwelling areas, the upper 10 m of the water column, shelf regions and polewards of 60° latitude (Figure 6). Therefore, the integration of animal-borne platforms into the ocean science agenda (Visbeck, 2018) would enhance global progress in combined biological and physical studies to ensure sustainable observations. It is important to note that such programmes should also have clear biological- oriented objectives and consider welfare and ethical issues. The potential for ABI to help progress our understanding of the global ocean system is, however, very clear.
ACKNOWLEDGEMENTS
We thank all the data providers for making their data available. We gratefully acknowledge funding by the BBVA Foundation (‘Ayudas Fundación BBVA a Equipos de Investigación Científica 2016’) and
the European Union's Horizon 2020 research and innovation
pro-gramme under the Marie Skłodowska-Curie grant agreement no
794938. D.M. acknowledges support from the Spanish Government (grant ‘Juan de la Cierva-Formación’ FJCI-2014-20064, grant ‘José Castillejo’ CAS17/00193).
CONFLIC T OF INTEREST
The authors declare no competing interests. The manuscript was improved as a result of the input of the Editor and two anonymous reviewers.
ORCID
David March https://orcid.org/0000-0002-6118-761X
Lars Boehme https://orcid.org/0000-0003-3513-6816
Joaquín Tintoré https://orcid.org/0000-0002-6311-0093
Pedro Joaquín Vélez-Belchi https://orcid.org/0000-0003-2404-5679
Brendan J. Godley https://orcid.org/0000-0003-3845-0034
REFERENCES
Abraham, J. P., Baringer, M., Bindoff, N. L., Boyer, T., Cheng, L. J., Church, J. A., … Willis, J. K. (2013). A review of global ocean temperature observations: Implications for ocean heat content estimates and climate change. Reviews of Geophysics, 51, 450–483. https ://doi. org/10.1002/rog.20022
Argo. (2000). Argo float data and metadata from Global Data Assembly Centre (Argo GDAC). Seanoe. https ://doi.org/10.17882/ 42182 Bailleul, F., Vacquie-Garcia, J., & Guinet, C. (2015). Dissolved oxygen
sensor in animal-borne instruments: An innovation for monitoring the health of oceans and investigating the functioning of marine ecosystems. PLoS ONE, 10(7), 1–14. https ://doi.org/10.1371/journ al.pone.0132681
Bakun, A. (1990). Global climate change and intensification of coastal ocean upwelling. Science, 247(4939), 198–201. https ://doi.org/10. 1126/scien ce.247.4939.198
Bakun, A., Black, B. A., Bograd, S. J., García-Reyes, M., Miller, A. J., Rykaczewski, R. R., & Sydeman, W. J. (2015). Anticipated effects of climate change on coastal upwelling ecosystems. Current Climate
Change Reports, 1(2), 85–93. https ://doi.org/10.1007/s40641-015-
0008-4
BirdLife International. (2017). BirdLife International and handbook of the
birds of the world (2017) Bird species distribution maps of the world.
Version 2017.2. Retrieved from http://dataz one.birdl ife.org/speci es/ reque stdis
Block, B. A., Costa, D. P., Boehlert, G. W., & Kochevar, R. E. (2002). Revealing pelagic habitat use: The tagging of Pacific pelagics pro-gram. Oceanologica Acta, 25(5), 255–266. https ://doi.org/10.1016/ S0399-1784(02)01212-4
Block, B. A., Holbrook, C. M., Simmons, S. E., Holland, K. N., Ault, J. S., Costa, D. P., … Kochevar, R. E. (2016). Toward a national animal telem-etry network for aquatic observations in the United States. Animal
Biotelemetry, 4(1), 6. https ://doi.org/10.1186/s40317-015-0092-1
Boehme, L., Lovell, P., Biuw, M., Roquet, F., Nicholson, J., Thorpe, S. E., … Fedak, M. (2009). Technical note: Animal-borne CTD-Satellite Relay Data Loggers for real-time oceanographic data collection. Ocean
Science, 5(4), 685–695. https ://doi.org/10.5194/os-5-685-2009
Boehme, L., Thompson, D., Fedak, M., Bowen, D., Hammill, M. O., & Stenson, G. B. (2012). How many seals were there? The global shelf loss during the last glacial maximum and its effect on the size and distribution of grey seal populations. PLoS ONE, 7(12), 1–10. https :// doi.org/10.1371/journ al.pone.0053000
Bograd, S. J., Block, B. A., Costa, D. P., & Godley, B. J. (2010). Biologging technologies: New tools for conservation. Introduction. Endangered
Species Research, 10(1), 1–7. https ://doi.org/10.3354/esr00269
Campbell, H. A., Urbano, F., Davidson, S., Dettki, H., & Cagnacci, F. (2016). A plea for standards in reporting data collected by ani-mal-borne electronic devices. Animal Biotelemetry, 4(1), 1–4. https :// doi.org/10.1186/s40317-015-0096-x
Chambault, P., de Thoisy, B., Heerah, K., Conchon, A., Barrioz, S., Dos Reis, V., … Chevallier, D. (2016). The influence of oceanographic features on the foraging behavior of the olive ridley sea turtle Lepidochelys
ol-ivacea along the Guiana coast. Progress in Oceanography, 142, 58–71.
https ://doi.org/10.1016/j.pocean.2016.01.006
Chambault, P., Pinaud, D., Vantrepotte, V., Kelle, L., Entraygues, M., Guinet, C., … Chevallier, D. (2015). Dispersal and diving adjustments of the green turtle Chelonia mydas in response to dynamic environ-mental conditions during post-nesting migration. PLoS ONE, 10(9), 1–19. https ://doi.org/10.1371/journ al.pone.0137340
Charrassin, J. B., Park, Y. H., Maho, Y. L., & Bost, C. A. (2002). Penguins as oceanographers unravel hidden mechanisms of marine pro-ductivity. Ecology Letters, 5(3), 317–319. https ://doi.org/10.1046/ j.1461-0248.2002.00341.x
Cheng, L., Trenberth, K. E., Fasullo, J., Boyer, T., Abraham, J., & Zhu, J. (2017). Improved estimates of ocean heat content from 1960 to 2015. Science Advances, 3(3), 1–11. https ://doi.org/10.1126/ sciadv.1601545
Coffey, D. M., & Holland, K. N. (2015). First autonomous recording of in situ dissolved oxygen from free-ranging fish. Animal Biotelemetry, 3(1), 1–9. https ://doi.org/10.1186/s40317-015-0088-x
Danovaro, R., Aguzzi, J., Fanelli, E., Billett, D., Gjerde, K., Jamieson, A., … Dover, C. L. V. (2017). An ecosystem-based deep-ocean strat-egy. Science, 355(6324), 452–454. https ://doi.org/10.1126/scien ce. aah7178
Duarte, C. M., Poiner, I., & Gunn, J. (2018). Perspectives on a global ob-serving system to assess ocean health. Frontiers in Marine Science, 5(August), 1–9. https ://doi.org/10.3389/fmars.2018.00265 Fedak, M. (2004). Marine animals as platforms for oceanographic
sam-pling: A “win/win” situation for biology and operational oceanogra-phy. Memoirs of the National Institute for Polar Research, Special Issue, 58, 133–147.
Fedak, M. (2013). The impact of animal platforms on polar ocean ob-servation. Deep-Sea Research Part II: Topical Studies in Oceanography,
88–89, 7–13. https ://doi.org/10.1016/j.dsr2.2012.07.007
Froese, R., & Pauly, D. (Eds.). (2019). FishBase. World Wide Web electronic
publication. Retrieved from www.fishb ase.org
Hagihara, R., Jones, R. E., Sobtzick, S., Cleguer, C., Garrigue, C., & Marsh, H. (2018). Compensating for geographic variation in detection prob-ability with water depth improves abundance estimates of coastal marine megafauna. PLoS ONE, 13(1), 1–15. https ://doi.org/10.1371/ journ al.pone.0191476
Halpin, P., Read, A., Fujioka, E. I., Best, B., Donnelly, B., Hazen, L., … Hyrenbach, K. D. (2009). OBIS-SEAMAP: The world data center for marine mammal, sea bird, and sea turtle distributions. Oceanography, 22(2), 104–115. https ://doi.org/10.5670/ocean og.2009.42
Halsey, L. G., Butler, P. J., & Blackburn, T. M. (2006). A phylogenetic analysis of the allometry of diving. The American Naturalist, 167(2), 276–287. https ://doi.org/10.1086/499439
Harcourt, R., Sequeira, A. M. M., Zhang, X., Roquet, F., Komatsu, K., Heupel, M., … Fedak, M. A. (2019). Animal-borne telemetry: An in-tegral component of the ocean observing toolkit. Frontiers in Marine
Science, 6, 326. https ://doi.org/10.3389/fmars.2019.00326
Harrison, A.-L., Costa, D. P., Winship, A. J., Benson, S. R., Bograd, S. J., Antolos, M., … Block, B. A. (2018). The political biogeography of mi-gratory marine predators. Nature Ecology & Evolution, 2(10), 1571– 1578. https ://doi.org/10.1038/s41559-018-0646-8
Hays, G. C., Ferreira, L. C., Sequeira, A. M. M., Meekan, M. G., Duarte, C. M., Bailey, H., … Thums, M. (2016). Key questions in marine mega-fauna movement ecology. Trends in Ecology & Evolution, 31(6), 463– 475. https ://doi.org/10.1016/j.tree.2016.02.015
Henson, S. A., Beaulieu, C., & Lampitt, R. (2016). Observing climate change trends in ocean biogeochemistry: When and where.
Global Change Biology, 22(4), 1561–1571. https ://doi.org/10.1111/
gcb.13152
Hermes, J. C., Masumoto, Y., Beal, L. M., Roxy, M. K., Vialard, J., Andres, M., … Yu, W. (2019). A sustained ocean observing system in the Indian Ocean for climate related scientific knowledge and societal needs. Frontiers in Marine Science, 6, 355. https ://doi.org/10.3389/ fmars.2019.00355
Hochscheid, S. (2014). Why we mind sea turtles’ underwater business: A review on the study of diving behavior. Journal of Experimental
Marine Biology and Ecology, 450, 118–136. https ://doi.org/10.1016/
j.jembe.2013.10.016
Hoegh-Guldberg, O. (2010). The impact of climate change on the world's marine ecosystems. Science, 328(5985), 1523–1529. https ://doi. org/10.1126/scien ce.1189930
Holloway, P., & Miller, J. A. (2017). A quantitative synthesis of the movement concepts used within species distribution modelling.
Ecological Modelling, 356, 91–103. https ://doi.org/10.1016/j.ecolm
odel.2017.04.005
Hussey, N. E., Kessel, S. T., Aarestrup, K., Cooke, S. J., Cowley, P. D., Fisk, A. T., … Whoriskey, F. G. (2015). Aquatic animal telemetry: A panoramic window into the underwater world. Science, 348(6240), 1255642. https ://doi.org/10.1126/scien ce.1255642
IOC. (2008). Guidelines for the implementation of Resolution XX-6 of the IOC Assembly regarding the deployment of profiling floats in the high
seas within the framework of the Argo Programme, Resolution EC-XLI.4.
International Oceanographic Commission.
IUCN. (2017). The IUCN red list of threatened species. Version 2017–3. Retrieved from http://www.iucnr edlist.org
Jeanniard-du-Dot, T., Holland, K., Schorr, G. S., & Vo, D. (2017). Motes enhance data recovery from satellite-relayed biologgers and can fa-cilitate collaborative research into marine habitat utilization. Animal
Biotelemetry, 5(1), 1–15. https ://doi.org/10.1186/s40317-017-0132-0
Juza, M., Escudier, R., Vargas-Yáñez, M., Mourre, B., Heslop, E., Allen, J., & Tintoré, J. (2019). Characterization of changes in Western Intermediate Water properties enabled by an innovative geome-try-based detection approach. Journal of Marine Systems, 191, 1–12. https ://doi.org/10.1016/j.jmars ys.2018.11.003
Klein, C. J., Brown, C. J., Halpern, B. S., Segan, D. B., McGowan, J., Beger, M., & Watson, J. E. M. (2015). Shortfalls in the global protected area network at representing marine biodiversity. Scientific Reports, 5, 1–7. https ://doi.org/10.1038/srep1 7539
Kokkini, Z., Mauri, E., Gerin, R., Poulain, P. M., Simoncelli, S., & Notarstefano, G. (2019). On the salinity structure in the South Adriatic as derived from float and glider observations in 2013–2016.
Deep Sea Research Part II: Topical Studies in Oceanography, 104625.
https ://doi.org/10.1016/j.dsr2.2019.07.013
Kooyman, G. L. (1966). Maximum diving capacities of the Weddell seal
Leptonychotes weddeili. Science, 151(3717), 1553–1554. https ://doi.
org/10.1126/scien ce.151.3717.1553
Kot, C. Y., Fujioka, E., DiMatteo, A. D., Wallace, B. P., Hutchinson, B. J., Cleary, J., … Mast, R. B. (2016). The state of the world's sea turtles on-line database: Data provided by the SWOT Team and hosted on
OBIS-SEAMAP. Oceanic Society, Conservation International, IUCN Marine
Turtle Specialist Group (MTSG), and Marine Geospatial Ecology, Lab, Duke University.
Kuragano, T., Fujii, Y., & Kamachi, M. (2015). Evaluation of the Argo net-work using statistical space-time scales derived from satellite altim-etry data. Journal of Geophysical Research C: Oceans, 120(6), 4534– 4551. https ://doi.org/10.1002/2015J C010730
Laidre, K. L., Heide-Jørgensen, M. P., Logsdon, M. L., Delwiche, L., & Nielsen, T. G. (2010). A whale of an opportunity: Examining the ver-tical structure of chlorophyll-a in high Arctic waters using instru-mented marine predators. Marine Biology Research, 6(6), 519–529. https ://doi.org/10.1080/17451 00090 3505616
Lascelles, B. G., Taylor, P. R., Miller, M. G. R., Dias, M. P., Oppel, S., Torres, L., … Small, C. (2016). Applying global criteria to tracking data to define important areas for marine conservation. Diversity
and Distributions, 22(4), 422–431. https ://doi.org/10.1111/ddi.
12411
Lennox, R. J., Aarestrup, K., Cooke, S. J., Cowley, P. D., Deng, Z. D., Fisk, A. T., … Young, N. (2017). Envisioning the future of aquatic animal tracking: Technology, science, and application. BioScience, 67(10), 884–896. https ://doi.org/10.1093/biosc i/bix098
Lindstrom, E., Gunn, J., Fischer, A., McCurdy, L. K., & Glover, A. (2012). A framework for ocean observing. In IOC information document. Paris, France: UNESCO. http://doi.org/10.5270/Ocean Obs09-FOO McMahon, C. R., Autret, E., Houghton, J. D., Lovell, P., Myers, A. E.,
& Hays, G. C. (2005). Animal borne sensors successfully capture the thermal properties of ocean basins. Limnology and
Oceano-graphy: Methods, 3, 392–398. https ://doi.org/10.4319/lom.2005.
3.392
McMahon, C. R., & Hays, G. C. (2006). Thermal niche, large-scale move-ments and implications of climate change for a critically endangered marine vertebrate. Global Change Biology, 12(7), 1330–1338. https :// doi.org/10.1111/j.1365-2486.2006.01174.x
Miloslavich, P., Bax, N. J., Simmons, S. E., Klein, E., Appeltans, W., Aburto-Oropeza, O., … Shin, Y.-J. (2018). Essential ocean variables for global sustained observations of biodiversity and ecosystem changes.
Global Change Biology, 24(6), 2416–2433. https ://doi.org/10.1111/
gcb.14108
Muller-Karger, F. E., Miloslavich, P., Bax, N. J., Simmons, S., Costello, M. J., Sousa Pinto, I., … Geller, G. (2018). Advancing marine biolog-ical observations and data requirements of the complementary es-sential ocean variables (EOVs) and eses-sential biodiversity variables (EBVs) frameworks. Frontiers in Marine Science, 5, 1–15. https ://doi. org/10.3389/fmars.2018.00211
Nassar, J. M., Khan, S. M., Velling, S. J., Diaz-Gaxiola, A., Shaikh, S. F., Geraldi, N. R., … Hussain, M. M. (2018). Compliant lightweight non-invasive standalone “Marine Skin” tagging system. npj Flexible
Electronics, 2(1), 13. https ://doi.org/10.1038/s41528-018-0025-1
Nicholls, K. W., Boehme, L., Biuw, M., & Fedak, M. A. (2008). Wintertime ocean conditions over the southern Weddell Sea continental shelf, Antarctica. Geophysical Research Letters, 35(21), 1–5. https ://doi. org/10.1029/2008G L035742
Nilsson, J. A. U., Dobricic, S., Pinardi, N., Taillandier, V., & Poulain, P.-M. (2011). On the assessment of Argo float trajectory assimilation in the Mediterranean Forecasting System. Ocean Dynamics, 61(10), 1475–1490. https ://doi.org/10.1007/s10236-011-0437-0
O'Carroll, A. G., Armstrong, E. M., Beggs, H. M., Bouali, M., Casey, K. S., Corlett, G. K., … Wimmer, W. (2019). Observational needs of sea surface temperature. Frontiers in Marine Science, 6, 420. https ://doi. org/10.3389/fmars.2019.00420
O'Hara, C. C., Afflerbach, J. C., Scarborough, C., Kaschner, K., & Halpern, B. S. (2017). Aligning marine species range data to better serve science and conservation. PLoS ONE, 12(5), 1–15. https ://doi. org/10.1371/journ al.pone.0175739
Padman, L., Costa, D. P., Bolmer, S. T., Goebel, M. E., Huckstadt, L. A., Jenkins, A., … Shoosmith, D. R. (2010). Seals map bathymetry of the Antarctic continental shelf. Geophysical Research Letters, 37(21). https ://doi.org/10.1029/2010G L044921
Palomares, M., & Pauly, D. (Eds.). (2019). SeaLifeBase. World Wide Web
electronic publication. Retrieved from www.seali febase.org, version
(04/2019).
Patel, S. H., Barco, S. G., Crowe, L. M., Manning, J. P., Matzen, E., Smolowitz, R. J., & Haas, H. L. (2018). Loggerhead turtles are good ocean-observers in stratified mid-latitude regions. Estuarine, Coastal
and Shelf Science, 213(August), 128–136. https ://doi.org/10.1016/
j.ecss.2018.08.019
Pauthenet, E., Roquet, F., Madec, G., Guinet, C., Hindell, M., McMahon, C. R., … Nerini, D. (2018). Seasonal meandering of the polar front up-stream of the Kerguelen Plateau. Geophysical Research Letters, 45(18), 9774–9781. https ://doi.org/10.1029/2018G L079614
Payne, N. L., Meyer, C. G., Smith, J. A., Houghton, J. D. R., Barnett, A., Holmes, B. J., … Halsey, L. G. (2018). Combining abundance and performance data reveals how temperature regulates coastal oc-currences and activity of a roaming apex predator. Global Change
Biology, 24(5), 1884–1893. https ://doi.org/10.1111/gcb.14088
Pellichero, V., Sallée, J.-B., Chapman, C. C., & Downes, S. M. (2018). The southern ocean meridional overturning in the sea-ice sector is driven by freshwater fluxes. Nature Communications, 9(1), 1789. https ://doi. org/10.1038/s41467-018-04101-2
Ponganis, P. J. (2015). Diving physiology of marine mammals and seabirds. https ://doi.org/10.1017/CBO97 81139 045490
Poulain, P.-M., Barbanti, R., Font, J., Cruzado, A., Millot, C., Gertman, I., … Petit de la Villeon, L. (2007). MedArgo: A drifting profiler program in the Mediterranean Sea. Ocean Science, 3(3), 379–395. https ://doi. org/10.5194/os-3-379-2007
Riser, S. C., Freeland, H. J., Roemmich, D., Wijffels, S., Troisi, A., Belbéoch, M., … Jayne, S. R. (2016). Fifteen years of ocean observations with the global Argo array. Nature Climate Change, 6(2), 145–153. https :// doi.org/10.1038/nclim ate2872
Rodríguez-Zárate, C. J., Sandoval-Castillo, J., van Sebille, E., Keane, R. G., Rocha-Olivares, A., Urteaga, J., & Beheregaray, L. B. (2018). Isolation by environment in the highly mobile olive ridley turtle (Lepidochelys
olivacea) in the eastern Pacific. Proceedings of the Royal Society B:
Biological Sciences, 285(1878), 20180264. https ://doi.org/10.1098/
rspb.2018.0264
Roemmich, D., Alford, M. H., Claustre, H., Johnson, K., King, B., Moum, J., … Yasuda, I. (2019). On the future of Argo: A global, full-depth, multi-disciplinary array. Frontiers in Marine Science, 6, 439. https :// doi.org/10.3389/fmars.2019.00439
Roemmich, D., Boehme, L., Claustre, H., Freeland, H., Fukasawa, M., Goni, G., … Testor, P. (2010). Integrating the ocean observing system: Mobile platforms. In J. Hall, D. E. Harrison, & D. Stammer (Eds.), Proceedings of OceanObs’09: Sustained ocean observations and information for
so-ciety (Vol. 1), Venice, Italy, 21–25 September 2009. Noordwijk, the
Netherlands: ESA Publication WPP-306. http://doi.org/10.5270/ Ocean Obs09.pp.33
Ropert-Coudert, Y., Kato, A., Robbins, A., & Humphries, G. (2018).
The Penguiness book. World Wide Web electronic publication.
Retrieved from http://www.pengu iness.net, version 3.0. https ://doi. org/10.13140/ RG.2.2.32289.66406
Roquet, F., Williams, G., Hindell, M. A., Harcourt, R., McMahon, C., Guinet, C., … Fedak, M. (2014). A Southern Indian Ocean database of hydrographic profiles obtained with instrumented elephant seals.
Scientific Data, 1, 140028. https ://doi.org/10.1038/sdata.2014.28
Roquet, F., Wunsch, C., Forget, G., Heimbach, P., Guinet, C., Reverdin, G., … Fedak, M. A. (2013). Estimates of the Southern Ocean gen-eral circulation improved by animal-borne instruments. Geophysical
Research Letters, 40(23), 6176–6180. https ://doi.org/10.1002/2013G
L058304
Sala, J. E., Pisoni, J. P., & Quintana, F. (2017). Three-dimensional tempera-ture fields of the North Patagonian Sea recorded by Magellanic pen-guins as biological sampling platforms. Estuarine, Coastal and Shelf
Selig, E. R., Turner, W. R., Troëng, S., Wallace, B. P., Halpern, B. S., Kaschner, K., … Mittermeier, R. A. (2014). Global priorities for ma-rine biodiversity conservation. PLoS ONE, 9(1), 1–11. https ://doi. org/10.1371/journ al.pone.0082898
Sequeira, A. M. M., Rodríguez, J. P., Eguíluz, V. M., Harcourt, R., Hindell, M., Sims, D. W., … Thums, M. (2018). Convergence of marine mega-fauna movement patterns in coastal and open oceans. Proceedings
of the National Academy of Sciences of the United States of America,
115(12), 3072–3077. https ://doi.org/10.1073/pnas.17161 37115 She, J., Muñiz Piniella, Á., Benedetti-Cecchi, L., Boehme, L., Boero, F.,
Christensen, A., … Zingone, A. (2019). An Integrated approach to coastal and biological observations. Frontiers in Marine Science, 6, 314. https ://doi.org/10.3389/fmars.2019.00314
Smith, N., Kessler, W. S., Cravatte, S., Sprintall, J., Wijffels, S., Cronin, M. F., … Brunner, S. (2019). Tropical pacific observing system. Frontiers
in Marine Science, 6, 31. https ://doi.org/10.3389/fmars.2019.00031
Sydeman, W. J., García-Reyes, M., Schoeman, D. S., Rykaczewski, R. R., Thompson, S. A., Black, B. A., & Bograd, S. J. (2014). Climate change and wind intensification in coastal upwelling ecosystems. Science, 345(6192), 77–80. https ://doi.org/10.1126/scien ce.1251635 Tanhua, T., McCurdy, A., Fischer, A., Appeltans, W., Bax, N., Currie,
K., … Wilkin, J. (2019). What we have learned from the framework for ocean observing: Evolution of the global ocean observing sys-tem. Frontiers in Marine Science, 6, 471. https ://doi.org/10.3389/ fmars.2019.00471
Teo, S., Kudela, R., Rais, A., Perle, C., Costa, D., & Block, B. (2009). Estimating chlorophyll profiles from electronic tags deployed on pe-lagic animals. Aquatic Biology, 5(2), 195–207. https ://doi.org/10.3354/ ab00152
Tintoré, J., Vizoso, G., Casas, B., Heslop, E., Pascual, A., Orfila, A., … Manriquez, M. (2013). SOCIB: The Balearic Islands coastal ocean ob-serving and forecasting system responding to science, technology and society needs. Marine Technology Society Journal, 47(1), 101–117. https ://doi.org/10.4031/MTSJ.47.1.10
Tittensor, D. P., Mora, C., Jetz, W., Lotze, H. K., Ricard, D., Berghe, E. V., & Worm, B. (2010). Global patterns and predictors of marine bio-diversity across taxa. Nature, 466(7310), 1098–1101. https ://doi. org/10.1038/natur e09329
Treasure, A., Roquet, F., Ansorge, I., Bester, M., Boehme, L., Bornemann, H., … de Bruyn, P. J. N. (2017). Marine mammals exploring the oceans pole to pole: A review of the MEOP consortium. Oceanography, 30(2), 132–138. https ://doi.org/10.5670/ocean og.2017.234
Visbeck, M. (2018). Ocean science research is key for a sustainable fu-ture. Nature Communications, 9(1), 1–4. https ://doi.org/10.1038/ s41467-018-03158-3
Von Schuckmann, K., Palmer, M. D., Trenberth, K. E., Cazenave, A., Chambers, D., Champollion, N., … Wild, M. (2016). An imperative to monitor Earth's energy imbalance. Nature Climate Change, 6(2), 138– 144. https ://doi.org/10.1038/nclim ate2876
Von Schuckmann, K., Sallée, J.-B., Chambers, D., Le Traon, P.-Y., Cabanes, C., Gaillard, F., … Hamon, M. (2014). Consistency of the current global ocean observing systems from an Argo perspective. Ocean Science, 10(3), 547–557. https ://doi.org/10.5194/os-10-547-2014
Wiens, J. A., Stralberg, D., Jongsomjit, D., Howell, C. A., & Snyder, M. A. (2009). Niches, models, and climate change: Assessing the as-sumptions and uncertainties. Proceedings of the National Academy of
Sciences of the United States of America, 106(Supplement 2), 19729–
19736. https ://doi.org/10.1073/pnas.09016 39106
Wilson, R. P., Grémillet, D., Syder, J., Kierspel, M., Garthe, S., Weimerskirch, H., … Nel, D. (2002). Remote-sensing systems and seabirds: Their use, abuse and potential for measuring marine en-vironmental variables. Marine Ecology Progress Series, 228, 241–261. https ://doi.org/10.3354/meps2 28241
Wilson, R. P., & Vandenabeele, S. P. (2012). Technological innovation in archival tags used in seabird research. Marine Ecology Progress Series, 451, 245–262. https ://doi.org/10.3354/meps0 9608
Zilberman, N., & Roemmich, D. (2017). The Argo Program samples the deep ocean. US CLIVAR Variations, 2, 29–33.
SUPPORTING INFORMATION
Additional supporting information may be found online in the Supporting Information section.