The Role of Combined OSR and SDF Method for
Pre-Processing of Microarray Data That Accounts
for Effective Denoising and Quantification
Jayakishan Meher1, Mukesh Kumar Raval2, Pramod Kumar Meher3, Gananath Dash4
1
Department of Computer Science and Engineering, Vikash College of Engineering for Women, Bargarh,Odisha, India; 2Department of Chemistry, G. M. College, Sambalpur, Odisha, India; 3Department of Embedded Systems, Institute for Infocomm Research, Sin-gapore; 4Department of Physics, Sambalpur University, Odisha, India.
Email: [email protected], [email protected], [email protected], [email protected]
Received May 8th, 2011; revised June 3rd, 2011; accepted June 11th, 2011.
ABSTRACT
Microarray data is inherently noisy due to the noise contaminated from various sources during the preparation of mi-croarray slide and thus it greatly affects the accuracy of the gene expression. How to eliminate the effect of the noise constitutes a challenging problem in microarray analysis. Efficient denoising is often a necessary and the first step to be taken before the image data is analyzed to compensate for data corruption and for effective utilization for these data. Hence preprocessing of microarray image is an essential to eliminate the background noise in order to enhance the image quality and effective quantification. Existing denoising techniques based on transformed domain have been util-ized for microarray noise reduction with their own limitations. The objective of this paper is to introduce novel pre-processing techniques such as optimized spatial resolution (OSR) and spatial domain filtering (SDF) for reduction of noise from microarray data and reduction of error during quantification process for estimating the microarray spots accurately to determine expression level of genes. Besides combined optimized spatial resolution and spatial filtering is proposed and found improved denoising of microarray data with effective quantification of spots. The proposed method has been validated in microarray images of gene expression profiles of Myeloid Leukemia using Stanford Microarray Database with various quality measures such as signal to noise ratio, peak signal to noise ratio, image fidelity, struc-tural content, absolute average difference and correlation quality. It was observed by quantitative analysis that the proposed technique is more efficient for denoising the microarray image which enables to make it suitable for effective quantification.
Keywords:Denoising, Microarray, Pre-processing, Quantification, Spatial Domain Filtering, Optimized Spatial Resolution, Quality Measures
1. Introduction
It is well known that microarray technology can monitor thousand of DNA sequences in a high density array on a glass [1]. Each microscopic spot represents a single gene. This technology enables to measure the level of activity of thousands of genes simultaneously and thus monitor the whole genome on a single chip so that researchers can have a big picture of the interactions among those genes simultaneously. Hence it eliminates “One gene in one experiment” as in case of wet lab. For a microarray project, the image quantification makes the transition in the work flow from wet lab procedures to computational ones [2,3]. Different technologies are in use to design
microarrays, like microarrays of cDNA, oligonucleotides, Ink-jet/Bubble jet [4]. In the basic procedure for a mi-croarray experiment two mRNA samples are reverse- transcribed into cDNA, labeled using different fluores-cent dyes (e.g., the red fluoresfluores-cent dye Cy5 and the green fluorescent dye Cy3), then mixed and hybridized with the arrayed DNA sequences. After this competitive hybridi-zation, the slides are imaged using a scanner which makes fluorescence measurement for each dye. From the differential hybridization of the two samples, the relative abundance of the spotted DNA sequences can be as-sessed. The results of the microarray experiment are two 16-bit tagged image files, one for each fluorescent dye.
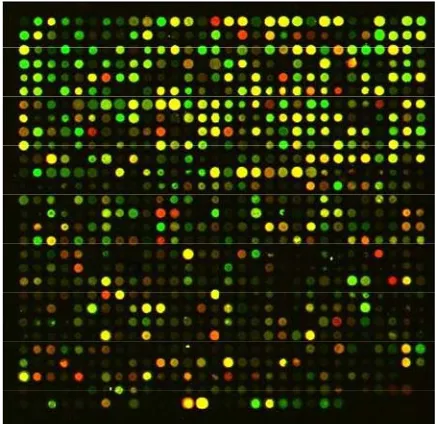
Figure 1. Microarrary image subarray of myeloid leukemia.
images ofMyeloid Leukemia. This technology is widely used by biologists in the analysis of disease classification, genome expression in cancer, other genetic diseases, vi-ral immunology and so on.
The microarray quantification process deals with ex-traction of spot intensity for each and every probe by estimating the intensity of foreground and background values to quantify the expression level of a particular gene. The images are usually supplied in pairs where one image shows the intensity of green dye and the other shows the intensity of a red dye. One of the couple of most commonly used quantification methods is histo-gram method, and the other based on pixel intensity [5-7]. Spot detection and quantification based on histogram method is comprised of three major steps: gridding, seg-mentation and intensity extraction. One of the major problems encountered in microarray image processing is due to the non-uniform spacing between the spots. Find-ing optimal grid is a time consumFind-ing process which re-quires human intervention. For automatic analysis of cDNA microarrays, a method using genetic algorithm approach was implemented to determine optimal grid-ding and spot segmentation [8]. Dapple has suggested an intelligent technique to determine the location of spots using morphological information which is robust to both variation and artifacts [9]. The authors in [10] present a fully automatic system for microarray image quantifica-tion, which locates both subarray grids and individual spots, without user identification of any image coordi-nates.
Microarray data is contaminated by noise during the preparation of slide.The analysis of the scanned images
is not straightforward process since the quality of mi-croarray images suffer due to noise, artifacts and uneven background. Without the utilization of a filter, subse-quent tasks such as spot identification and gene expres-sion determination cannot be completed.Discrete wave-let transform (DWT) has been used in image denoising. The denoising capabilities of DWT is demonstrated in [11] for removal of noise that is introduced during the preparation of microarray data. The stationary wavelet transform (SWT) was introduced in 1996 to make the wavelet decomposition time invariant [12]. A two-stage approach for noise removal that processes the additive and the multiplicative noise component is presented in [13]. The denoising capabilities of decimated and un-decimated multiwavelet transforms, DMWT and UMWT respectively are demonstrated in [14]. The image de-noising, with spatial filtering techniques as well as hard and soft thresholding of wavelet coefficients have been tested in microarray images in [15].
Microarray images consist mostly of low-intensity features that are not well distinguishable from the back-ground. These problems lead to errors that propagate to all the stages of statistical analysis. How to eliminate the effect of the noise constitutes a challenging problem in microarray analysis. Denoising the data is required for effective utilization for these data.Thus there is a need of developing new methods of denoising for upgradation of image quality. In this paper we present two novel pre-processing techniques, namely optimized spatial resolu-tion and spatial domain filtering to eliminate the noise in microarray that helps in more accurate estimation of the intensity of spots to determine the expression level. Spa-tial filtering is used for denoising of microarray image and spatial resolution optimization is used to enhance the image for accurate quantification of the spots. In order to improve the quantification result an integrated spatial domain filtering and optimized spatial resolution has been used.
The remainder of this paper is organized as follows. Section 2 presents the proposed preprocessing techniques of microarray image. This section presents the principles of optimized spatial resolution and spatial filtering and the combined approach. In Section 3 we have discussed the simulation result and performance analysis. Conclu-sion is drawn in Section 4.
2. Proposed Pre-processing Techniques of
Microarray Image
proposed methods for spatial domain filtering, spatial resolution optimization technique and an integrated ap-proach of the former two for preprocessing the microar-ray image for denoising and image enhancement.
2.1. Optimized Spatial Resolution
Spatial resolution is the density of pixels over the image. The greater the spatial resolution, the more pixels are used to display the image. The microarray image consists of large number of pixels. For evaluation of the gene expression data extensive computation is required be-cause of the fact that the number of spots is very large and the data within each spot is also substantial. It is found that pixel intensities of the microarray are ap-peared in a particular order in alternate rows. The spatial resolution can be optimized for the entire slide by select-ing optimal intensity of two consecutive rows without altering the size of the image in both red plane and green plane. In this process the red plane and green plane are separated from the microarray. Each plane is optimized by selecting the higher values of consecutive rows in red plane and smaller values of two consecutive rows of green plane. This property has been selected from the fact that the signal intensity is the ratio of red foreground intensity to the green foreground intensity as discussed in Section 3. Blue plane has no role on the signal estimation. Hence it is left untouched. These modified planes are restored in a new image resulting in optimized spatial resolution. This process results in enhanced image qual-ity and signal intensqual-ity.
The histogram plot (Figure 2) shows pixel intensity having higher magnitude of the effective modified reso lution as compared to that of original image. When the optimized image is postprocessed to quantify the spot intensity, it results better estimation of spot as compared to processing original raw image.
2.2. Spatial Domain Filtering
In spatial filtering approach, we move a rectangular mask of the order m × n over the given microarray image. This process creates a new image with gray values calculated by the Equation (1).
1 2 1 2
1 2 1 2
, ,
m n
s m t n
w s t p i s j t
(1)The mask of the order m × n represented as a matrix is called a filter. A linear filter can be implemented by mul-tiplying all the elements in the mask by corresponding elements in the area spanned by the filter mask and add-ing together all these products [16]. This process is re-peated for every pixel in the microarray image. For a 3 × 3 mask with mask values w(i,j) and that corresponding
0 0.2 0.4 0.6 0.8 1
0 200 400 600 800 1000
(a)
0 0.2 0.4 0.6 0.8 1
0 200 400 600 800 1000 1200
[image:3.595.349.492.96.320.2](b)
Figure 2. Histogram plot of (a) original image and (b) opti-mized image.
pixel values p(i,j) as shown in Figure 3, the new pixel value is computed by the Equation (2).
1 1
1 1
, ,
s t
w s t p i s j t
(2)The microarray image obtained by spatial filtering has higher intensity of signals and thus background noise is suppressed thereby improving the signal intensity. This results higher spot intensity in the quantification process. The intensity of the spot depends on the design of the mask. The mask representing lowpass Spatial filters based on neighbourhood pixels is denoted as averaging filter. A mask consisting neighborhood pixels of size 3 × 3 acts as linear filter. The average of all the nine values within the mask becomes the gray value of the corre-sponding pixel in the new microarray image. Each pixel is processed by its neighborhood pixels of mask 3 × 3 and the new pixel is obtained by
1 9
P a b c d e f g h i (3)
m(–1,–1) m(–1,0) m(–1,1) p(i–1,j–1) p(i–1,j) p(i–1,j+1)
m(0,–1) m(0,0) m(0,1) p(i,j–1) p(i,j) p(i,j+1)
m(1,–1) m(1,0) m(1,1) p(i+1,j–1) p(i+1,j) p(i+1,j+1)
(a) (b)
[image:3.595.310.537.586.702.2]
The process is continued for the whole image. The new image obtained is the denoised image. This is called lowpass spatial filter. Spot intensity is quantified ef-fecttively when this image is processed. 3 × 3 mask shows better result in compared to 5 × 5 mask and 3 × 5 mask. Allied to spatial filtering is spatial convolution. The method for performing a convolution is the same as that for filtering, except that the filter is rotated by 180˚ before multiplying and adding. Using the w(i,j) and p(i,j) notation, the output of a convolution with a 3 × 3 mask for a single pixel is given by Equation (4) or Equation (5).
1 1
1 1
, ,
s t
w s t p i s j t
(4)
1 1
1 1
, ,
s t
w s t p i s j t
(5)Here we have rotated the image pixels by 180˚; this does not affect the result. In practice, most filter masks are rotationally symmetric, so that spatial filtering and spatial convolution will produce the same output. Simi-larly a 3 × 3 Gaussian filter can effectively eliminate background noise and image blurring. Gaussian filter of mask 3 × 3 shows better result than 5 × 5 mask and 3 × 5 mask.
2.3. Combined OSR and SDF Approach
In this paper we have presented two new preprocessing methods such as the spatial domain filtering and the op-timized spatial resolution to deal with noise reduction in microarray image. Both the methods have advantages of denoising and image enhancement respectively. Spatial domain method is performed directly on the source im-ages. Optimization is the simplest spatial domain method, which needn’t any transformation or decomposition on the original images. The merit of this method is simple and fit for real-time processing, Now an integrated spa-tial domain filtering and optimized spaspa-tial resolution ap-proach is proposed on microarray images to combine the advantages of both that enables effective quantification.
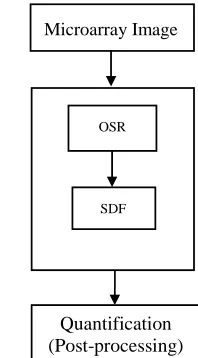
[image:4.595.368.467.94.273.2]The flow chart for integrated approach is shown in
Figure 4 that consists of cascaded OSR and SDF stages. The preprocessing stage encompasses procedures for optimizing the spatial resolution followed by spatial lowpass filtering. The combined process not only helps in denoising but also performs image enhancement re-sulting in high signal to noise ratio. The resultant image is now suitable for post processing. The post-processing entails computing the resulting image for estimation of spot intensity which follows three steps such as griding, segmentation and information extraction. It is found that the integrated approach shows much higher spot intensity
Microarray Image
OSR
SDF
Quantification (Post-processing)
Figure 4. Flow chart for combined approach.
compared to traditional methods as shown in Table 2.
3. Simulation Result and Performance
Analysis
An important pre-processing step in microarray image is to eliminate the noise.Extensive study has been made in eliminating noise and ensures better gene expression by estimating the spot intensity with the help of novel pro-posed pre-processing techniques on microarray image. The denoising methods have been evaluated in 34 mi-croarray images of gene expression profiles of Myeloid Leukemia using Stanford Microarray Database [17,18], each one containing 48 subarrays. The 1632 subarrays are selected for analysis. In most microarray images ex-tremely noisy background is met. In a good number of cases all the proposed methods performed well by elimi-nating the background noise. The denoising methods were implemented in Matlab computing environment.
The estimation of microarray spot is quantitatively analysed using quantification measures known as spot intensity (SI) or spot quality [5] which is given by
fg
I
I I I
bg
I fg bg
R R
F
S F B
B G
G (6)
estimated background intensity for the entire slide. Spot quality is the ratio of foreground to the background ratio. The Spot intensity is computed by several preprocessing techniques such as spatial domain filtering based on neighborhood mask processing, Gaussian mask, median filter, ordered filter, Wiener filter, frequency domain filter and wavelet transform filter on different microarray slides and found that the proposed integrated approach produces high spot intensity that results better gene ex-pression.
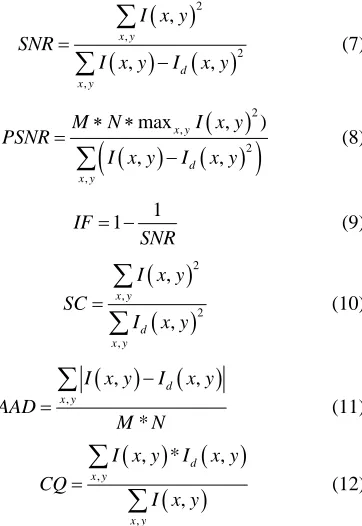
On the other hand, the quality assessment parameters that are used to evaluate the performance of noise reduc-tion by different methods employed in this paper are signal to noise ratio (SNR), peak signal to noise ratio (PSNR), image fidelity (IF), structural content (SC), ab-solute average difference (AAD) and Correlation Quality (CQ) [19] which are given by
2 , 2 , , , , x y d x yI x y SNR
I x y I x y
(7)
2 , 2 ,max , )
, ,
x y
d x y
M N I x y
PSNR
I x y I x y
(8)1 1 IF
SNR
(9)
2 , 2 , , , x y d x yI x y SC
I x y
(10)
, , , * d x yI x y I x y
AAD
M N
(11)
, , , * , , d x y x yI x y I x y CQ
I x y
(12)In general, higher SNR and PSNR are better; the signal is cleaner and indicates a smaller difference between the original and denoised image. If IF nears 1, we will obtain an image of better quality. Similarly if SC spread at 1, we will obtain image of better quality. A lower AAD gives a cleaner image as more noise is reduced. A larger value of
[image:5.595.105.286.305.568.2] [image:5.595.306.536.362.517.2]CQ usually corresponds to a better quantitative perform-ance. In this work, we have simulated all the proposed methods in Matlab 7.0 for preprocessing and postproc-essing operations.
Table 1 summarizes the quality assessment parameters for denoising methods on the microarray image. The
de-noising methods have been tested in microarray images of gene expression profiles of Myeloid Leukemia using Stanford Microarray Database. In Table 1 the mean val-ue of the parameters of the each method are shown esti-mated from the evaluation set of 408 subarrays. Table 2
summarizes spot intensity of one spot in sample mi-croarray subarray. It is found that the proposed spatial domain filtering based on neighborhood mask filtering and Gaussian mask filtering play vital role in reducing noise in microarray image and thus helps in quantifica-tion effectively. Further optimized spatial resoluquantifica-tion en-hances the image quality and thus improves the signal intensity. Hence the optimized image produces improved estimation of spot intensity when post-processed. Simu-lation result shows that the integrated optimized spatial resolution and spatial lowpass filtering produces much im- proved result than that has been done by raw image and other preprocessing methods. The quantitative results of
[image:5.595.312.536.547.720.2]Tables 1 and 2 show the optimum assessment parameters
Table 1. Simulation results on assessment parameters for denoising methods.
Denoising
Methods SNR PSNR IF AAD SC CQ
Gaussian
filter 62.12 34.87 0.98 0.02 1.02 77.65
Wiener filter 59.34 31.26 0.98 0.06 1.04 72.24
Median filter 36.23 25.73 0.95 1.004 1.01 72.16
Ordered
filter 3.78 15.24 0.75 15.52 0.565 78.64
Frequency
domain 6.25 17.22 0.79 3.19 0.99 53.25
OSR 68.08 38.54 0.98 0.02 1.07 79.38
Spatial LPF 69.37 39.53 0.99 0.007 1.09 80.01
Table 2. Estimation of spot intensity by different methods.
Preprocessing Methods Spot Intensity
Processing raw image 1.23
Frequency domain LPF 1.50
Gaussian mask 1.56
Median filter 1.54
Ordered filter 1.54
Wiener filter 1.55
Optimized spatial resolution (OSR) 1.58
Spatial LPF (neighbourhood mask) 1.59
for the proposed method. Thus the enhanced image qual-ity and improved denoising capabilqual-ity are observed espe-cially in integrated approach and hence it helps in quanti-fication effectively.
4. Conclusions
In this paper a new approach using integrated optimized spatial resolution and spatial domain filtering is pre-sented to deal with enhancement of image quality and re- duction of noise for effective quantification of microarray image. Results computed using proposed optimized spa-tial resolution and spaspa-tial lowpass filtering show im-proved interpretation in contrast to one derived from the raw data analysis and other preprocessing methods. Var-ious microarray images from Stanford Microarray Data-base were examined to validate the performance of our methods. Experimental results show that the proposed algorithm provides better performance than the other methods from quantitative analysis. The information ex-tracted on down and up regulation of genes under dis-eased condition can be further analyzed in pharmacoge-nomics for drug targeting and drug development for the disease.
REFERENCES
[1] T. K. Attwood and D. J. Parry-Smith, “Introduction to Bioinformatics,” Addison Wesley Longman Limited, Har- low, 1999.
[2] R. C. Y. Cheung and C. J. S. Desilva, “Analysis of Gene Microarray Image,” Neural Information Processing,
Pro-ceedings of ICONIP’99, 6th International Conference,
Perth, Vol. 2, November 1999, pp. 627-632.
[3] R. S. H. Istepanian, “Microarray Image Processing: Cur-rent Status & Future Directions,” IEEE Transactions on
NanoBioScience, Vol. 2, No. 4, December 2003, pp. 173-
175.
[4] J. Dopazo, “Microarray Data Processing and Analysis,” Kluwer Academic Publisher, Boston, 2002, pp. 43-63. [5] D. Vijayan and A. S. Nair, “Microarray Image Processing:
Spot Detection, Quantization and Clustering,” Center for
Bioinformatics, KU, March 2006.
[6] B. Alhadidi, H. N. Fakhouri and O. S. AlMousa, “cDNA Microarray Genome Image Processing Using Fixed Spot Position,” American Journal of Applied Sciences, Vol. 3, No. 2, 2006, pp. 1730-1734.
[7] S. H. Ni, P. Wang, et al., “Spotted cDNA Microarray Im-age Segmentation Using ACWE,” Romanian Journal of
Information Science and Technology, Vol. 12, No. 2, 2009,
p. 249.
[8] A. Sreedevi and D. S. angamashetti, “Automatically Lo-cating Spots in DNA Microarray Image Using Genetic Algorithm without Gridding,” IEEE IACSIT Spring
Con-ference, Singapore, 17-20 April 2009, pp. 178-181.
[9] J. Buhler, T. Ideker and D. Haynor, “Dapple: Improved Techniques for Finding Sports on DNA Microarrays,” Technical Reports UWTR2000-08-05,University of Wa- shington, 2000.
[10] A. N. Jain, T. A. Tokuyasu, A. M. Snijders, R. Segraves, D. G. Albertson and D. Pinkel1, “Fully Automatic Quantifi-cation of Microarray Image Data,” Genome Research, Vol. 12, No. 2, February 2002, pp. 325-332.
doi:10.1101/gr.210902
[11] T. Tokuyasu, D. Albertson, D. Pinkel and A. Jain, “Wa- velet Transforms for the Analysis of Microarray Experi-ments,” Proceedings of IEEE Computer Society
Bioin-formatics Conference, 11-14 August 2003, pp. 429-430.
[12] X. H. Wang, R. S. H. Istepanian and Y. H. Song, “Mi-croarray Image Enhancement by Denoising Using Sta-tionary Wavelet Transform,” Transactions on
Nanobio-science, Vol. 2, No. 4, December 2003, pp. 184-189.
[13] H. Stefanou1, T. Margaritis, D. Kafetzopoulos, K. Marias and P. Tsakalides, “Microarray Image Denoising Using a Two-Stage Multiresolution Technique,” IEEE
Interna-tional Conference on Bioinformatics and Biomedicine,
2007, pp. 383-389.
[14] A. Zifan, M. H. Moradi and S. Gharibzadeh, “Microarray Image Enhancement by Denoising Using Decimated and Undecimated Multiwavelet Transforms,” Signal, Image
and Video processing,Vol. 4, No. 2, 2009, pp. 177-185.
[15] A. Mastrogianni, E. Dermatas and A. Bezerianos, “Mi-croarray Image Denoising Using Spatial Filtering and Wavelet Transformation,” IFMBE Proceedings,Vol. 23, No. 1, 2009, pp. 594-597.
[16] R. C. Gonzalez, R. E. Wood and S. L. Eddins, “Digital Image Processing Using Matlab,”Pearson Education, Inc., Berkeley, 2004.
[17] J. Gollub, C. A. Ball, G. Binkley, et al., “The Stanford Microarray Database: Data Access and Quality Assess-ment Tools,” Nucleic Acids Research, Vol. 31, No. 1, 2003, pp. 94-96.
[18] C. A. Ball, I. A. B. Awad, J. Demeter, et al., “The Stanford Microarray Database Accommodates Additional Mi-croarray Platforms and Data Formats,” Nucleic Acids
Re-search, Vol. 33, Database Issue, 2005, pp. D580-D582.
[19] M. Mastriani and A. E. Giraldez, “Microarrays Denoising via Smoothing of Coefficients in Wavelet Domain,”
In-ternational Journal of Biomedical Sciences, Vol. 1, No. 1,