ISSN Online: 2158-2750 ISSN Print: 2158-2742
Quantifying and Validating Soybean Seed
Emergence Model as a Function of
Temperature
Firas Ahmed Alsajri
1, Chathurika Wijewardana
1, L. Jason Krutz
2, J. Trenton Irby
1,
Bobby Golden
3, K. Raja Reddy
1*1Department of Plant and Soil Sciences, Mississippi State University, Mississippi State, MS, USA 2Mississippi Water Resources Research Institute, Mississippi State University, Mississippi State, MS, USA 3Delta Research and Extension Center, Stoneville, MS, USA
Abstract
Developing a model for soybean seed emergence offers a tool producers could use for planting date options and in predicting seedling emergence. In this study, temperature effects on soybean seed emergence were quantified, mod-eled, and validated. The data for seed emergence model development was generated at varying temperatures, 20˚C/12˚C, 25˚C/17˚C, 30˚C/22˚C, 35˚C/27˚C, and 40˚C/32˚C, on two soybean cultivars, Asgrow AG5332 and Progeny P 5333 RY. Time for 50% emergence (t50%) was recorded, and seed emergence rate (SER) was estimated as reciprocal to time at each temperature in both the cultivars. No differences were observed between the cultivars in their response to temperature. A quadratic model (QM) best described the relationship between t50% and SGR and temperature (R2 = 0.93). Two sets of
experiments were conducted to validate the model. In Experiment 1, 17 time-series planting date studies with the same cultivars were used by utiliz-ing diurnal and seasonal changes in temperature conditions. In the second experiment, sunlit growth chambers with 3 different day/night temperatures, low—20˚C/12˚C, optimum—30˚C/22˚C, and high—40˚C/32˚C, and 64 soy-bean cultivars belonging MG III, IV, and V, were used. Air temperature and t50 were recorded, and SGR was estimated in all experiments. No differences were recorded among the cultivars for t50% and SGR, but differences were observed among seeding date and temperature experiments. We tested QM and traditionally used Growing Degree Days models against the data col-lected in validation experiments. Both the model simulations predictions agreed closely with the observed data. Based on model statistics, R2, root
mean square errors (RMSE), and comparison of observations and predictions
How to cite this paper: Alsajri, F.A., Wi-jewardana, C., Krutz, L.J., Irby, J.T., Gol-den, B. and Reddy, K.R. (2019) Quantifying and Validating Soybean Seed Emergence Model as a Function of Temperature. American Journal of Plant Sciences, 10, 111-124.
https://doi.org/10.4236/ajps.2019.101010
Received: December 20, 2018 Accepted: January 15, 2019 Published: January 18, 2019
Copyright © 2019 by author(s) and Scientific Research Publishing Inc. This work is licensed under the Creative Commons Attribution International License (CC BY 4.0).
http://creativecommons.org/licenses/by/4.0/ Open Access
to assess model performance, the QM model performed better than the GDD model for soybean seed emergence under a wide range of cultivars and envi-ronmental conditions.
Keywords
Growing Degree Days Model, Seed Emergence, Soybean, Temperature
1. Introduction
Soybean (Glycine max [L.] Merr) seed germination and emergence are impor-tant components of the crops cycle as uniform stand establishment have been documented to have a positive correlation with in-season crop growth and de-velopment and final yield [1]-[8]. Seed emergence is, therefore, a critical stage that ends with dependence on stored reserves and starts an autotrophic life with the production of chloroplast in the developing organs aboveground. Many field applications have widely used soybean phenology staging system developed by Fehr et al.[9]. This system defined soybean emergence when cotyledons unfold and appear above the soil surface. The timing of emergence frequently deter-mines whether a single plant competes successfully with its neighbors and other predators and weeds. With many significant plant processes and management at stake, a full understanding and documenting of seed emergence process seems necessary. Surprisingly, soybean emergence has not been fully addressed, partic-ularly in many recent cultivars even though some work has been carried in ear-lier cultivars [10] [11] [12].
Several environmental factors, temperature, soil moisture, and soil physical characteristics, and seed quality traits influence seed emergence in plants [13]. Among the abiotic stress factors, temperature plays a dominant role in control-ling growth and developmental rates of plants under optimum water and nu-trient conditions including seed germination and emergence. There are major differences among plant species in their sensitivities to temperature. Even culti-vars or hybrids vary in their sensitivity to temperature [14] [15]. In a crop pro-duction system, temperature varies spatially and temporally over the growing season. Each crop event or individual developmental aspect has a specific tem-perature optimum, and above that optimum, plant development will be declined. The mechanisms and sensitivities of this process to environmental stimuli vary among plant processes and sometimes among cultivars.
Castiel [16] proposed Growing Degree Days Model (GDD) in predicting soy-bean seed emergence with a base temperature of 50˚F (10˚C) and the growing degree days required for seed emergence to be 90 from 50˚F (32.22 GDD’s from 10˚C). The base temperature varies among various developmental rates within a plant species [17] and for a given developmental time among plant species [18]
because of its simplicity, GDD models were used to predict crop developmental rates. However, many of the crop developmental rates are not always respond to
temperature linearly, other models such as quadratic models (QM) [18] [19]
have been introduced in describing crop developmental responses to tempera-ture. The merit of using a QM in predicting crop developmental rates eliminates some of the issues related to the methods of calculation of GDD as described by McMaster and Wilhelm [20].
In soybean, Hatfield and Egli [11] showed that time to reach 5-mm hypocotyl length decreased with temperature from 10˚C to 32˚C and then increased 33˚C to 40˚C. They also stated that the radicle did not emerge from seed coat at 40˚C. Functional relationships between temperature and seed emergence on improved cultivars of soybean that are currently grown are limited to develop a model. The objectives of this study were to determine temperature effects on seed emergence response of modern soybean cultivars, develop a temperature-dependent seed emergence model, and validate the model from the data collected across a wide range of environmental conditions, planting dates, and cultivars.
2. Material and Methods
2.1. Database for Modeling Experiment
2.1.1. Experimental FacilitiesAn experiment was conducted using sunlit plant growth chambers known as Soil-Plant-Atmosphere-Research (SPAR) units located at the Rodney Foil Plant Science Research Center, Mississippi State University, Mississippi State, MS, in 2014. Five SPAR units were used in this experiment. The SPAR units can pre-cisely control air temperatures and chamber carbon dioxide concentration at predetermined set points at near ambient levels of solar radiation. Each SPAR unit consists of a steel soil bin with 1 m deep by 2 m long and 0.5 m wide that houses either rooting medium or pots and a Plexiglas chamber with 2.5 m tall by 2 m long × 1.5 m wide that houses aerial plant system. The Plexiglas chamber is connected to a heating and cooling system and fan connected to air ducts that pass conditioned air through the plant canopy at the rate to simulate the field-level leaf flutter. The environmental monitoring and control systems are supporting the SPAR units by a network to store the data and provide automatic acquisition of data at 10 s intervals throughout the day and night. More details about the operations and controls of SPAR chambers have been described by Reddy et al. [21]. During the experiment, the daily solar radiation from 285 - 2800 nm, outside the SPAR units, was recorded using pyranometer (Model 4-8; The Eppley Laboratory Inc., Newport, RI) and ranged from 17 to 28 MJ∙m−2∙d−1
with an average of 21 MJ∙m−2∙d−1 (Table 1). To eliminate the need for border
plants, variable density shade cloths that were designed to simulate canopy spec-tral properties placed around the edges of the plant canopy were raised regularly to reach canopy height.
In the returning path of airline ducts, a humidity and temperature sensor (HMV 70Y, Vaisala Inc., San Jose, CA) was installed to monitor the relative hu-midity (RH) of each chamber, From these measurements, the vapor pressure deficits (VPD) in the units were estimated as per Murray [22] (Table 1). For the
Table 1. The set of Temperature treatments, average day, night, and day/night tempera-ture, the mean of daily measured chamber CO2 concentration, and vapor pressure deficit (VPD) during the experimental period, 11 days after planting and treatments, for various temperature treatments conducted in the Soil-Plant-Atmosphere-Research units located at Mississippi State, MS.
Day/night temperature treatments, ˚C
Temperature, ˚C CO2
concentration, µmol mol−1
Mean daily VPD, kPa
Day Night Day/night
20/12 20.21†e 12.65e 16.94e 419a 0.55e
25/17 25.05d 17.20d 21.64d 419a 1.19d
30/22 29.28c 21.64c 25.97c 420a 1.49c
35/27 34.15b 26.52b 30.83b 421a 2.67b
40/32 38.67a 31.03a 35.36a 421a 3.68a
†Values in each column followed by the same letter are not significantly different (P ≤ 0.05) according to Fisher’s LSD.
duration of the treatment period, evapotranspiration rats (ET) was monitored and expressed on a ground area basis (L∙d–1) for each SPAR unit. The ET was
calculated as the rate at which condensate was removed by the cooling coils at 900 s intervals by measuring the volume of water in collecting devices connected to a calibrated pressure transducer (Table 1; [23]).
2.1.2. Plant Materials and Temperature Treatments
Two soybean cultivars, Asgrow AG 5332 (AG) with indeterminate and Progeny P5333 RY (PR) with determinate growth habits, from Maturity Group V were used for this experiment. Four seed were planted in 90 PVC (polyvinyl chloride) plastic pots (15.2 cm diameter and 30.5 cm height) at 1.5 - 2 cm soil depth. Pots were filled with topsoil: sand (1:3 by volume) medium classified as a sandy loam (87% sand, 2% clay, and 11% silt) with 0.5 kg gravel at the bottom. Each pot had a hole (0.5 cm diameter) at the bottom to allow the drainage of extra water and nutrients. The plants were irrigated and fertilized with full-strength Hoagland nutrient solution [24] by an automated drip irrigation system delivered three times a day at 0700, 1200, and 1700 h. Each SPAR was assigned to 1 temperature treatment, 18 pots, nine pots for each cultivar, arranged in six rows, three pots per row in a completely randomized design with a 5 × 2 factorial arrangement.
Five day/night temperature treatments, 20˚C/12˚C, 25˚C/17˚C, 30˚C/22˚C, 35˚C/27˚C, and 40˚C/32˚C, imposed from seeding were maintained within ±0.5˚C of the treatment set points measured with aspirated thermocouples (Table 1). The daytime temperature was initiated at sunrise and returned to the nighttime temperature one h after sunset. The chamber [CO2] was measured and
maintained at 420 µmol∙mol−1 with a dedicated infrared gas analyzer (LI-COR,
Model LI-6552, Lincoln, NE) from a gas sample that was drawn through the lines underground from each SPAR unit to the inside the laboratory. Pure CO2
was supplied from a compressed gas cylinder through a system that included a pressure regulator, solenoid and needle valves and a calibrated flow meter to
maintain chamber [CO2] at desired set points [20]. To remove moisture from
the gas sample, the sample lines were run through refrigerated water (4˚C) that was automatically drained and through a column of Mg (ClO4)2. The
environ-mental data for mean daytime CO2 concentrations, which were not significantly
different among the temperature treatments, were 420 µmol∙mol−1 for the
expe-rimental period (Table 1).
2.1.3. Measurements and Data Analysis
Four seed per pot were sown and time for 50% emergence (t50%) was recorded when the two cotyledons appear above the soil surface in each pot as described by Fehr et al. [9]. Seed emergence rate (SER) was calculated as a reciprocal to t50%. The data were subjected to analysis of variance [25] with completely ran-domized design considering cultivars and temperature treatments as sources of variance. Replicated values for seed emergence data were analyzed using one-way ANOVA of the general linear model, PROC GLM, in SAS [25] to de-termine the effect of temperature on the measured parameters. Data were tested for differences among the treatments for the parameters measured using Fisher’s protected least significant difference test at P ≤ 0.05 and the standard errors of the means were calculated. To determine the best-fit equations between temper-ature and seed germination parameters, R2 was used. Graphical analysis was
car-ried out using SigmaPlot 13.0 (Systat Software Inc., San Jose, CA).
2.2. Validation Experiments
2.2.1. Outdoor Experiment Facility and Cultivars
A series of short-term pot-culture experiments were conducted in outdoor con-ditions from 24 March to 22 July 2015 to generate data needed to validate the model. The same two cultivars, AG and PR that used in the first experiment were used in these experiments. The cultural aspects including soil and nutrient con-ditions were similar to those described in Experiment I. Five pots were used for each cultivar as replications. Four seed were seeded in each pot. The air temper-ature was recorded using a WatchDog sensor (B100, Spectrum Technologies, Inc., Plainfield, IL). The seed emergence, t50%, as defined in Experiment 1, was rec-orded in all pots and treatments and SER was estimated from those measurements.
2.2.2. Sunlit Controlled Environment Experiment and Cultivars
This experiment was conducted in the SPAR units with similar management and cultural practices as described in Experiment I. In this experiment, we evaluated 64 soybean cultivars belonging to MG III, IV, and V that are commonly grown in the US Midsouth under three different day/night temperature treatments, low—20˚C/12˚C, optimum—30˚C/22˚C, and high—40˚C/32˚C. The experiment was organized in a completely randomized design with two-factor interactions, three levels of temperature × 64 cultivars, replicated three times such that each cultivar and temperature treatment appeared in each SPAR unit once, whereas replications represented as nine different SPAR units. Treated seeds of those 64 soybean cultivars were sown in 576 PVC plastic pots (0.1 m diameter and 0.45 m
tall), each filled with sandy soil and 0.250 kg of gravel at the bottom. The tem-perature treatments were imposed soon after sowing and continued until 20 days after sowing.
Four seed were seeded in each pot, and t50% was recorded in each pot. Then, SER was calculated as described earlier. Two-way analysis (ANOVA) was per-formed on the replicated values of the measured parameters using the PROC GLM procedure in SAS [25] to determine the effect of temperature, cultivar, and their interaction. Post ANOVA means comparison was made using the least sig-nificant difference (LSD = 0.05). Models performance statistics were carried out as described by Loague and Green [26], Mitchell and Sheehy [27] Reddy et al.
[28] and Reddy and Bonne [29].
3. Result and Discussions
3.1. Quantifying and Modeling the Effect of Temperature on Seed
Emergence
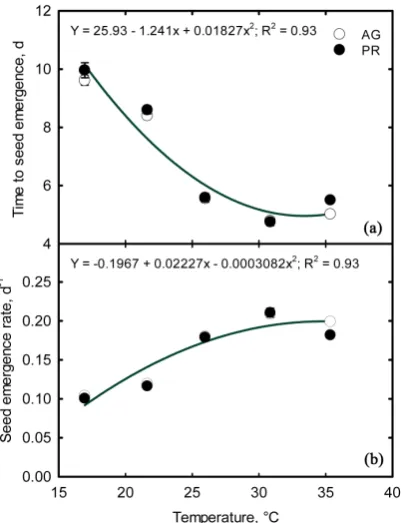
[image:6.595.274.475.417.679.2]The range of temperatures imposed in this study to generate the data needed for developing the relationships between temperature and t50% and SGR represented the temperature variability of the current and projected future cli-matic conditions across global Soybean Belt. The analysis of variance revealed no significant differences between the two cultivars, for the parameters recorded, t50% and SGR (Table 2). Therefore, quadratic functions best described the rela-tionship between temperature and t50% and SER for the pooled data (Figure 1).
Figure 1. Temperature effects on soybean (a) time for 50% of seed emergence (t50%) and (b) seed emergence rate (SER). Each data point is mean of nine replications, and standard errors are shown if the values are larger than the symbols.
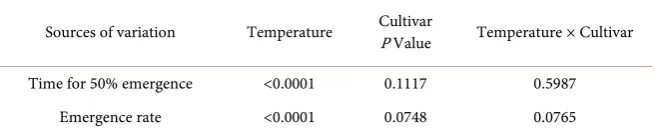
Table 2. Analysis of variation across temperatures, cultivars, and their interaction with soybean time for 50% seed emergence and emergence rate.
Sources of variation Temperature Cultivar P Value Temperature × Cultivar
Time for 50% emergence <0.0001 0.1117 0.5987
Emergence rate <0.0001 0.0748 0.0765
Days to 50% seed emergence, t50%, decreased with an increase in temperature and the SER increased with increase in temperature. The estimated temperature minimum for SGR was 10.6˚C, and the optimum was 36.67˚C. At the optimum temperature, it took five days to reach t50% whereas at the lowest temperature imposed in this experiment (~16˚C), it took almost double that time, 10.8 days (Figure 1). Similar quadratic responses were observed for cotton in response air and soil temperatures [14] and soybean in response to soil temperature [11]. Even though the estimated minimum temperature from this study was similar to the reported values [11], the optimum temperature observed in this study was higher by 5°C than the previous study. This could be due to improved heat to-lerance in the recently released cultivars. [16] proposed Growing Degree Days Model (GDD) in predicting seed emergence in soybean with a base temperature of 50˚F (10˚C) and the growing degree days required for seed emergence was 90 GDDs from 50˚F (32.22 GDD’s from 10˚C).
3.2. Validation Experiments
There were no differences between the cultivars for t50% seed emergence and SGR for a given seeding date (Table 3). However, differences for t50% and SER were observed among seeding dates, as temperature conditions were different for each of those experimental periods in the first validation experiment. The temperatures ranged from 17.37˚C to 31.9˚C and which contributed to the ob-served variation in t50% that ranged from 10.4 to 4.0 days for those temperature conditions, respectively.
In the second validation experiment with 64 cultivars from MG III, IV, and V, t50% and SER varied among the temperatures (Table 4). Cultivars did not differ within a given temperature treatment. On average, the soybean cultivars took 9.6 days at 20˚C/12˚C, 5.3 days at 30˚C/22˚C, and 4.3 days at 40˚C/32˚C (Table 4).
3.3. Model Comparisons
The quadratic model developed in this study for the relationship between tem-perature and soybean seed emergence was compared with the published GDD model [16]. The performance of the models for SER was tested on 17-time series experiments sown outdoors with the same cultivars used in model development and a sunlit controlled environment experiment with three different day/night temperature treatments with 64 cultivars [27]. First, we used regression parame-ters, R2, slopes, and intercepts, and mean sum square errors (MMSE) of the
Table 3. Time for 50% emergence and emergence rate of two soybean cultivars, Asgrow AG5332 (AG) and Progeny P5332 RY (PR) seeded at different periods with sowing dates.
Panting date temperature, ˚C Average air Time to 50% emergence, d Seed emergence rate, d
−1
AG PR AG PR
24 March 17.37 10.4 10.5 0.10 0.10
30 March 19.84 8.1 8.4 0.12 0.12
04 April 19.58 8.4 8.5 0.12 0.12
10 April 21.27 6.2 6.7 0.16 0.15
23 April 22.83 7.4 7.5 0.14 0.13
30 April 24.35 6.1 6.2 0.17 0.16
10 May 24.79 6.2 5.9 0.16 0.17
20 May 25.07 6.4 6.4 0.16 0.16
30 May 24.81 6.2 6.4 0.16 0.16
12 June 30.39 5.0 5.3 0.20 0.19
18 June 31.9 4.0 4.3 0.25 0.24
23 June 30.51 4.3 4.7 0.24 0.22
29 June 27.71 5.1 5.3 0.20 0.19
04 July 28.74 4.3 4.6 0.23 0.22
09 July 28.82 4.1 4.2 0.24 0.24
14 July 29.62 5.2 5.3 0.19 0.19
22 July 28.61 4.4 4.3 0.23 0.23
Temperature
P value <0.0001 <0.0001
Cultivars 0.0725 0.4221
Table 4. Soybean cultivars, Maturity Group (MG) and time for 50% seed emergence (t50%) and seed emergence rate (SER) for 64 soybean cultivars grown at low (LT—20˚C/12˚C), optimum (OT—30˚C/22˚C), and high (HT—40˚C/32˚C) temperature conditions.
Company Cultivar Maturity group
Time for 50%
emergence (t50%), days Seed emergence rate, d−1
LT OT HT LT OT HT
Dyna-Gro Seed 32y39 III 10.3 5.3 4.3 0.10 0.19 0.23 Mycogen Seeds 5N393R2 III 8.7 5.3 4.3 0.12 0.19 0.23 Syngenta United States S39-T3 III 10.7 5.3 4.0 0.09 0.19 0.25 Syngenta United States S39-C4 III 9.3 5.3 4.7 0.11 0.19 0.21 REV Brand Seeds 38 R10 III 8.7 5.0 4.3 0.12 0.20 0.23
Go Soy Genetics
Optimized IREANE IV 9.0 6.0 4.3 0.11 0.17 0.23
Go Soy Genetics
Optimized 483C IV 8.7 5.3 5.0 0.12 0.19 0.20
[image:8.595.206.539.530.740.2]Continued
UniSouth Genetics Inc. ELLIS IV 9.0 5.0 4.3 0.11 0.20 0.23 REV Brand Seeds 48L63 IV 10.0 5.3 4.7 0.10 0.19 0.21
Delta Grow
Seeds Com. Inc. DG4781LL IV 9.3 5.7 4.7 0.11 0.18 0.21 Go Soy Genetics
Optimized 4714LL IV 9.3 5.0 5.0 0.11 0.20 0.20
Progeny Ag Products P 4247 LL IV 9.7 5.0 4.3 0.10 0.20 0.23 Bayer Credenz CZ 4044 LL IV 10.0 5.3 4.0 0.10 0.19 0.25 Dyna-Gro Seeds S49LL34 IV 8.7 5.3 4.0 0.12 0.19 0.25 DoPont Pioneer P41T33R IV 9.3 5.3 4.0 0.11 0.19 0.25 Delta Grow Seeds
Com. Inc. DG 4680RR2 IV 9.3 5.3 4.0 0.11 0.19 0.25 REV Brand Seeds 45A46 IV 10.3 5.7 4.3 0.10 0.18 0.23 Mycogen Seeds 5N424R2 IV 10.0 5.0 4.7 0.10 0.20 0.21 Dyna-Gro Seed 31RY45 IV 10.7 5.3 4.0 0.09 0.19 0.25 AGSouth Genetics GS45R216 IV 9.3 5.7 4.0 0.11 0.18 0.25
Asgrow AG4632 IV 10.0 5.3 4.3 0.10 0.19 0.23
Progeny Ag Products P 4588RY IV 9.7 5.3 4.0 0.10 0.19 0.25 Syngenta United States S45-W9 IV 9.3 5.3 4.0 0.11 0.19 0.25 Bayer Credenz CZ 4181 RY IV 8.7 5.7 4.0 0.12 0.18 0.25 Delta Grow Seed
Com. Inc. DG 4825RR2/STS IV 9.0 5.3 4.7 0.11 0.19 0.21 DuPont Pioneer P47T36R IV 9.7 5.0 4.3 0.10 0.20 0.23 Syngenta United States S47-K5 IV 9.3 5.3 4.3 0.11 0.19 0.23 AGSouth Genetics GS47R216 IV 9.3 5.3 4.0 0.11 0.19 0.25
Armor Seeds AR4705 IV 10.3 6.0 4.7 0.10 0.17 0.21
Mycogen Seed 5N490R2 IV 9.7 5.3 4.3 0.10 0.19 0.23
REV Brand Seeds 48A26 IV 10.3 5.7 4.0 0.10 0.18 0.25 Progeny Ag Products P 4757 RY IV 10.0 5.3 4.3 0.10 0.19 0.23 Dyna-Gro Seeds S48RS53 IV 9.7 5.3 4.7 0.10 0.19 0.21 Go Soy Genetics
Optimized 4814GTS IV 9.7 5.0 4.3 0.10 0.20 0.23
Croplan Win Field
United R2C4775 IV 10.3 5.7 4.0 0.10 0.18 0.25
Bayer Credenz CZ 4898 RY IV 9.7 5.3 4.3 0.10 0.19 0.23
Dixie Belle DB 4911 IV 8.3 5.3 4.0 0.12 0.19 0.25
Great Heart Seed Com. GT-476CR2 IV 10.3 5.3 4.0 0.10 0.19 0.25
Continued
NC State University PI 471938 IV 10.3 5.0 4.0 0.10 0.20 0.25 University of Missouri R01-416F IV 9.7 5.0 4.0 0.10 0.20 0.25
Asgrow AG5332 V 9.7 5.7 4.3 0.10 0.18 0.23
Progeny P 5333 RY V 9.3 5.0 4.7 0.11 0.20 0.21
USDA-ARS JTN-5110 V 9.0 5.0 4.3 0.11 0.20 0.23
GoSoy Genetics
Optimized LELAND V 9.7 5.7 4.7 0.10 0.18 0.21
Delta Grow
Seeds Com. Inc. DG 5067 LL V 9.7 5.3 4.3 0.10 0.19 0.23
Go Soy Genetics
Optimized 5115LL V 9.3 5.3 4.7 0.11 0.19 0.21
Dyna-Gro Seed S55LS75 V 9.7 5.7 4.3 0.10 0.18 0.23
Bayer Credenz CZ 5242 LL V 9.0 5.7 4.3 0.11 0.18 0.23
Bayer Credenz CZ 5225 LL V 10.7 5.0 4.0 0.09 0.20 0.25
Delta Grow Seeds
Com. Inc. DG 5170 RR2/STS V 10.7 5.3 4.0 0.09 0.19 0.25
REV Brand Seeds 51A56 V 9.7 5.0 4.3 0.10 0.20 0.23
DuPont Pioneer P52T50R V 9.3 5.3 4.0 0.11 0.19 0.25
Syngenta United States S55-Q3 V 9.3 5.3 4.3 0.11 0.19 0.23
Syngenta United States S56-M8 V 8.7 5.3 4.0 0.12 0.19 0.25
Go Soy Genetics
Optimized 5214GTS V 10.3 5.3 4.3 0.10 0.19 0.23
Armor 55-R68 V 9.3 5.0 4.0 0.11 0.20 0.25
Progeny Ag Products P 5226 RYS V 8.7 5.7 5.0 0.12 0.18 0.20
Mycogen Seeds 5N523R2 V 9.7 6.0 4.7 0.10 0.17 0.21
Dyna-Gro Seed S56RY84 V 10.7 5.3 4.3 0.09 0.19 0.23
Croplan Win Field
United R2C5225S V 9.3 5.0 4.3 0.11 0.20 0.23
Bayer Credenz CZ 5375 RY V 9.7 5.7 4.3 0.10 0.18 0.23
REV Brand Seeds 57R21 V 10.0 5.3 4.7 0.10 0.19 0.21
Syngenta United States S58-Z4 V 9.7 5.0 4.0 0.10 0.20 0.25
Dyna-Gro Seed S57RY26 V 9.7 5.3 4.0 0.10 0.19 0.25
Mean 9.6 5.3 4.3 0.10 0.19 0.23
Temperature
P Value <0.0001 <0.0001
Cultivars 0.0613 0.5887
models of observed and predicted seed emergence data to test the performance of the models. The model with R2 and slope values closer to one, intercept values
closer to zero, and the lowest MMSE values were considered the better model in predicting seed emergence rate in soybean. For MMSE, the following steps were used to estimate the values.
The mean of the sum of square error (MMSE):
(
)
2DIF= Observed predicted− (1)
(
)
MDIF= ΣDIF ni (2)
(
)
MMSE= ΣMDIF ni (3)
where DIF is the difference between observed and predicted values, MDIF is the mean DIF, and ni is the number of observations in the validation experiment.
Based on this, the model with the smallest MMSE was considered as the best model. This was necessary because the different experimental conditions were sampled on different validation experiments. Based on these model validation metrics, the QM performed slightly better the GDD model for soybean seed emergence over a wide range of environmental conditions, planting dates, and cultivars. Both the models, however, have higher R2 when regressed between
ob-served and predicted days for seed emergence (Figure 2).
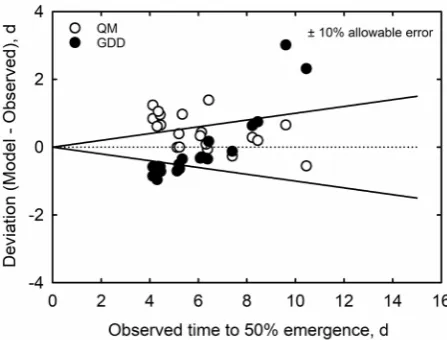
Since evaluations of the accuracy of models with observed data is not always straightforward [26] [27] [28] [29], we used an alternative method for deter-mining model accuracy proposed by Loague et al.[26] known as “Envelop of Acceptable Precision (EAP)” and the portion of points (Deviations of the model from observed values) that are within a predetermined allowable error. Figure 3
[image:11.595.278.468.538.680.2]illustrates the scatter plot of deviations set to ±10% of the observed values of t50% for both models. With a predetermined allowable error of ±10% of the ob-served value for t50%, the envelopes of acceptable precision defined by the straight lines originating from the plots of these positive and negative points (Figure 3), 60% of predicted values of the quadratic model were within the 10% envelop compared to 40% for the GDD.
Figure 2. Comparison of observed and simulated days to time to 50% seed emergence (t50%) of the growing degree day (GDD) and quadratic (QM) models for soybean seed emergence across a wide range of genetic, experimental, and environmental conditions.
Figure 3. The plot of deviations of observed values of quadratic (QM) and growing de-gree day (GDD) models for soybean time for 50% seed emergence.
4. Summary and Conclusions
Soybean seed emergence rate increased with increase in temperature. There were no cultivar differences for SER at a set temperature conditions. A quadratic model best described the relationship between temperature and soybean seed emergence rate. Based on this model, the estimated base and optimum tempera-tures for soybean seed emergence were 10.6˚C and 36.7˚C, respectively. The QM presented in this study performed better than the GDD model for seed emer-gence rate across a wide range of environmental conditions and among several cultivars belonging to soybean maturity Groups III to V. The QM reduced the overall variability by 58% and improved model performance by 10% over the GDD model in predicting SGR across a wide range of experimental and envi-ronmental conditions, planting dates, and cultivars. The temperature-SER de-pendent functional relationship could improve the functionality of many soy-bean models (FAO, AQUACROP, DSSAT, APSIM, and MONICA; [30] [31]), for field management, and in policy applications. Also, QM for SER has been used in a soybean blog so that the producers could use this model in predicting seedling emergence under optimal moisture conditions under a wide geograph-ical area and sowing dates [32]. However, other factors such as soil moisture, oxygen, flooding, and seed depth, are needed to be able to predict soybean seed emergence more accurately.
Acknowledgements
We thank David Brand for technical assistance and graduate students of the En-vironmental Plant Physiology Lab at Mississippi State University for their sup-port during data collection. This article is a contribution from the Department of Plant and Soil Sciences, Mississippi State University, Mississippi Agricultural, and Forestry Experiment Station. This research was partially funded by the Mis-sissippi Soybean Promotion Board and National Institute of Food and Agricul-ture, NIFA and 2016-34263-25763 and MIS 043040.
Conflicts of Interest
The authors declare no conflicts of interest regarding the publication of this pa-per.
References
[1] Brandelero, E.M., Adami, P.F., Modolo, A.J., Baesso, M.M. and Fabian, A.J. (2015) Seeder Performance under Different Speeds and Its Relation to Soybean Cultivars Yield. Journal of Agronomy, 14, 139-145. https://doi.org/10.3923/ja.2015.139.145
[2] Dias, M.A.N., Pinto, T.L.F., Mondo, V.H.V., Cicero, S.M. and Pedrini, L.G. (2011) Direct Effects of Soybean Seed Vigor on Weed Competition. Journal of Seed Science, 33, 346-351.
[3] Egli, D.B. (1993) Relationship of Uniformity of Soybean Seedling Emergence to Yield. Journal of Seed Technology, 17, 22-28. http://www.jstor.org/stable/23432764
[4] Kolchinski, E.M., Schuch, L.O.B. and Peske, S.T. (2006) Early Growth of Soybean Plants in Relation to Seeds Vigor. Revista Brasileira de Agrociência, 12, 163-166. [5] Kolchinski, E.M., Schuch, L.O.B. and Peske, S.T. (2005) Seeds Vigor and
In-tra-Specific Competition in Soybean. Ciência Rural, 35, 1248-1256.
https://doi.org/10.1590/S0103-84782005000600004
[6] Mondo, V.H.V., Dias, M.A.N., Cicero, S.M. (2015) Maize Seed Vigor and Its Effects on Crop Cultivation Cycle. Revista de Agricultura, 90, 168-178.
[7] Schuch, L.O.B., Kolchinski, E.M. and Finatto, J.A. (2009) Seed Physiological Quality and Individual Plants Performance in Soybean. Journal of Seed Science, 31,144-149. [8] Vanzolini, S., Carvalho, N.M. (2002) Effects of Soybean Seed Vigor on Field Plant
Performance. Journal of Seed Science, 24, 33-41.
[9] Fehr, W.R., Caviness, C.E. Burmood, D.T. and Pennington, J.S. (1971) Stage of De-velopment Descriptions for Soybeans, Glycine max (l.) Merrill. Crop Science, 111, 929-931. https://doi.org/10.2135/cropsci1971.0011183X001100060051x
[10] Edwards Jr., C.J. and Hartwig, E.E. (1971) Effect of Seed Size upon Rate of Germi-nation in Soybeans. Agronomy Journal, 63, 449-450.
https://doi.org/10.2134/agronj1971.00021962006300030024x
[11] Hatfield, J.L. and Egli, D.B. (1974) Effect of Temperature on the Rate of Soybean Hypocotyl Elongation and Field Emergence. Crop Science, 14, 423-426.
https://doi.org/10.2135/cropsci1974.0011183X001400030025x
[12] Hopper, N.W., Overholt, J.R. and Martin, J.R. (1979) Effect of Cultivar, Tempera-ture and Seed Size on the Germination and Emergence of Soya Beans (Glycine max (L.) Merr.). Annals of Botany, 44, 301-308.
https://doi.org/10.1093/oxfordjournals.aob.a085733
[13] Benjamin, L.R. (1990) Variation in Time of Seedling Emergence within Populations: A Feature That Determines Individual Growth and Development. Advances in Agronomy, 44, 1-25.https://doi.org/10.1016/S0065-2113(08)60816-0
[14] Reddy, K.R., Brand, D., Wijewardana, C. and Gao, W. (2017) Temperature Effects on Cotton Seedling Emergence, Growth, and Development. Agronomy Journal, 109, 1379-1387.https://doi.org/10.2134/agronj2016.07.0439
[15] Wijewardana, C., Hock, M., Henry, B. and Reddy, K.R. (2015) Screening Corn Hy-brids for Cold Tolerance Using Morphological Traits for Early-Season Seeding. Crop Science, 55, 851-867.https://doi.org/10.2135/cropsci2014.07.0487
[16] Castiel, S. (2010) Soybean Physiology: How Well Do You Know Soybeans? Purdue
University. Soybean Station. http://www.soybeanstation.org
[17] Wang, J.Y. (1960) A Critique of the Heat Unit Approach to Plant Response Studies. Ecology, 41, 785-790.https://doi.org/10.2307/1931815
[18] Reddy, K.R., Hodges, H.F. and McKinion, J.M. (1993) A Temperature Model for Cotton Phenology. Biotronics, 22, 47-59.
[19] Reddy, K.R., Hodges, H.F. and McKinion, J.M. (1997) Crop Modeling and Applica-tions: A Cotton Example. Advances in Agronomy, 59, 225-290.
https://doi.org/10.1016/S0065-2113(08)60056-5
[20] McMaster, G.S. and Wilhelm, W.W. (1997) Growing Degree-Days: One Equation, Two Interpretations. Agricultural and Forest Meteorology, 87, 291-300.
https://doi.org/10.1016/S0168-1923(97)00027-0
[21] Reddy, K.R., Hodges, H.F., Read, J.J., McKinion, J.M., Baker, J.T., Tarpley, L. and Reddy, V.R. (2001) Soil-Plant-Atmosphere-Research (SPAR) Facility: A Tool for Plant Research and Modeling. Biotronics, 30, 27-50.
[22] Murray, F.W. (1967) On the Computation of Saturation Vapor Pressure. Journal of Applied Meteorology, 6, 203-204.
https://doi.org/10.1175/1520-0450(1967)006<0203:OTCOSV>2.0.CO;2
[23] McKinion, J.M. and Hodges, H.F. (1985) Automated System for Measurement of Evapotranspiration from Closed Environmental Growth Chambers. Transactions of the ASAE, 28, 1825-1828.https://doi.org/10.13031/2013.32526
[24] Hoagland, D.R. and Arnon, D.I. (1950) The Water-Culture Method for Growing Plants without Soil. The College of Agriculture University of California, Berkeley. [25] SAS Institute (2011) SAS Guide to Macro Processing. Vol. 11, SAS Inst., Cary. [26] Loague, K. and Green, R.E. (1991) Statistical and Graphical Methods for Evaluating
Solute Transport Models: Overview and Applications. Journal of Contaminant Hy-drology, 7, 51-73.https://doi.org/10.1016/0169-7722(91)90038-3
[27] Mitchell, P.L. and Sheehy, J.E. (1997) Comparison of Predictions and Observations to Assess Model Performance: A Method of Empirical Validation. In: Kropff, M.J., Teng, P.S., Aggarwal, P.K., Bouma, J., Bouman, B.A.M., Jones, K.W. and van Laar, H.H., Eds., Applications of Systems Approaches at the Field Level System to Cotton Crop Management, Volume 2, Kluwer Academic Publishers, Dordrecht, 55-65.
https://doi.org/10.1007/978-94-017-0754-1_31
[28] Reddy, K.R., Boone, M.L., Reddy, A.R., Hodges, H.E., Turner, S.B. and McKinion, J.M. (1995) Developing and Validating a Model for a Plant Growth Regulator. Agronomy Journal, 87, 1100-1105.
https://doi.org/10.2134/agronj1995.00021962008700060011x
[29] Reddy, K.R. and Boone, M.L. (2002) Modeling and Validating Cotton Leaf Area Development and Stem Elongation.Acta Horticulturae, 593, 193-199.
https://doi.org/10.17660/ActaHortic.2002.593.25
[30] Battisti, R.A., Paulo, C., Sentelhas, A. and Boote, K.J. (2017) Inter-Comparison of Performance of Soybean Crop Simulation Models and Their Ensemble in Southern Brazil. Field Crops Research, 200, 28-37.https://doi.org/10.1016/j.fcr.2016.10.004
[31] Acock, B., Pachepsky, Y.A., Mironenko, E.V., Whisler, F.D. and Reddy, V.R. (1999) GUICS: A Generic User Interface for On-Farm Crop Simulations. Agronomy Jour-nal, 91, 657-665.https://doi.org/10.2134/agronj1999.914657x
[32] Heatherly, L. (2015) Temperature and Soybean Emergence. Mississippi Soybean Promotion Board (MSPB) Blog.
https://mssoy.org/blog/temperature-and-soybean-emergence