http://dx.doi.org/10.4236/ojms.2012.21005 Published Online January 2012 (http://www.SciRP.org/journal/ojms)
Size Dependent Competition in Centric Diatoms as a
Function of Nitrogen and Silicon Availability
Paul D. van Ruth1,2, Jian G. Qin1, Alan J. Branford3
1
School of Biological Sciences, Flinders University, Adelaide, Australia
2
South Australian Research and Development Institute (Aquatic Sciences), Adelaide, Australia
3
School of Computer Science, Engineering and Mathematics, Flinders University, Adelaide, Australia Email: [email protected]
Received October 12, 2011; revised December 1, 2011; accepted December 10, 2011
ABSTRACT
Size dependent competition was examined in two marine centric diatoms, Coscinodiscus sp. and Thalassiosira rotula at
various 4, 3 and Si concentrations. The growth responses for both species to nutrient levels were evaluated
using two forms of nitrogen (NH4 and NO3) and silicon in both monoculture and mixed culture conditions. Under single
species culture, the impact of Si did not depend on N forms for both diatoms. The increase of NH4-N enhanced the
growth of Coscinodiscus, but did not affect T. rotula. When NO3-N was the nitrogen source, cell densities of both spe-
cies were significantly enhanced by increasing Si concentrations, but only T. rotula density was affected by increasing N concentration. When Coscinodiscus sp. and T. rotula grew in the same culture, Coscinodiscus sp. dominated in both N forms. The scale of the dominance of Coscinodiscus sp. over T. rotula increased with decreasing N and Si concentra-
tions. In the competition experiment, when 4
NH NO
NH was the N source, both Coscinodiscus sp. and T. rotula were signifi- cantly affected by changes in N concentration, but only T. rotula was affected by Si. When NO3 was the N source, nei-
ther Coscinodiscus sp. nor T. rotula was affected by Si, but T. rotula was enhanced by N levels. Regardless the N form, the impact of Si on neither Coscinodiscus sp. nor T. rotula depended on N concentration. Our results indicate that large diatom species have a competitive advantage over small species, and both large and small species were sensitive to NH4-N limitation, but the small species was more sensitive to NO3-N limitation than the large species.
Keywords: Diatoms; Size-Dependence; Nutrient Competition; Nitrogen; Silica
1. Introduction
The paradox of plankton refers to the apparent immunity of natural phytoplankton assemblages to the principle of competitive exclusion [1]. Within natural assemblages, many species of phytoplankton are able to co-exist despi- te competing for relatively few limiting resources [2]. Previous studies in this area of ecology have focussed on the needs of phytoplankton in general by examining the competitive interactions occurring between phytoplank- ton in different taxonomic divisions [3-5]. To date, how- ever, there has been little study of the interactions that occur within phytoplankton species that have similar re- source requirements but directly compete for limiting re- sources. In the case of diatoms, all species require Si for growth and survival [6], but a non-limiting supply of Si alone appears to be insufficient to ensure the survival of diatom species. To adequately compete for Si, diatoms may require sufficient N for the formation of Si trans-porters [7,8].
Previous studies concerning competition for nutrients in diatoms have focussed on a single nutrient uptake rate
for N [5,9,10], or for Si [8,11,12]. There have been few studies to simultaneously evaluate competition for both Si and N. This study attempted to understand the popula- tion dynamics of marine diatoms by examining Si and N competition in two centric diatoms of different sizes.
Diatoms will dominate phytoplankton assemblages in the presence of a sufficient supply of Si with a Si:N ratio > 25:1 [4]. There has been much investigation in the past on the role of Si in regulating the outcome of competition within phytoplankton communities. However, little is kno- wn about the influence of silicon supply on nitrogen ac- quisition in diatoms of different size. Si is an important nutrient for diatoms in frustule formation [13]. Without a sufficient supply of Si, frustule formation is retarded, and diatoms are unable to grow and reproduce [8].
When competing for as the limiting N source,
the ability to take up and store excess for later use would constitute an immense competitive advantage, allo- wing larger algal species to more efficiently compete for
under fluctuating conditions. In a study on uptake in diatoms, Stolte and Riegman [14] observed that
– 3
NO
– 3
NO
– 3
larger cells were able to take up at a higher rate for a longer period of time than small cells. Thus, the a- bility to store gives algal species with larger vacuo- les a competitive advantage when competing for as the limiting N source under fluctuating nitrate supply.
The difficulty in storing 4
– 3
NO
– 3
NO
– 3
NO
NH gives the uptake rate,
rather than the cell size, more importance in competition for a limiting source of this nutrient [5]. Hence the spe-cies with the highest uptake rate will dominate when
competing for 4 as the N source [15].
The objective of this study was to examine the possi- ble influence of nitrogen source and silicon availability on competition for nitrogen between two species of ma- rine diatom. The competitive interactions between a large and a small species of centric diatoms were evaluated when different levels of Si and different forms N were presented to the algae.
NH
– 3
NO
2. Methods
2.1. Culture Conditions
Two centric diatoms, Coscinodiscus sp. (strain CS-342)
and Thalassiosira rotula were used in this study, and were obtained from the CSIRO collection, Hobart, Aus- tralia. There were two reasons for choosing these two species. Firstly, both species were collected from Jervis Bay, NSW in 1995, and were grown at the CSIRO in si- milar culture conditions to those proposed for use in this study (in f/2 medium at 17.5˚C). Thus any lag phase in growth was minimised when the specimens were cul- tured for this experiment. The second reason was their morphology and their size relative to each other. Cosci- nodiscus sp., (100 m ± 2.3 m in diameter, 35 m ± 0.9 m thick) is much larger than T. rotula (20 m ± 1.3 m in diameter, 13 m ± 0.7 m thick). To minimise any lag phase in growth that may have occurred when the species were exposed to the different N sources, specimens were
grown in both and NH4
as N sources. Cultures of
each species for the experiments with as the sole N
source were grown in f/2 medium enriched with Si ac- cording to the CSIRO modification of the method of [16].
Cultures for the experiments with 4 as the sole N
source grown in enriched f/2 with N provided by NH4Cl.
Prior to experimentation, cultures were maintained sepa- rately at 17˚C - 20˚C under fluorescent light (12:12 h light:dark). All experimental work was conducted using 250 ml polypropylene bottles, since diatoms have been reported to etch Si directly from glassware [7].
– 3
NO
NH
2.2. Growth Response of a Single Species to Changes in N and Si Concentrations
Two experiments were conducted on each species in monoculture to examine the effect of limited supplies of Si and N on algal growth. These experiments were de-
signed to test the growth of Coscinodiscus sp. or T. ro- tula under various N and Si concentrations, and to con- firm that each species could survive by itself in all treat- ment conditions, thus ensuring that any detrimental gro- wth was due to competition, rather than conditions in the treatment that were unsuitable for growth. A 3 × 3 facto- rial experiment was used and each species was tested under three N levels of either NH4-N or NO3-N and three
Si levels. Nutrient concentrations were achieved by ma- nipulating the amount of N and Si in the f/2 medium to provide different percentages of the full f/2 nutrient con- centrations. The nutrient treatments included 0% N, 50% N and 100% N, each of which was prepared with 0% Si (0 µM), 25% Si (142 µM) and 100% Si (562 µM). Thus, three Si levels were prepared at each N level, providing nine treatment combinations, with three replicates per combination. The response of each species to these trea-
tment combinations was examined firstly with as
the sole N source at three concentrations (0, 605 and 1210
µM ), then again using as the sole N source at
three levels (0, 28 and 56 µM ).
– 3
NO
– 3
NO NH4
NH4
Each culture vessel used for the monoculture experi-ments contained 160 ml of media inoculated with 40 ml of either Coscinodiscus sp. or T. rotula, with a cell den- sity of 100 ± 15 cells per ml. Vessels were thoroughly swirled twice daily to re-suspend cells, and were main- tained at constant temperature (22˚C ± 1˚C). A volume of 60 ml of culture was replaced with fresh medium once a day (semicontinuous culture), giving a dilution rate of 0.3 d–1, which is an acceptable approximation of steady state algal growth [3,4]. Light was provided by fluores-cent tubes (12:12 h light:dark). Cell numbers were mea- sured for each species every 2 - 3 d using a palmer count- ing chamber and a light microscope at 100× magnifica- tion. The number of cells present in 100 l of suspension taken from a 1 ml sample was estimated from the avera- ge of two separate counts.
2.3. Competition between Coscinodiscus Sp. and T. rotula for N
Coscinodiscus sp. and T. rotula were used to examine co- mpetition for N with different N forms, and different levels of nitrogen and silicon. A 3 × 3 factorial experi-ment was conducted including three N levels and three Si levels. Nutrient concentrations were achieved by manipu- lating the amount of N and Si in the f/2 medium to pro- vide different percentages of each nutrient, and were identical to those used in the monoculture experiments. Thus, nine combinations of N and Si were again used wi- th three replicates. The competition response of each spe- cies to each nutrient combination was examined firstly
with – as the sole N source, then again using
3
NO NH4
Each vessel used for the competition experiment
con-tained 120 ml media with 40 ml of Coscinodiscus sp.
cells, and 40 ml of T. rotula cells, each with a density of
100 cells·ml–1 ± 18 cells·ml–1. Vessels were swirled
twice daily to resuspend cells, and were maintained at constant temperature (22˚C ± 1˚C). A volume of 60 ml of culture was replaced with fresh medium once a day, to
give a dilution rate of 0.3 d–1. Light was provided by
fluorescent tubes (12:12 h light:dark). The impact of competition was measured directly by removing a 1ml sample from each flask and counting species numbers using a palmer counting chamber and a light microscope at 100× magni- fication.
2.4. Statistical Analysis
SPSS statistical analysis software was used for all statis- tical tests. The effect of the different treatment combina- tions on cell numbers was examined for both the mono- culture and mixed culture experiments via an analysis of variance using the derived variables method [17]. The results for each replicate within the treatment were avera- ged over time, providing a derived variable that was in- dicative of the overall effect of the different treatments on cell densities over the experimental period. Univariate ANOVAs were performed on derived data from the mo- noculture experiments, since the cell densities of the se- parated species were the single dependent variables in each experiment. When the two species were combined for the competition study, the cell densities of both spe- cies were dependent variables, requiring the use of a mul- tivariate analysis of variance. Bonferroni post-hoc multi- ple comparisons were used to further examine the treat- ment effects detected in the ANOVAs. Assumptions of normality and homoscedasticity were examined prior to all statistical tests. All data were natural log transformed. In the competition experiment, a t-test was used to detect the competitive outcome between the two diatoms. The difference between the two species densities at the final time point was calculated for each treatment level, and then tested against zero. A significance level of 0.05 was used for all tests.
3. Results
3.1. Growth Response of a Single Species to Changes in N and Si Levels
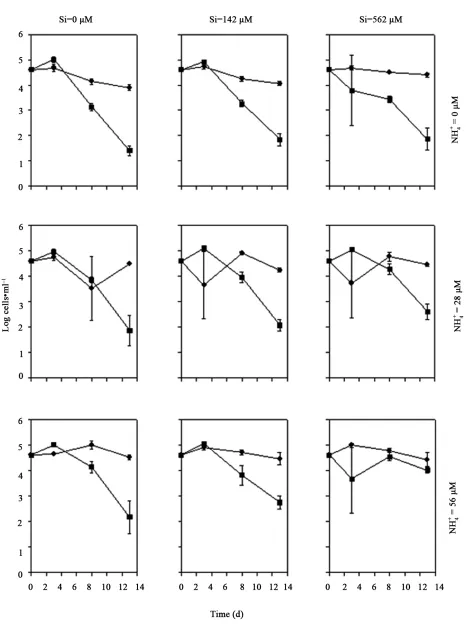
When grown in 4 as the N source, Coscinodiscus sp.
abundance remained relatively constant throughout the cou- rse of the experiment in all treatments (Figure 1). The
exception was the zero 4 treatment, where the abun-
dance declined by approximately 30% over time. Cosci-
nodiscus sp. was significantly affected by changes in
4 level (P < 0.001, Table 1), with the abundance
increasing across all treatments. Post-hoc tests re-
vealed that cell density in zero concentration was si-
gnificantly lower than in 28 µM 4 and 56 µM 4
NH
NH
4
NH NH
4
NH
NH NH
treatments (P = 0.001). There was no significant differ-
rence between cell densities in the 28 µM NH4
and 56
µM NH4
[image:3.595.309.536.165.430.2]treatments (P > 0.40). Cell densities of T. rotula decreased by approximately 50% for all treatment
Figure 1. Growth of Coscinodiscus sp. (left) and Thalassio- sira rotula (right) in monoculture over time, with three Si and three NH4
levels: Nil (●), 28 µM (■), and 56 µM (▲).
Values are mean SE (n = 3). Error bars are shown only when larger than the size of the symbol.
Table 1. Univariate ANOVA results for the effects of NH4
and Si, and NO3
and Si on the cell densities of
Coscino-discus sp. and Thalassiosira rotula in monoculture.
Coscinodiscus sp. Thalassiosira rotula
Source df MS F P MS F P
4
NH 2 0.792 41.094 0.001 0.180 3.370 0.06
Si 2 0.006 0.311 0.74 0.017 0.319 0.73
4
NH× Si 4 0.013 0.687 0.61 0.021 0.389 0.81
Error 18 0.019 0.053
Total 26
– 3
NO 2 0.039 2.492 0.11 0.261 6.907 0.01
Si 2 0.29 18.666 0.001 0.154 4.082 0.04
– 3
NO × Si 4 0.007 0.473 0.76 0.016 0.423 0.79
Error 18 0.016 0.038
[image:3.595.307.538.548.736.2]combinations over the duration of the study. No signify- cant difference in T. rotula cell densities was detected between 4 treatments (P > 0.06). The cell densities of
Coscinodiscus sp. and T. rotula were not significantly
affected by Si concentration when 4 was the N sou-
rce (P > 0.73). The impact of 4 on population abun-
dance did not depend on Si concentration for both Cos-
cinodiscus sp. (P = 0.61) and T. rotula (P = 0.81).
NH
NH
NH
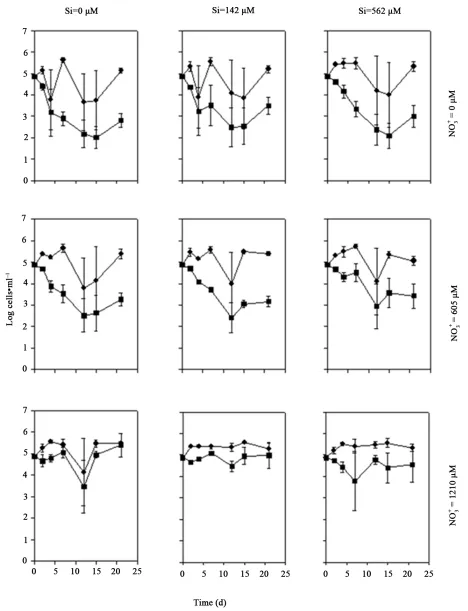
When was the N source, Coscinodiscus sp. den-
sities remained relatively unchanged for all treatment co- mbinations over time. However, an initial decline in the cell density for both species was observed in all treat- ments (Figure 2). No significant difference in Coscino- discus sp. density was detected between treat- ments (P = 0.11, Table 1), but cell densities were sig-
nificantly enhanced by increasing Si concentration (P = 0.001). Post-hoc tests showed cell densities in the zero Si treatment were significantly lower than densities ob- served in the 142 µM Si and 562 µM Si treatments (P < 0.001). There was no detectable difference between the
142 µM Si and 562 µM Si treatments (P = 0.99). Cell
densities of T. rotula also remained relatively unchanged for the duration of the monoculture experiment, with an initial decline 3 - 5 d after the experiment began, though not as obvious as Coscinodiscus sp. (Figure 2). Changes
in both and Si concentration had a significant e-
ffect on T. rotula cell density when was the N sou-
rce (P = 0.01 and P = 0.04, respectively; Table 1). Cell
densities increased with increasing and Si concen-
trations (Figure 2). Post-hoc test showed that cell num-
bers in the zero treatment were not significantly
lower than those in the 605 µM treatment (P =
0.09), but were significantly lower than those in the1210
µM treatment (P = 0.005). Cell densities in the
605 µM treatment were not significantly different
from those observed in the1210 µM treatment (P
= 0.65). Thalassiosira rotula densities in the zero Si
treatment were not significantly different from those in the 142 µM Si treatment (P > 0.05), but were lower than
densities in the 562 µM Si treatment (P = 0.04). There
was no significant difference in cell numbers between the
142 µM Si and 562 µM Si treatments (P = 0.99). No in-
teractions between and Si were observed for ei-
ther species (P > 0.76).
– 3
NO
– 3
NO
– 3
– 3
NO
– 3
NO
– 3
NO
– 3
NO
– 3
NO
NO
– 3
NO
NO NO
– 3
– 3
3.2. Competition between Two Algal Species for N
When grown in the same culture, Coscinodiscus sp. do-
minated T. rotula in low N and Si concentrations (Fi-
gures 3-4). When 4-N was the N source, Coscino-
discus sp. density was significantly greater than the cell density of T. rotula by the end of the experimental period
in all treatment levels except the 56 µM 4 and 562
µM Si treatment (P = 0.39; Table 2, Figure 3). However,
as the Si concentration decreased, T. rotula initially do- minated for the first 3 days - 4 days before Coscinodiscus
sp. became dominant. This initial dominance of T. rotula
occurred in the nil Si and 142 µM Si treatments for all
4
NH
NH
NH treatments and was also the case in the 28 µM NH4
and 562 µM Si treatments (Figure 3). When was
the N source, the cell density of Coscinodiscus sp. was significantly greater than the cell density of T. rotula at the end of the experiment in all treatment levels except
the 1210 µM treatments (P > 0.49; Table 2, Fi-
gure 4). The scale of the dominance of Coscinodiscus sp.
over T. rotula increased with decreasing and Si
concentrations.
– 3
NO
– 3
NO
– 3
NO
The outcome of competition between Coscinodiscus
sp. and T. rotula for N differed for each N source. Cos- cinodiscus sp. was significantly affected by changes in
4
NH concentration, with numbers increasing across all
4
NH levels (P = 0.001; Table 3, Figure 3). Post-hoc
tests revealed that cell densities in the zero NH4
treat- ment were significantly lower than those observed in the
28 µM NH4
and 56 µM 4 treatments (P = 0.001).
No significant difference in cell densities was detected between the 28 µM
NH
4
NH and 56 µM 4 treatments
NH
Figure 2. Growth of Coscinodiscus sp. (left) and Thalas-siosira rotula (right) in monoculture over time, with three Si and three NO3 levels: Nil (●), 605 µM (■), and 1210 µM (▲).
Figure 3. The effect of increasing concentration on the cell densities of Coscinodiscus sp. (●) and Thalassiosira rotula (■) over time in different Si concentrations. Values are mean SE (n = 3). Error bars are shown only when larger than the size of the symbol.
4
Figure 4. The effect of increasing concentration on the cell densities of Coscinodiscus sp. (●) and Thalassiosira rotula (■) over time in different Si concentrations. Values are mean SE (n = 3). Error bars are shown only when larger than the size of the symbol.
3
Table 2. Comparisons between Coscinodiscus sp. and Tha-lassiosira rotula abundances at different NH4-N (Nil, Low =
28 µM, and High = 56 µm), NO3-N (Nil, Low = 605 µm, and
High = 1210 µM) and Si (Nil, Low = 142 µM, and High =
562 µM) combinations.
(P = 0.99). Coscinodiscus sp. cell densities were not sig-
4
NH-N was the N source (P = 0.13; Table 3, Figure 3).
In contrast to Coscinodiscus sp., T. rotula densities in all treatment combinations decreased by approximately 50% over the course of the experiment, with the exception of
the 56 µM NH4
and 562 µM Si combinations in which numbers declined by approximately 10% (Figure 3). Chan- ges in NH4
concentration had a significant impact on T. rotula cell numbers (P = 0.002; Table 3). Thalassiosira rotula abundance increased with increasing NH4+ con-
centration (Figure 3). Post-hoc tests revealed that cell densities in the nil NH4
treatment were significantly
lower than those in the 28 µM 4 treatment (P =
0.02), and the 56 µM 4
NH
NH treatment (P = 0.001). No significant difference in cell densities was detected bet-
ween the 28 µM NH4
and the 56 µM 4 treatments
(P = 0.71). Cell densities of T. rotula were also signify-
cantly enhanced by increasing Si concentrations (P =
0.03; Table 3, Figure 3). Post-hoc tests revealed that no significant difference in cell numbers was detected be-
tween the nil Si and 142 µM Si treatments (P = 0.99).
However, cell numbers in the zero Si treatment were sig- nificantly lower than those observed in the 562 µM Si treatments (P = 0.04). There was no significant differen- ce in cell densities between the 142 µM Si and 562 µM Si treatments (P = 0.10). Interactions between 4
NH
NH and
Si levels were not detected for either species (P > 0.74).
Treatment comparisons T df P
NH4-N and Si combinations
NilNH4 vs Nil Si
10.37 2 0.01
NilNH4 vs Low Si
7.25 2 0.02
NilNH4 vs High Si
6.93 2 0.02
LowNH4 vs Nil Si
4.53 2 0.05
LowNH4 vs Low Si
7.13 2 0.02
LowNH4 vs High Si
5.83 2 0.03
HighNH4 vs Nil Si
4.22 2 0.05
HighNH4 vs Low Si
4.27 2 0.05
HighNH4 vs High Si
1.09 2 0.39
NO3-N and Si combinations
Nil NO3-N vs Nil Si 7.75 2 0.02
Nil NO3-N vs Low Si 3.01 2 0.09
Nil NO3-Nvs High Si 7.35 2 0.02
Low NO3-N vs Nil Si 24.49 2 0.002
Low NO3-N vs Low Si 7.11 2 0.02
Low NO3-N vs High Si 2.65 2 0.10
High NO3-N vs Nil Si 0.16 2 0.89
High NO3-N vs Low Si 0.46 2 0.69
High NO3-N vs High Si 0.84 2 0.49
When examining as the N source, Coscinodis-
cus sp. densities declined for all treatments from day 7 to day 12 of the experiment (Figure 4), before returning to
initial levels. When competing for as the N source,
Coscinodiscus sp. densities were not significantly im-
pacted by changes in either (P = 0.63) or Si con-
centration (P = 0.77). However, the numbers of T. rotula
were significantly impacted by changes in con-
centration (P = 0.001, Figure 4). Post-hoc tests showed
that cell densities in the zero treatments were not
significantly different to those observed in the 605 µM treatments (P = 0.99), but were significantly lower
than the cell densities in the 1210 µM treatments
(P = 0.001). Cell densities in the 605 µM treat-
ment were significantly lower than densities observed in
the 1210 µM treatments (P = 0.001). Changes in
Si concentration had no significant effect on T. rotula
cell densities (P = 0.97; Table 3). Interactions between
and Si were not observed for Coscinodiscus sp. (P
= 0.84) or T. rotula (P = 0.41; Table 3).
– 3
NO
– 3
NO
– 3 – 3
NO
NO
– 3
NO
– 3
NO
– 3
NO
– 3
NO
– 3
NO
– 3
NO
Table 3. Multivariate ANOVA results for the effects of and Si, and and Si on the cell densities of Cos- cinodiscus sp. and Thalassiosira rotula in competition.
4
NH
3
NO
Coscinodiscus sp. Thalassiosira rotula
Source df MS F P MS F P
4
NH 2 0.183 21.681 0.001 0.089 9.531 0.002
Si 2 0.020 2.310 0.13 0.040 4.324 0.03
4
NH× Si 4 0.004 0.496 0.74 0.004 0.411 0.80
Error 18 0.008 0.009
Total 26
– 3
NO 2 0.016 0.469 0.63 1.681 22.080 0.001
Si 2 0.009 0.272 0.77 0.003 0.035 0.97
– 3
NO × Si 4 0.012 0.358 0.84 0.081 1.059 0.41
Error 18 0.035 0.076
Total 26
4. Discussion
4.1. Single Species Responses to Changes in N and Si Levels
In monoculture, the impact of NH4-N on algal abundance
tion significantly enhanced the abundance of the large species, but did not significantly affect the small species. While still able to survive initially in 4, both Cosci-
nodiscus sp. and T. rotula did not increase in abundance
over the duration of the experiment when 4
NH
NH was the
N source. Indeed, the T. rotula density decreased over
the experimental period. Since 4 is difficult to store,
and is assimilated more quickly than it can be taken up [15], cells of both Coscinodiscus sp. and T. rotula may
not be able to satisfy N requirements with 4
NH
NH alone.
Coscinodiscus sp. was significantly affected by changes in NH4 concentration, with cell densities in the nil 4
NH
treatment lower than those in the other treatments, and no difference in cell density between the 28 µM and 56 µM
4 treatments. At zero 4
NH NH, no N can be gained from
the medium, and cells must rely on N stores to ensure their survival. This would result in slow cell division as algal cells usually reduce reproduction to reduce metabo- lism of stored N when the ambient nutrients are low [18].
Thalassiosira rotula was not significantly affected by
changes in 4 concentration, but cell densities decrea-
sed over the experimental period when 4 was the N
source, a phenomenon observed previously in other dia- toms by Stolte et al. [15]. This decrease may be due to the exhaustion of supplies of stored N in the smaller T. rotula cells.
NH
NH
Compared with NH4-N, NO3-N concentration signifi-
cantly enhanced the small species, but not the large spe-
cies. When was used as the N source, there was no
change in Coscinodiscus sp. cell densities over the dura-
tion of the experiment, even in the zero concen-
tration, which suggests that Coscinodiscus sp. is still able to survive on stored N after three weeks without an N su- pply. Sommer [19] reported that in times of N shortage, algal cells could utilize stored N to sustain survival. In the present study, the absence of a significant difference
in cell densities between the 0 µM and 1210 µM
concentrations suggests that total N stores had not yet reduced to a level in Coscinodiscus sp. cells where a slowing of metabolism was necessary. In contrast to Cos- cinodiscus sp., T. rotula densities were significantly af-
fected by changes in concentration. The cell den-
sities of T. rotula in the zero level were signifi-
cantly lower than densities in 1210 µM , but cell
densities did not significantly decrease over the course of the experiment, suggesting that a reduction in cell me- tabolism and division may be a strategy for algal cells to adapt to low N [20]. By slowing metabolism when no N is available in the culture medium, cells of T. rotula may
be able to prolong survival by using stored [18].
The resulting reduction in cell division may account for
the significantly lower cell densities in zero when
compared to 1210 µM .
– 3
NO
– 3
NO
– 3
NO
NO
NO
– 3
NO
– 3 –
3
NO
– 3
NO
– 3
NO NO
– 3 – 3
A change in Si concentration had no significant effect
on cell densities of either Coscinodiscus sp. or T. rotula
when NH4
was the N source. When grown in the
cells did not appear to be limited by the 142 µM Si treatment, since densities were not significantly different to those observed in the 562 µM Si treatment. However,
cell densities of Coscinodiscus sp. were significantly
lower in the absence of a Si supply. The cells were una- ble to get any Si from the medium when the Si concen- tration was zero, thus conditions were not suitable for regular growth, and cell densities were significantly low- er than treatments where Si was available. However, when
grown in without Si, Coscinodiscus sp. cell den-
sities did not decrease over the duration of the experi- ment. There are two possible explanations for this result. Firstly, the cells could redirect Si usage to ensure their survival in the shortage of Si supply [21]. In addition to its requirement for frustule formation, diatoms need Si for DNA, protein and chlorophyll synthesis, and the pro- duction of thymidilate kinase and DNA-polymerase [13]. Without sufficient Si for these necessities, normal cellu- lar function would cease. The survival strategies to limi- ted Si supplies include changes in frustule valve morpho- logy [22] and frustule thickness [23]. These responses require less Si for frustule formation, which leaves it available for other cellular requirements, thereby prolon- ging the life of the cell. In this study, however, no Si was available in the zero Si treatment. For Coscinodiscus sp. cells to survive in the environment without an external Si supply they might obtain Si from internal storage. Binder and Chisholm [13] reported the internal formation of Si pools in Si limited diatom populations, which could pro- long the life of the cell if coupled with a slowing of the cell cycle. However, prior to exposure to the Si concen- trations in this study, Coscinodiscus sp. cells were not Si limited, and thus any Si stored before the experiment was not stored as a survival response. The second possible explanation involves bacterial digestion of the frustule. Bidle and Azam [24] suggested that bacterially mediated Si regeneration could be achieved via the hastening of diatom frustule dissolution by marine bacteria. Thus it may be possible for diatoms to obtain a Si supply through ba- cterially mediated recycling in the absence of Si in the
environment. A decrease in Coscinodiscus sp. densities
was observed in all concentrations on the third day
of the monoculture experiment. The dead cells re-
sulting from this decrease might have provided a Si sup-
ply for the remaining Coscinodiscus sp. population if
bacteria present in the non-axenic cultures were accelera- ting the dissolution of the unoccupied frustules. Thalas- siosira rotula densities were also affected by changing Si
concentrations in the medium. However, in con-
trast to Coscinodiscus sp., the effect of Si limitation was found in 0 and 142 µM Si treatments. This result may be explained by the size of T. rotula relative to Coscinodis-
– 3
NO
– 3
NO
– 3
NO
– 3
NO
cus sp. The smaller T. rotula may have less Si available for regeneration in the form of changing frustule mor- phology and thickness, thereby becoming Si deficient more quickly than Coscinodiscus sp.
4.2. Nutrient Competition between Two Algal Species
In the competition experiment between Coscinodiscus sp. and T. rotula for N, the large species was dominant over the small one in both N forms when nutrients were limit-ing. In 4 medium, Coscinodiscus sp. dominated by the
end of most treatment combinations. This pattern of do- minance showed that small diatom was out competed for
nutrients in all treatment levels, except when both 4
NH
NH
and Si were present in maximal levels. In medium,
Coscinodiscus sp. also dominated the assemblage at the end of most treatments. This indicates that small species
was unable to compete with large species for when
concentrations are less than 1210 µM .
– 3 NO NO NO – 3 – 3 – 3 NO
The effects of changing N and Si on Coscinodiscus sp. densities, when grown in competition with T. rotula, we- re essentially the same as those observed when Coscino- discus sp. was growing in monoculture. This suggests that T. rotula has no effect on the growth of Coscinodis-cus sp. in the competition studies. However, the effects of changing nutrient concentrations on T. rotula densities, when grown in competition with Coscinodiscus sp.,were
different from the effects observed when T. rotula was
grown in and 4 in monoculture. When gro-
wn with 4-N, T. rotula abundances were signifi-
cantly affected by changes in 4 and Si concentration
in the competition study. These effects were not observed
when T. rotula was growing by itself. When grown in
4 in monoculture, T. rotula densities began to de-
crease between day 8 and day 13 of the study. When
competing with Coscinodiscus sp. for 4, this de-
crease occurred more quickly, between day 3 and day 13 of the experiment. Similar results were observed when comparing monoculture and competition studies for cells
growing in -N. These findings suggest that the la-
rge species is a stronger competitor for N and can out co- mpete the small species.
– 3 NO NH – 3 NO NH NH NH NH
Ammonia ( 4) is a positively charged or neutral
(NH3) molecule, and can therefore easily diffuse over
biological membranes, making it difficult to store [9]. In
4 medium, the competitive superiority of Coscino-
discus sp. may be due to a higher 4 uptake rate (i.e.
a higher affinity for 4), because assimilation of 4
NH
NH
NH
NH NH
is a faster process and nitrogen is more rapidly incorpo- rated into amino acids than it is taken up at the cell sur-
face [14]. In medium, dominance of Coscinodis-
cus sp was probably due to its large size, which enables to store a greater amount of in a larger vacuole [15].
Stored can be utilized when levels are low,
which allows the cell to survive when sufficient N cannot be taken up from the medium. This advantage allowed
Coscinodiscus sp. to more efficiently make use of the
available nutrients when was the N source, and
thus dominate the community. These results agree with previous studies, which have reported the dominance of
larger diatoms when is the sole N source [14].
– 3 NO – 3 NO – 3 NO – 3 NO – 3 NO – 3 NH NO
Results from the monoculture experiments showed that both Coscinodiscus sp. and T. rotula were unable to sati-
sfy N requirements with 4 alone, and probably used
whatever NH4
they could take up from the medium to-
gether with stored to ensure N requirements were
met. A higher affinity for 4 uptake, together with a
large capacity for storage, might have provided
Coscinodiscus sp. with a competitive advantage when
4 – 3 NO – 3 NO NH
NH-N was the N source in this study, by enabling the
cells to more efficiently make use of total available N
(i.e., stored , and 4
– 3
NO NH in the culture medium). The
disadvantaged T. rotula, with a smaller storage capacity were possibly unable to secure a sufficient N supply when
4
NH-N was the N source. As stored was used up,
T. rotula were unable to survive on 4 alone and cell
densities decreased as the experiment progressed. This result was more pronounced in the lower Si concentra- tions, which may imply that cells that are unable to ob- tain a sufficient N supply are less competitive for low Si levels. If N supplies were insufficient, cells may priori- tize their N requirements, addressing the needs of cellular functions essential to survival first. The selective loss of non-essential N compounds in response to N deficiency, including the reduction of cellular protein content has been reported in a previous study on marine diatoms [18]. This loss might include the proteins required for the completion of Si metabolism [12]. This may explain why cells that were unable to acquire an adequate supply of N might have been prevented from meeting their Si re- quirements via an incomplete Si transport system.
– 3
NO NH
When NH4
-N was the N source, T. rotula was out
competed for NH4
, and was therefore out competed for
Si. When -N was the N source, T. rotula was out-
competed for , and was therefore out-competed for
Si. These results provide evidence for the key dilemmas outlined in the introduction. Firstly, we show that
com-petition for Si is N source dependent, since in both 4
– 3 NO – 3 NO NH
and , the species that was best able to utilize the N
source dominated the assemblage. Secondly, we have de- monstrated that competition for N is dependent on N sou- rce in the environment, with large species dominating in , and the species with the highest affinity for the
nutrient dominating in 4
– 3 NO – 3 NO
NH. The larger Coscinodiscus sp.
dominated when -N was the N source, and the spe-
cies with the highest affinity for 4, also Coscinodi-
scus sp., dominated when 4-N was the N source.
However, it should be noted that the affinity of Coscino-
– 3
NO
discus sp and T. rotula for a particular nitrogen source was not directly examined in this study. A comparison of uptake rates and Ks values for the different forms of ni-
trogen would provide further valuable information on the nature of competition between these two species.
5. Acknowledgements
We thank Sandra Marshall for assistance with algal cul- ture, and Kylie Lange for her help with statistical analy- sis.
REFERENCES
[1] G. E. Hutchinson, “The Paradox of the Plankton,” Ameri- can Naturalist, Vol. 95, No. 882, 1961, pp. 137-145. doi:10.1086/282171
[2] D. A. Siegel, “Resource Competiton in a Discrete Envi- ronment: Why Are Phytoplankton Distributions Paradoxi- cal?” Limnology and Oceanography, Vol. 43, No. 6, 1998, pp. 113-146. doi:10.4319/lo.1998.43.6.1133
[3] D. Tilman, “Resource Competition between Planktonic Algae: An Experimental and Theoretical Approach,” Eco- logy, Vol. 58, No. 26, 1977, pp. 338-348.
doi:10.2307/1935608
[4] U. Sommer, “Are Marine Diatoms Favoured by High Si:N Ratios?” Marine Ecology Progress Series, Vol. 115, 1994, pp. 309-315. doi:10.3354/meps115309
[5] W. Stolte and R. Riegman, “A Model Approach for Size- Selective Competition of Marine Phytoplankton for Fluc- tuating Nitrate and Ammonium,” Journal of Phycology, Vol. 32, No. 5, 1996, pp. 732-740.
doi:10.1111/j.0022-3646.1996.00732.x
[6] J. K. Egge and D. L. Aksnes, “Silicate as Regulating Nu- trient in Phytoplankton Competition,” Marine Ecology Progress Series, Vol. 83, 1992, pp. 281-289.
doi:10.3354/meps083281
[7] C. W. Sullivan, “Diatom Mineralization of Silicic Acid 1. Si(OH)4 Transport Characteristics in Navicula
pellicu-losa,” Journal of Phycology, Vol. 12, No. 4, 1976, pp. 390-396.
[8] M. A. Brzezinski, R. J. Olson and S. W. Chisholm, “Sili-con Availability and Cell Cycle Progression in Marine Diatoms,” Marine Ecology Progress Series, Vol. 67, 1990, pp. 83-96. doi:10.3354/meps067083
[9] T. A. Probyn, “Nitrogen Uptake by Size Fractionated Phytoplankton Populations in the Southern Benguela Up- welling System,” Marine Ecology Progress Series, Vol. 22, 1985, pp. 249-258. doi:10.3354/meps022249
[10] M. W. Lomas and P. M. Gilbert, “Interactions between Nitrate and Ammonium Uptake and Assimialtion: Com-parison of Diatoms and Dinoflagellates at Different Growth Temperatures,” Marine Biology, Vol. 133, No. 3, 1999, pp. 541-551. doi:10.1007/s002270050494
[11] M. A. Brzezinski, “Cell Cycle Effects on the Kinetics of Silicic Acid Uptake and Resource Competition among Diatoms,” Journal of Plankton Research, Vol. 14, No.
114, 1992, pp. 1511-1539. doi:10.1093/plankt/14.11.1511 [12] M. A. Brzezinski and D. J. Conley, “Silicon Deposition
during the Cell Cycle of Thalassiosira weisfloggi (Bacil- lariophyceae) Determined Using Dual Rhodamine123 and Propidium Iodide Staining,” Journal of Phycology, Vol. 30, No. 1, 1994, pp. 45-55.
doi:10.1111/j.0022-3646.1994.00045.x
[13] B. J. Binder and S. W. Chisholm, “Changes in the Soluble Silicon Pool Size in the Marine Diatom Thalassiosira weisfloggi,” Marine Biology Letters, Vol. 1, 1980, pp. 205-212.
[14] W. Stolte and R. Riegman, “Effect of Phytoplankton Cell Size on Transient State Nitrate and Ammonium Uptake Kinetics,” Microbiology, Vol. 141, No. 5, 1995, pp. 1221- 1229. doi:10.1099/13500872-141-5-1221
[15] W. Stolte, T. McCollin, A. A. M. Noordeloos and R. Rie- gman, “Effect of Nitrogen Source on the Size Distribution within Phytoplankton Populations,” Journal of Experi- mental Marine Biology and Ecology, Vol. 184, No. 1, 1994, pp. 83-97. doi:10.1016/0022-0981(94)90167-8 [16] R. R. L. Guillard and J. H. Ryther, “Studies on Marine
Diatoms 1. Cyclotella Nana and Hustedt and Detonula Confervacea Gran,” Canadian Journal of Microbiology, Vol. 8, No. 2, 1962, pp. 229-239. doi:10.1139/m62-029 [17] P. Diggle, “Analysis of Longitudinal Data,” Clarendon
Press, Oxford, 1994.
[18] Q. Dortch, “Effect of Growth Conditions on Accumula-tion of Internal Nitrate, Ammonium Amino Acids and Protein in Three Marine Diatoms,” Journal of Experi-mental Marine Biology and Ecology, Vol. 61, No. 3, 1982, pp. 243-264. doi:10.1016/0022-0981(82)90072-7
[19] U. Sommer, “Nitrate and Silicate Competition among Antarctic Phytoplankton,” Marine Biology, Vol. 91, No. 31, 1986, pp. 345-351. doi:10.1007/BF00428628
[20] W. G. Harrison, L. R. Harris and B. D. Irwin, “The Ki-netics of Nitrogen Utilization in the Oceanic Mixed Layer: Nitate and Ammonuim Interactions at Nanomolar Con-centrations,” Limnology and Oceanography, Vol. 41, No. 1, 1996, pp. 16-32. doi:10.4319/lo.1996.41.1.0016 [21] C. W. Sullivan, “Diatom Mineralization of Silicic Acid 2.
Regulation of Si(OH)4 Transport Rates during the Cell
Cycle of Navicula pelliculosa,” Journal of Phycology, Vol. 13, 1977, pp. 86-91.
[22] B. Booth and P. J. Harrison, “Effect of Silicate Limitation on Valve Morphology in Thalassiosira and Coscinodis-cus sp. (Bacillariophyceae),” Journal of Phycology, Vol. 15, No. 3, 1979, pp. 326-329.
doi:10.1111/j.1529-8817.1979.tb02647.x
[23] E. Paasche, “Silicon and the Ecology of Marine Plank-tonic Diatoms 1. Thalassiosira pseudonana (Cyclotella nana) Grown in Chemostat with Silicate as Limiting Nu-trient,” Marine Biology, Vol. 19, No. 2, 1973, pp. 117- 126. doi:10.1007/BF00353582
[24] K. D. Bidle and F. Azam, “Accelerated Dissolution of Diatom Silica by Marine Bacterial Assemblages,” Nature, Vol. 397, 1999, pp. 508-512. doi:10.1038/17351