ISSN Online: 2169-2688 ISSN Print: 2169-267X
DOI: 10.4236/ars.2018.73017 Sep. 29, 2018 245 Advances in Remote Sensing
Towards a Remote Sensing and GIS-Based
Technique to Study Population and Urban
Growth: A Case Study of Multan
Atif Ali, Anam Khalid, Muhammad Atif Butt
*, Rashid Mehmood, Syed Amer Mahmood,
Javed Sami, Jahanzeb Qureshi, Kashif Shafique, Asdullah Khan Ghalib, Rizwan Waheed,
Farhan Ali, Rais Mukhtar, Muhammad Azhar
Department of Space Science, University of the Punjab, Lahore, Pakistan
Abstract
In recent decades, the migration rates of the large cities of Punjab have been risen up to a considerable level due to the lack of employment opportunities as well as lack of facilities in the rural areas of the province. It has caused an unprecedented and unplanned urbanization across the urban areas of the province. This study has been undertaken to perform fractal analysis about the sprawl in rapidly growing city. GIS and remote sensing data have been used in this study as an emerging technology which is cost effective as well as accurate at the same time. Landsat images have been taken for the study and the sprawl has been calcu-lated with the analysis of the data of each decade for past more than 40 years. It has been observed that the built up area is 47.8 to 141.12 Sq. Km whereas the pattern of urban settlement has been classified as clustered and linear, following the roads network. The temporal population growth also seconded these re-sults. The population growth rate and population density increase, are based on the pixel based extraction of the data from satellite imagery for the period of 2000 to 2014, which is taken as a decision support tool. In 2000, the population of the district increased from 2,071,694 (1981 census) to 2,939,907 and then in 2013, it became 4,384,191 at a rate to 2.93% upturn per annum. Moreover, the study also reveals the extent of the growth of other land uses as well which may be taken as a reference that in an agricultural country like Pakistan, the natural re-sources are being wasted (by urbanization of the fertile land). There must be some master planning to avoid such things in the other cities as well.
Keywords
Urban Sprawl, Population Growth, Spatio-Temporal, Remote Sensing, Land Use, Pakistan
How to cite this paper: Ali, A., Khalid, A., Butt, M.A., Mehmood, R., Mahmood, S.A., Sami, J., Qureshi, J., Shafique, K., Ghalib, A.K., Waheed, R., Ali, F., Mukhtar, R. and Azhar, M. (2018) Towards a Remote Sens-ing and GIS-Based Technique to Study Population and Urban Growth: A Case Study of Multan. Advances in Remote Sensing, 7, 245-258.
https://doi.org/10.4236/ars.2018.73017
Received: February 18, 2018 Accepted: September 26, 2018 Published: September 29, 2018
Copyright © 2018 by authors and Scientific Research Publishing Inc. This work is licensed under the Creative Commons Attribution International License (CC BY 4.0).
DOI: 10.4236/ars.2018.73017 246 Advances in Remote Sensing
1. Introduction
At present, 50% of the world’s inhabitants live in urban areas. By 2050, that ratio will have increased to more than 70%. The major challenge to the developing nations in this era is urban growth or urban sprawl spreading rapidly because of hasty growth of populace, rapid financial advancements and basic substratum advancements [1][2].
Cities exist round 2% of the Earth’s surface yet consume about 75% of the world’s resources, and given that more of the world’s inhabitants now live in urban lands than in rural lands. According to comprehensive analysis the popu-lation is growing rapidly worldwide and is increased from 13% to 49% within fifteen years and it is expected to redouble to 60% by 2030 [3].
The main reason of urban sprawl reprehend is due to the inefficient utilization of energy, lands, resources and extensive scale infringement on agricultural lands [4]. So sustainable urban planning is inevitably a major challenge for the nations. What needs to be done? It’s all about well-informed management of resources, proper congruous management, measurements, mapping and integration of energy from renewable sources is vital for all nations. Also the monitoring of le-veled urban sprawl is essential for government authorities and planners in any area.
Further for sustainable urban development the reliable and efficient informa-tion about spatio-temporal pattern and built up is essential for urban sprawl measurement [3]. Globally all the researchers integrate GIS in urban planning for the development of sustainable environment sprawl analysis and mapping.
The use of GIS and RS is a distinct option for viable mapping and monitoring for urban sprawl [5]. GIS based technology provides advanced analytical and management tools to spatially analyze and study patterns and spatial variations and correlations to make more informed decisions [6].
Remote sensing analysis helps in assessing the damage that urban growth has on the environment and GIS techniques are valuable in determining analytical and management tools to spatially analyze and study patterns, growth, natural extent and spatial variations and correlations to make more informed decisions [7]. These technologies emerged as a feasible substitute because of cost effec-tiveness, high-tech reliability, and offers interminable and reliable record of spa-tial patterns. Also it is very suitable for change detection analysis. The repeated data acquisition, synoptic view and formats processed by PCs have made re-motely sensed products appropriate for the analysis of change detection applica-tions.
2. Objectives
1) To identify the urban sprawl through Spatio-Temporal analysis of Multan City.
2) To predict direction of urban growth in Multan City.
DOI: 10.4236/ars.2018.73017 247 Advances in Remote Sensing
3. Study Area
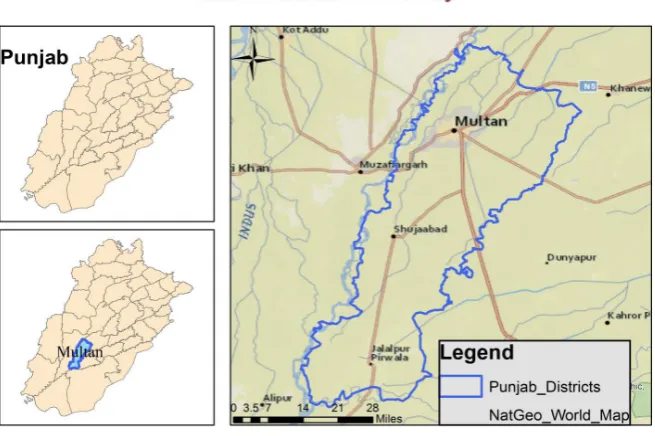
The fifth largest city of Pakistan is Multan which is situated between 29'-22' and 30'-45' North latitude, 71'-4' and 72'-4'55 East longitude [8]. It consists of four tehsils Multan Cantonment, Multan Sadar, Shujabad and Jalalpur Pirwala, hav-ing a total area of 3721 square kilometers (District office, Multan). It is situated in a bent formed by coalescent of five rivers (see Figure 1). It is separated from District Bahawalpur by river Sutlej and separated from District Muzaffargarh by river Chenab. Its average altitude is around 215 meters above sea level (MCCI). It has topography of plain grounds with a vast network of rivers, canals and wa-ter channels, making it a highly fertile land. The north side of the district is highly populated.
To carry out this research work, it was thought initially to consider the entire districts as the study area, but after observing population growth trends and keen consideration about urban extent, the Multan city along with its peri-urban area has been selected for this research work having a total area of 1013.4 square kilometers. It has 129 UCs with 64 rural and 65 urban UCs (District office, Mul-tan). Out of these 65 urban UCs, 60 urban UCs fall in our study area. Multan has extreme climate with an average temperature of 49˚C in summers and 1˚C in winters. The average rainfall is 127 mm (Pakistan Weather Portal). It has a pop-ulation of 1.197 million as per census of 1998 and has risen to in 2015 [8]. With an increase in population, the migration rate from rural areas to urban areas has been increased drastically and resulting in disorganized urbanization of arable land (Report on Vision 2030 by Planning Commission).
4. Methodology
[image:3.595.210.538.493.711.2]The previous studies for the chosen area were all based on paper maps. This
DOI: 10.4236/ars.2018.73017 248 Advances in Remote Sensing research work employs the techniques of GIS and Remote Sensing for detecting the extent, direction and pattern of urban growth during the time span of 1972 to 2015. In order to detect, calculate and analyze the vicissitudes, ERDAS Im-agine and ArcGIS softwares have been utilized. The data collection was com-prised of two phases.
4.1. Data Collection from Primary Sources
The data from the primary sources was collected through visiting the district of-fices. The obtained maps were then digitized and brought into GIS environment using ArcGIS 10.2 software.
The served areas of water supply and sewerage was acquired to give a clearer picture of the lack of facilities in the city due to unforeseen urbanization. These layers include:
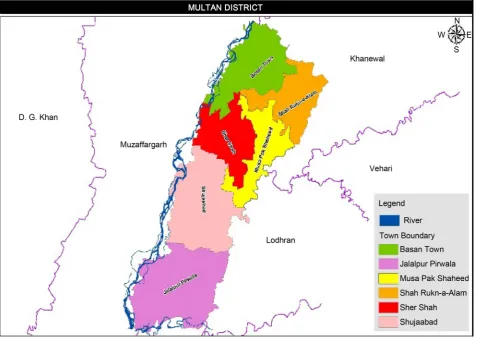
1) Administrative layers (District, Tehsil, Town and UC boundary see Figure 2).
2) MC and Ex-MCL boundary extracted from old master plans.
[image:4.595.60.538.371.710.2]3) Sewerage served areas & water supply areas to demonstrate that due to ha-phazard spread in the urban fringes of the city, some areas lack in the basic facil-ities and these population pockets would keep on increasing in case of absence of
DOI: 10.4236/ars.2018.73017 249 Advances in Remote Sensing some effective master planning.
4.2. Data Collection from Secondary Source
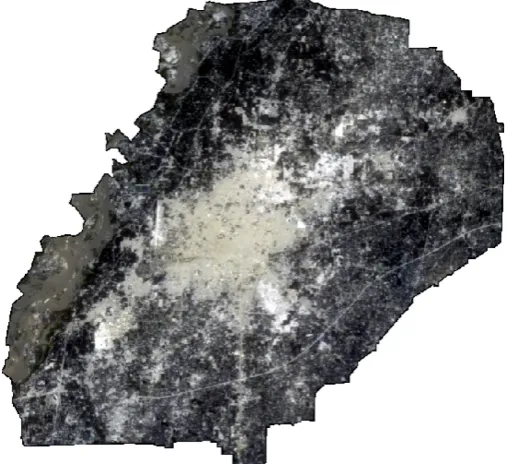
[image:5.595.247.501.330.562.2]The data of phase II was obtained from satellite imagery (see Figure 3) i.e. Landsat MSS, TM, ETM and ETM+. The acquired images details are shown in Table 1.
The satellite images were acquired keeping in consideration that the satellite images should be free from cloud cover. The layers of the acquired data was then stacked and a subset of the study area (Multan city) was extracted and some im-age enhancements were applied for the clarification of the data. The pre-processing also includes radiometric and geometric correction so that the classified images must be free from errors. This spatial resolution along with spectral bands was good enough to provide accurate information regarding expansion of the Mul-tan city. Moreover, another type of dataset, LandScan, has been used in this study to visualize the population growth trends from 1998 to 2015 (subjected to data availability).
[image:5.595.208.541.615.730.2]Figure 3. Satellite image of the study area.
Table 1. Landsat datasets.
Satellite Sensor Date Spatial Resolution Season
Landsat I MSS 7-12-1972 60 m Winter
Landsat V TM 21-5-1994 60 m Summer
Landsat VII ETM 6-5-2003 15 m Summer
Landsat VIII
DOI: 10.4236/ars.2018.73017 250 Advances in Remote Sensing
4.3. Data Generation and Post Processing
The data acquired from phase-I was brought into GIS environment by image rectification and then digitizing is applied on that data. All the layers were mapped and the built up area along-with and without water supply and sewerage facilities is demonstrate. Image classification of the satellite imageries is per-formed to get the change detection, direction and pattern analysis. For this pur-pose, supervised classification technique is utilized using maximum likelihood algorithm, non-parametric parallelepiped classifier in ERDAS Imagine and the whole image is categorized into different type of land uses i.e. built up, vegeta-tion, water and Soil. The third type of data set, i.e. population data was acquired from landScan.
5. Results and Discussions
After all the above subjected processing, the all data was mapped using ArcGIS 10.2 software to visually figure out the results. Moreover, the areas of all the land uses were calculated for each to support the argument and results.
5.1. Land Cover
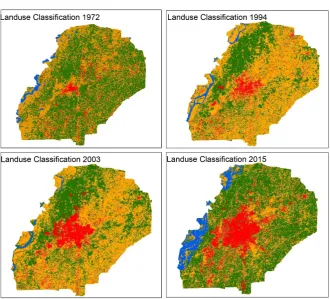
Satellite image classification is emerging as an efficient method to extract geos-patial data and information from accessible as well as remote areas and is ap-plied in multi-disciplinary fields [9]. In order to produce a land use map of the city, the Landsat imagery has been processed in ERDAS Imagine 2014 software using supervised classification technique with maximum likelihood algorithm. The classification process was divided into the following steps: 1) Satellite Im-ages as input, 2) Subset the AOI, 3) Image Enhancement, 4) Selection of training samples of all land covers, 5) Run classifier using nearest neighbor algorithm, 6) Repetition of the whole process to gain the maximum possible accuracy, 7) Final Classification. The training polygons were obtained on the basis of spectral re-sponse of the bands and the image if the entire areas have been divided into four major classes i.e. 1) Water, 2) Vegetation, 3) Bare Soil, & 4) Built up. The entire process has been reiterated to get the classification done for the four years to analyze the sprawl. The figure below depicts the mapping of the results of land use land cover classification performed. The areas for each land cover type has been calculated which illustrates the change over the decades. In 1972, a total of 47.8 Sq. km area was under built-up land whereas, in 2015, this area increased to 141.12 Sq. km (see Figure 4).
5.2. Change Detection
DOI: 10.4236/ars.2018.73017 251 Advances in Remote Sensing
Figure 4. Land-use classification of the study area.
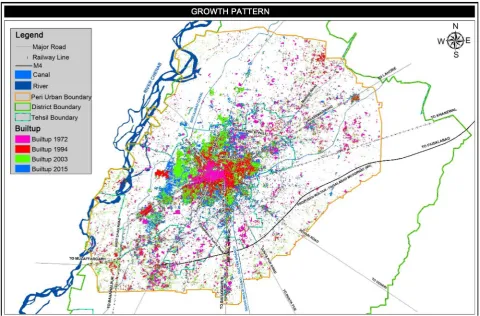
algebraic calculations such as band differencing etc. another set of techniques for the evaluation of change detection has also emerged and widely used, and is called hybrid approach for change detection. Whereas, the selection of the technique always depend multiple factors such as, availability of data, quality of data, re-quirement of the analysis, time and cost constraints etc. among the above men-tioned techniques, the radiometric change based, vector-conversion technique gas been adopted. All the acquired satellite imageries were brought to ERDAS Imagine and classification process was implied mentioned earlier. Afterwards, the whole raster data set has been vectored to get the exact calculations of each land cover type. The focus of the research is solely the change analysis of the ur-ban sprawl, so, keeping in view the prime objectives, the sprawl has been mapped and it has been observed that the built up area has increased three times over the period of four decades (see Figure 5). Moreover, it is significant that this growth was more rapid during the last decade and is justified with the rapidly increasing population.
5.3. Sprawl Analysis
DOI: 10.4236/ars.2018.73017 252 Advances in Remote Sensing
Figure 5. Growth pattern in the study area.
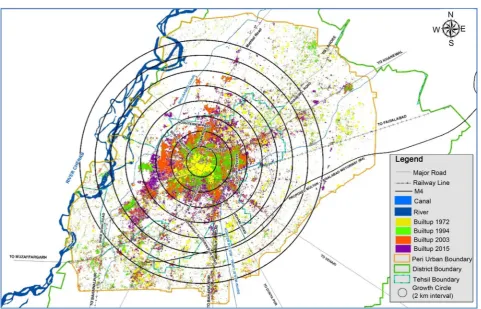
linearly. Due to the absence of a coordinated planning, Multan is has led to have a poor standard of living, bad infrastructure management, merge urban services and decayed spatial planning. It has been witnessed that during only past 12 years, the city has experienced an increase of 38 sq. km in its size which is quite considerable if kept in view the previous growth and if the same trend continues, it is expected that the city will keep on growing even on a greater rate. The ha-phazard growth in south direction has been observed to remain limited due the railway line, the railway station and their respective ancillary installations. The linear growth resulted in a total increment in 23.05 sq. km built up area. This area does not include the expansion yielded in radial growth rather it is confined to linear growth only (see Figure 6).
5.4. Directional Change
DOI: 10.4236/ars.2018.73017 253 Advances in Remote Sensing
Figure 6. Sprawl analysis of the study area.
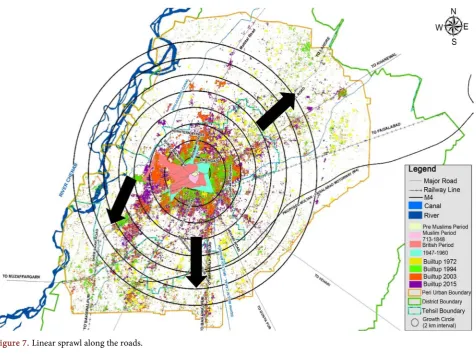
is taking place along the roads (see Figure 7). This type of sprawl is a pure de-piction of haphazard expansion in the urban limits which normally leads to poor management and a result of bad administration. The roads taking part in the li-near development of the city are, Bahawalpur Road, Surajkund Road, Vehari Road, and Khanewal Road. A total increase of 23.05 Sq. Km area is along the edges of these roads. The individual measurements of the increment of built up along these roads are demonstrated in Table 2.
5.5. Population Growth vs. Areal Growth
DOI: 10.4236/ars.2018.73017 254 Advances in Remote Sensing
Figure 7. Linear sprawl along the roads.
Table 2. Increment of built up along the roads.
Area of Growth 1972 1994 2003 2015
SW 7.49 16.68 22.46 31.02
Bahawalpur Road (S) 2.414146 3.507758 6.27782 8.912999
Surajkund Road 3.594438 5.121584 4.311516 11.84317
Vehari Road 0.847894 1.346681 2.221279 4.348801
Khanewal Road 2.336827 2.465987 3.127345 7.14
Total 9.193305 12.44201 15.93796 32.24497
the coming years are shown in the Table 3.
[image:10.595.56.542.445.576.2]DOI: 10.4236/ars.2018.73017 255 Advances in Remote Sensing
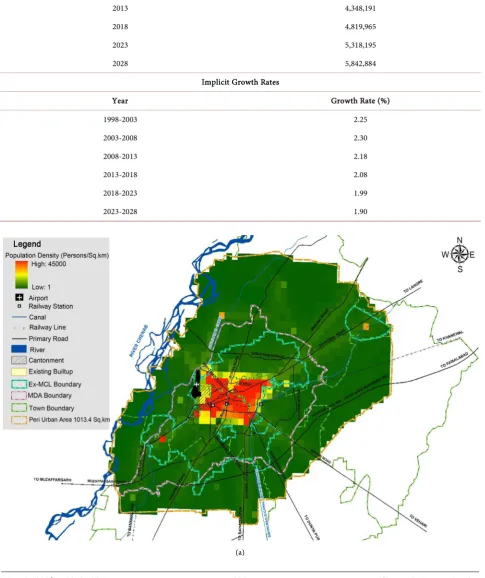
Table 3. Population forecasts and implicit growth rate (Source: integrated master plan of Multan 2008-2028).
Population Forecasts
Year Population
2003 3,484,017
2008 3,902,876
2013 4,348,191
2018 4,819,965
2023 5,318,195
2028 5,842,884
Implicit Growth Rates
Year Growth Rate (%)
1998-2003 2.25
2003-2008 2.30
2008-2013 2.18
2013-2018 2.08
2018-2023 1.99
2023-2028 1.90
DOI: 10.4236/ars.2018.73017 256 Advances in Remote Sensing (b)
DOI: 10.4236/ars.2018.73017 257 Advances in Remote Sensing (d)
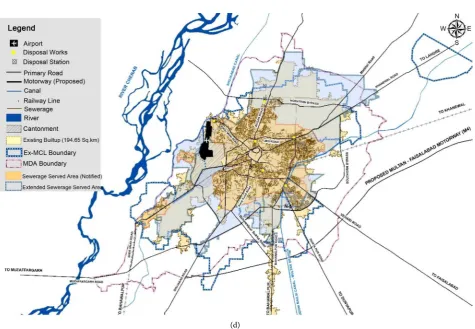
Figure 8. (a) Population density along the roads; (b) Population density along the roads; (c) Population density along the roads;
(d) Population density along the roads.
6. Conclusions
During the past 12 years, the overall built-up area has been increased by 38 sq. Km, whereas, the rate of increase in populated area was lesser in the previous years. This directly demonstrates a rapid increase in urbanization in the coming years that would eventually lead to the loss of fertile agriculture land. Moreover, if the linear development continues, it may eventually result in collapsing the existing administrative system due to lack of facilities to those areas. To investi-gate the authenticity of the fact, the basic utility provision areas, i.e. areas under government water supply and sewerage, have been mapped that support the above stated argument. The city is growing farther than the available utilities.
Taking the above argument, there is a dire need of updated master planning or peri-urban structure planning of the city to avoid chocking the system of util-ity and service provision to the citizens and the haphazard conversion of the precious fertile land into urbanized building having sky scrapers instead of lush green fields. This would not only result in the bad model of governance, rather it would also ruin our falling economy that is majorly supported by agriculture.
Conflicts of Interest
DOI: 10.4236/ars.2018.73017 258 Advances in Remote Sensing
References
[1] Pathan, S.K. and Jothimani, P. (1989) Mapping and Identification of Land Cover Features around Madras Metropolitan Area from Irs-1a, Landsite TM and SPOT MLA/PLA Data NNRMS Bulletin. Bangalore, India.
[2] Pathan, S.K., Jothimani, P., Patel, R., et al. (1991) Comparative Evaluation of Ah-medabad. Proceeding of National Seminar on ISR-1A and Its Application Potential. Hyderabad, India.
[3] Barredo, J. and Demicheli, L. (2003) Urban Sustainability in Developing Countries’ Megacities: modelling and Predicting Future Urban Growth in Lagos. Cities, 20, 297-310. https://doi.org/10.1016/S0264-2751(03)00047-7
[4] Antony, J., Downey-Ennis, K., Antony, F. and Seow, C. (2007) Can Six Sigma Be the ‘Cure’ for Our ‘Ailing’ NHS? Leadership in Health Services, 20, 242-253.
https://doi.org/10.1108/17511870710829355
[5] Pathan, S.K., Sampat, K.D., Rao, M., et al. (1993) Urban Growth Trend Analysis Using GIS Technique—A Case Study of Bombay Metropolitan Region. Internation-al JournInternation-al of Remote Sensing, 14, 3169-3179.
https://doi.org/10.1080/01431169308904431
[6] Yeh, A.G. and Li, X. (2001) Measurement and Monitoring of Urban Sprawl in a Ra-pidly Growing Region Using Entropy. Photogrammetric Engineering & Remote Sensing, 67, 83-90.
[7] Burchell, R.W., Downs, A., McCann, B. and Mukherji, S. (2005) Sprawl Costs: Eco-nomic Impacts of Unchecked Development. Island Press, Washington DC. [8] (2015) Punjab Development Statistics.
http://www.bos.gop.pk/system/files/Dev-2015.pdf
[9] Davoodianidaliki, M. and Abedini, A. (2015) Targeted Satellite Image Classification for Urban Map Updating Using Geospatial Information System Platform. I nterna-tional Archives of the Photogrammetry, Remote Sensing and Spatial Information Sciences, XL-1-W5, 135-139.