EFFECT OF REINFORCEMENT RATIO AND CROSS SECTION DIMENSIONS ON THE RELIABILITY
INDEX OF SLENDER REINFORCED CONCRETE COLUMNS
*,1
Saleh, I. M.
1
Department of Civil Engineering, Faculty of Engineering, Cairo University, Egypt
2
Department of Civil Engineering, Faculty of Engineering, Beni
3
Department of Structural Engineering, Faculty of Engineering, Cairo University, Egypt
ARTICLE INFO ABSTRACT
The reliability of structure is its ability to achieve its design purpose during a specified time. The reliability index is equivalent to the probability of safety. In this study, the reliability
slender columns with rectangular cross section is studied. The variable parameters studied include the concrete compressive strength, the reinforcement yield strength, the loads, the reinforcement ratio, the dimensions of concrete cross
called @Risk (Version 6.0) was used to perform the analytical study. This paper present the effect of the reinforcement ratio and the cross section dimensions on the reliability index of sle
concrete columns. The results of this study indicate that the good quality control has significant effects on decreasing the coefficient of variation for the concrete compressive strength, yield steel strength and the dimension of reinforce
reinforced columns through increasing the reliability index β.
Copyright © 2017, Saleh et al. This is an open access distribution, and reproduction in any medium, provided
INTRODUCTION
Structural design is concerned with the assurance of adequate safety of structures under loading conditions. Because of the statistical nature of loading, material properties, manufacturing and construction processes, safety analysis can be applied using probabilistic techniques. In an early description of
probabilistic design, Freudenthal et al. (1966
the term "factor of safety" is correlated with the probability of failure or, on the other hand probability of survival (reliability)
of the structure. Ahmed et al. (2016) studied the effect of load
eccentricity on the reliability index of reinforced concrete slender column. They were pointed that:
Increasing both the loads eccentricity and the column
slenderness ratio (λ), causes a decrease
index. The reliability index (β) will be slightly decreased in case of higher column thicknesses.
Increasing the concrete compressive strength (fcu)
causes an increase in reliability index (β). This effect was significant in case of columns with small reinforcement ratio.
*Corresponding author:Saleh, I. M.
Department of Civil Engineering, Faculty of Engineering, Cairo University, Egypt.
ISSN: 0975-833X
Vol.
Article History:
Received 19th September, 2017 Received in revised form 27th October, 2017
Accepted 20th November, 2017 Published online 27th December, 2017
Citation: Saleh, I. M., Abdel-Hay A. S. and Ahmed, M. A.
slender reinforced concrete columns”, International Journal of Current Research
Key words:
Reliability, Slender Column, Reinforced concrete, and Structural safety
RESEARCH ARTICLE
EFFECT OF REINFORCEMENT RATIO AND CROSS SECTION DIMENSIONS ON THE RELIABILITY
INDEX OF SLENDER REINFORCED CONCRETE COLUMNS
Saleh, I. M.,
2Abdel-Hay A. S. and
3Ahmed, M. A.
Civil Engineering, Faculty of Engineering, Cairo University, Egypt
Civil Engineering, Faculty of Engineering, Beni-Suef University, Egypt
Structural Engineering, Faculty of Engineering, Cairo University, Egypt
ABSTRACT
The reliability of structure is its ability to achieve its design purpose during a specified time. The reliability index is equivalent to the probability of safety. In this study, the reliability
slender columns with rectangular cross section is studied. The variable parameters studied include the concrete compressive strength, the reinforcement yield strength, the loads, the reinforcement ratio, the dimensions of concrete cross-section, and the location of steel placement. Risk Analysis program called @Risk (Version 6.0) was used to perform the analytical study. This paper present the effect of the reinforcement ratio and the cross section dimensions on the reliability index of sle
concrete columns. The results of this study indicate that the good quality control has significant effects on decreasing the coefficient of variation for the concrete compressive strength, yield steel strength and the dimension of reinforced concrete sections which in turn improve the performance of slender reinforced columns through increasing the reliability index β.
access article distributed under the Creative Commons Attribution License the original work is properly cited.
Structural design is concerned with the assurance of adequate safety of structures under loading conditions. Because of the statistical nature of loading, material properties, manufacturing and construction processes, safety analysis can be applied robabilistic techniques. In an early description of 1966) pointed out that the term "factor of safety" is correlated with the probability of failure or, on the other hand probability of survival (reliability) studied the effect of load eccentricity on the reliability index of reinforced concrete
Increasing both the loads eccentricity and the column slenderness ratio (λ), causes a decrease of the reliability index. The reliability index (β) will be slightly decreased in case of higher column thicknesses.
Increasing the concrete compressive strength (fcu) causes an increase in reliability index (β). This effect umns with small
Department of Civil Engineering, Faculty of Engineering, Cairo
Increasing the yield steel strength (fy) causes an
increase in reliability index (β). This effect was significant in case of columns with small reinforcement ratio.
The good quality control has significant effects on
decreasing the coefficient of variatio
compressive strength and yield steel strength which in turn improve the performance of slender reinforced columns through increasing the reliability index β.
Frangopol et al. (1996) carried out many investigations for
columns and bridges, where the reliability is shown to be affected by load correlation and loading paths. In this work, the reliability analysis is performed by using Monte Carlo simulations, using an appropriate nonlin
relationship and a strongly simplified elastic
model. Frangopol et al. (1996
reinforced concrete short columns. The reliability of RC columns with moment and axial force in random correlation using Monte Carlo method was studied by Jiang
also, Hong and Zhou (1999) proposed an improved approach to deal with the uncertainty in eccentricity. Bazant
Holicky and Vrouwenvelder (
Sofia and Frangopol (2003), Youba Jiang and Weijun Yang (2013), Mostafa (1989), Jose (
the reliability of columns. Therefore, there is a lake of study on
International Journal of Current Research
Vol. 9, Issue, 12, pp.62940-62946, December, 2017
Hay A. S. and Ahmed, M. A. 2017. “Effect of reinforcement ratio and cross section dimensions on the International Journal of Current Research, 9, (12), 62940-62946.
EFFECT OF REINFORCEMENT RATIO AND CROSS SECTION DIMENSIONS ON THE RELIABILITY
INDEX OF SLENDER REINFORCED CONCRETE COLUMNS
Civil Engineering, Faculty of Engineering, Cairo University, Egypt
Suef University, Egypt
Structural Engineering, Faculty of Engineering, Cairo University, Egypt
The reliability of structure is its ability to achieve its design purpose during a specified time. The reliability index is equivalent to the probability of safety. In this study, the reliability index for the RC slender columns with rectangular cross section is studied. The variable parameters studied include the concrete compressive strength, the reinforcement yield strength, the loads, the reinforcement ratio, the ction, and the location of steel placement. Risk Analysis program called @Risk (Version 6.0) was used to perform the analytical study. This paper present the effect of the reinforcement ratio and the cross section dimensions on the reliability index of slender reinforced concrete columns. The results of this study indicate that the good quality control has significant effects on decreasing the coefficient of variation for the concrete compressive strength, yield steel strength d concrete sections which in turn improve the performance of slender
License, which permits unrestricted use,
Increasing the yield steel strength (fy) causes an increase in reliability index (β). This effect was significant in case of columns with small reinforcement
The good quality control has significant effects on decreasing the coefficient of variation for the concrete and yield steel strength which in turn improve the performance of slender reinforced columns through increasing the reliability index β.
carried out many investigations for columns and bridges, where the reliability is shown to be affected by load correlation and loading paths. In this work, the reliability analysis is performed by using Monte Carlo simulations, using an appropriate nonlinear stress-strain relationship and a strongly simplified elastic-plastic buckling 1996) studied the reliability of reinforced concrete short columns. The reliability of RC columns with moment and axial force in random correlation
sing Monte Carlo method was studied by Jiang et al. (2011),
proposed an improved approach to deal with the uncertainty in eccentricity. Bazant (1991),
(1997), Mohamed et al. (2001),
, Youba Jiang and Weijun Yang (2001), Kwak (2006) deals with the reliability of columns. Therefore, there is a lake of study on
INTERNATIONAL JOURNAL OF CURRENT RESEARCH
the reliability index of slender reinforced concrete columns. The objective of this study is to introduce a Risk analysis technique via the Risk analysis program model to identify and assess the parameters that affect the reliability index of slender reinforced concrete column designed according to the Egyptian code for design and construction of concrete structures (ECP 203).The parametric study deals with the effect of reinforcement ratio and the effect of cross section dimensions on the reliability index of slender RC columns.
Parametric study
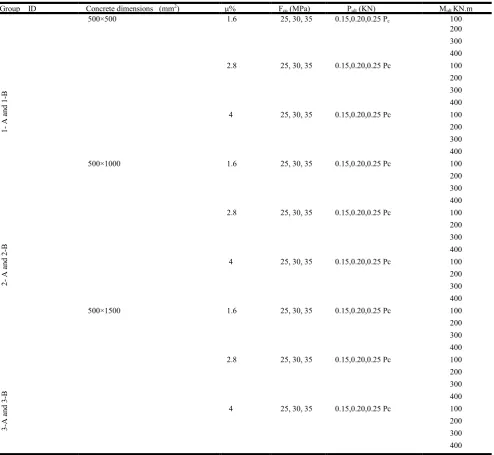
In this study, the risk analysis simulation program called @Risk (Version 6.0) is used. This software uses Monte Carlo simulation. The conducted parametric study consists of input variables of six groups of slender reinforced concrete columns as shown in Tables (1).
Where
µ is the steel reinforcement ratio
fcu is the concrete characteristic strength
fy is the steel reinforcement yield strength
Pc is the column capacity in case of pure compression
pult is the ultimate applied load (the values of pult are
equal to 0.15, 0.2 and 0.25 pc)
e is the loading eccentricity Where e = Mult/pult,
Statistics of the basic variables
The basic Statistics of variables related to column strength and
load were taken as values used in ref (Sofia et al., 2003)
Interaction diagram depicts all combinations of axial loads and bending moments
For each cross section and each case of loading, the interaction diagram was plotted using first principals according to the Egyptian code of reinforced concrete design, ECP203, with
[image:2.595.55.550.183.638.2]some simplifications as described in ref (Ahmed et al., 2016)
Table 1. The studied parameters of groups
Group ID Concrete dimensions (mm2) μ% Fcu (MPa) Pult (KN) Mult KN.m
1
-
A
and 1
-B
500×500 1.6 25, 30, 35 0.15,0.20,0.25 Pc 100
200
300 400 2.8 25, 30, 35 0.15,0.20,0.25 Pc 100
200 300
400 4 25, 30, 35 0.15,0.20,0.25 Pc 100 200
300 400
2
-
A
and 2
-B
500×1000 1.6 25, 30, 35 0.15,0.20,0.25 Pc 100
200 300
400 2.8 25, 30, 35 0.15,0.20,0.25 Pc 100 200
300 400 4 25, 30, 35 0.15,0.20,0.25 Pc 100
200 300
400
3
-A
and 3
-B
500×1500 1.6 25, 30, 35 0.15,0.20,0.25 Pc 100
200
300 400 2.8 25, 30, 35 0.15,0.20,0.25 Pc 100
200 300
400 4 25, 30, 35 0.15,0.20,0.25 Pc 100 200
300 400
Fy = 360 MPa for group A and 420 MPa for group B
Reliability formulation (verification of the structural safety)
The structural safety and the reliability index were estimated
using the method used and described in ref (Ahmed et al.,
2016).
RESULTS AND DISCUSSION
[image:3.595.308.563.48.210.2]There are many factors that affect the reliability index of R.C long column. In the present study, the factors considered were the effect of reinforcement ratio and the effect of cross section dimensions.
Table 2. Reliability index (β) for 500*500 mm R.C. cross section,
Pult= 0.15 Pc
fcu MPa
fy MPa
µ β
for e/t= 0.05
β for e/t= 0.10
β for e/t= 0.20 25
3
6
0
1.6% 2.8% 4%
0.57 0.82 1.13
0.52 0.74 1.01
0.11 0.61 0.86
30 1.6%
2.8% 4%
0.74 1.07 1.37
0.70 0.94 1.23
0.22 0.78 1.22
35 1.6%
2.8% 4%
0.95 1.29 1.57
0.88 1.19 1.51
0.35 1.16 1.41 25
420
1.6% 2.8% 4%
0.63 0.97 1.29
0.64 0.87 1.25
0.34 0.74 1.04
30 1.6%
2.8% 4%
0.84 1.18 1.59
0.77 1.10 1.50
0.47 0.99 1.30
35 1.6%
2.8% 4%
1.04 1.45 1.83
1.01 1.36 1.79
[image:3.595.33.290.252.444.2]0.65 1.18 1.62
Table 3. Reliability index (β) for 500*500 mm R.C. cross section,
Pult= 0.20 Pc
fcu MPa
fy MPa
µ β
for e/t= 0.05
β for e/t= 0.10
β for e/t= 0.20
25
360
1.6% 2.8% 4%
0.70 1.01 1.3
0.63 0.91 1.27
0.31 0.76 1.10
30 1.6%
2.8% 4%
0.93 1.28 1.71
0.85 1.16 1.54
0.41 0.99 1.34
35 1.6%
2.8% 4%
1.18 1.57 1.95
1.07 1.43 1.84
0.72 1.21 1.71 25
4
20
1.6% 2.8% 4%
0.78 1.18 1.64
0.66 1.07 1.52
0.57 0.96 1.69
30 1.6%
2.8% 4%
1.01 1.40 1.96
0.88 1.31 1.82
0.72 1.02 1.60
35 1.6%
2.8% 4%
1.28 1.77 2.28
1.14 1.65 2.17
0.98 1.45 1.69
Effect of reinforcement ratio on the reliability index
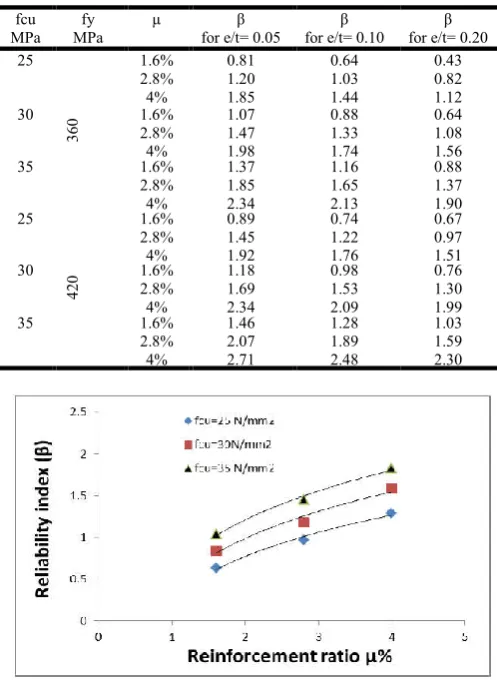
Tables (2) through (10) shows the reliability index at eccentricity/column thickness (e/t) = 0.05, 0.10 and 0.20 and different loading conditions for the studied columns. Also, some of these data plotted and represented in figures (1) through (6) which show the relation between the reliability index β and reinforcement steel ratio µ.
Figure 1. Relation between reliability index (β) and reinforcement
ratio (µ%) for 500*500 mm2 Concrete cross section, e/t = 0.05 , fy=
[image:3.595.307.559.293.633.2]360 MPa.and Pult = 0.15 Pc
Table 4. Reliability index (β) for 500*500 mm R.C. cross section,
Pult= 0.25 Pc
fcu MPa
fy MPa
µ β
for e/t= 0.05
β for e/t= 0.10
β for e/t= 0.20 25
360
1.6% 2.8% 4%
0.81 1.20 1.85
0.64 1.03 1.44
0.43 0.82 1.12
30 1.6%
2.8% 4%
1.07 1.47 1.98
0.88 1.33 1.74
0.64 1.08 1.56
35 1.6%
2.8% 4%
1.37 1.85 2.34
1.16 1.65 2.13
0.88 1.37 1.90 25
4
20
1.6% 2.8% 4%
0.89 1.45 1.92
0.74 1.22 1.76
0.67 0.97 1.51
30 1.6%
2.8% 4%
1.18 1.69 2.34
0.98 1.53 2.09
0.76 1.30 1.99
35 1.6%
2.8% 4%
1.46 2.07 2.71
1.28 1.89 2.48
[image:3.595.308.557.294.639.2]1.03 1.59 2.30
Figure 2. Relation between reliability index (β) and reinforcement
ratio (µ%) for 500*500 mm2 Concrete cross section, e/t = 0.05 , fy=
420 MPa.and Pult = 0.15 Pc
From the above results, it can be noticed that:
Reliability index increased when the reinforcement ratio
increased
For the reinforcement yield stress Fy = 360 Mpa,
increasing the reinforcement ratio from (1.6% to 2.8%) causes an increase in reliability index by range of (35% to 45%) in most cases of studied columns.
For the reinforcement yield stress Fy = 360 Mpa,
[image:3.595.37.287.487.690.2]causes an increase in reliability index by range of (20% to 35%) in most cases of groups 1 and 3and range of (35% to 65%) in most cases of groups 2.
For the reinforcement yield stress Fy = 420 Mpa,
[image:4.595.310.562.89.291.2]increasing the reinforcement ratio from (1.6% to 2.8%) causes an increase in reliability index by range of (34% to 55%) in most cases of studied columns.
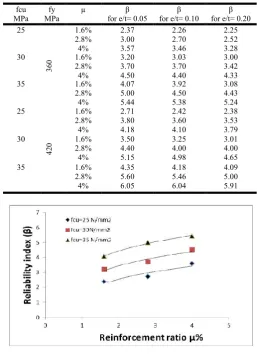
Table 5. Reliability index (β) for 1000*500 mm R.C. cross section,
Pult= 0.15 Pc
fcu MPa
fy MPa
µ β
for e/t= 0.05 β for e/t= 0.10
β for e/t= 0.20 25
3
60
1.6% 2.8% 4%
2.37 3.00 3.57
2.26 2.70 3.46
2.25 2.52 3.28
30 1.6%
2.8% 4%
3.20 3.70 4.50
3.03 3.70 4.40
3.00 3.42 4.33
35 1.6%
2.8% 4%
4.07 5.00 5.44
3.92 4.50 5.38
3.08 4.43 5.24 25
4
2
0
1.6% 2.8% 4%
2.71 3.80 4.18
2.42 3.60 4.10
2.38 3.53 3.79
30 1.6%
2.8% 4%
3.50 4.40 5.15
3.25 4.00 4.98
3.01 4.00 4.65
35 1.6%
2.8% 4%
4.35 5.60 6.05
4.18 5.46 6.04
[image:4.595.32.290.175.532.2]4.09 5.00 5.91
Figure 3. Relation between reliability index (β) and reinforcement
ratio (µ%) for 500*1000 mm2 Concrete cross section, e/t = 0.05 ,
[image:4.595.34.290.175.523.2]fy= 360 MPa.and Pult = 0.15 Pc
Table 6. Reliability index (β) for 1000*500 mm R.C. cross section,
Pult= 0.20 Pc
fcu MPa
fy MPa
µ β
for e/t= 0.05
β for e/t= 0.10
β for e/t= 0.20 25
3
60
1.6% 2.8% 4%
2.78 3.50 4.55
2.61 3.50 4.54
2.54 3.30 4.39
30 1.6%
2.8% 4%
3.77 4.60 5.58
3.58 4.53 5.53
3.33 4.32 4.98
35 1.6%
2.8% 4%
4.88 6.00 6.92
4.70 6.00 6.69
4.18 6.15 6.32 25
4
2
0
1.6% 2.8% 4%
3.44 4.60 5.28
3.31 4.30 5.02
2.47 4.25 4.62
30 1.6%
2.8% 4%
4.00 5.50 6.41
3.80 5.00 6.24
3.35 4.90 5.62
35 1.6%
2.8% 4%
5.18 6.50 7.82
4.94 6.30 7.68
4.68 6.25 7.03
For the reinforcement yield stress Fy = 420 Mpa,
increasing the reinforcement ratio from (2.8% to 4%) causes an increase in reliability index by range of (26% to 44%) in most cases of groups 1, (48% to 67%) in most cases of groups 2 and (26% to 37%) in most cases of groups 3.
Figure 4. Relation between reliability index (β) and reinforcement
ratio (µ%) for 500*1000 mm2 Concrete cross section, e/t = 0.05 ,
[image:4.595.306.562.377.746.2]fy= 420 MPa.and Pult = 0.15 Pc
Table 7. Reliability index (β) for 1000*500 mm R.C. cross section,
Pult= 0.25 Pc
fcu MPa
fy MPa
µ β
for e/t= 0.05
β for e/t= 0.10
β for e/t= 0.20 25
360
1.6% 2.8% 4%
2.98 4.80 5.34
2.76 3.86 5.23
2.59 3.64 4.87
30 1.6%
2.8% 4%
4.12 5.90 6.68
3.91 5.12 6.39
3.56 4.68 6.09
35 1.6%
2.8% 4%
5.41 7.00 8.13
5.17 6.31 7.93
4.58 6.28 7.12 25
4
2
0
1.6% 2.8% 4%
3.12 4.54 6.17
2.89 4.11 6.10
2.65 4.36 5.62
30 1.6%
2.8% 4%
4.33 5.67 7.60
4.07 5.24 7.48
3.55 5.12 6.95
35 1.6%
2.8% 4%
5.68 7.48 8.94
5.39 7.23 8.95
4.77 7.13 8.26
Figure 5. Relation between reliability index (β) and reinforcement
ratio (µ%) for 500*1500 mm2 Concrete cross section, e/t = 0.05 ,
fy= 360 MPa.and Pult = 0.15 Pc
[image:4.595.31.294.605.802.2]Table 8. Reliability index (β) for 1500*500 mm R.C. cross section,
Pult= 0.15 Pc
fcu MPa
fy MPa
µ β
for e/t= 0.05
β for e/t= 0.10
β for e/t= 0.20 25 3 6 0 1.6% 2.8% 4% 5.70 8.28 11.26 5.57 8.11 10.92 5.36 8.59 10.17
30 1.6%
2.8% 4% 7.31 10.20 13.11 7.24 10.18 13.09 6.91 10.29 12.98
35 1.6%
2.8% 4% 9.24 12.50 15.85 9.13 12.24 15.35 8.54 11.23 13.96 25 420 1.6% 2.8% 4% 6.28 9.47 13.91 6.17 9.36 12.97 6.11 8.97 12.24
30 1.6%
2.8% 4% 8.07 11.48 15.53 7.84 11.38 15.45 7.50 10.64 15.14
35 1.6%
[image:5.595.307.557.81.272.2]2.8% 4% 10.07 13.94 18.38 9.97 13.71 17.60 9.51 13.56 16.88
Figure 6. Relation between reliability index (β) and reinforcement
ratio (µ%) for 500*1500 mm2 Concrete cross section, e/t = 0.05 ,
[image:5.595.33.292.84.419.2]fy= 420 MPa.and Pult = 0.15 Pc
Table 9. Reliability index (β) for 1500*500 mm R.C. cross section,
Pult= 0.20 Pc
fcu MPa
fy MPa
µ β
for e/t= 0.05
β for e/t= 0.10
β for e/t= 0.20 25 360 1.6% 2.8% 4% 7.10 10.49 13.99 7.07 10.46 13.81 6.44 9.66 12.75
30 1.6%
2.8% 4% 9.22 12.86 16.77 9.12 12.72 16.62 8.88 12.33 16.27
35 1.6%
2.8% 4% 11.74 15.86 19.60 11.61 15.67 19.06 11.52 14.70 17.66 25 4 2 0 1.6% 2.8% 4% 7.92 11.94 16.23 7.77 11.74 16.20 7.39 11.64 16.05
30 1.6%
2.8% 4% 10.11 14.69 19.36 10.00 14.49 19.38 9.59 13.33 17.84
35 1.6%
2.8% 4% 12.77 17.98 23.06 12.49 17.38 23.05 11.70 15.93 22.41
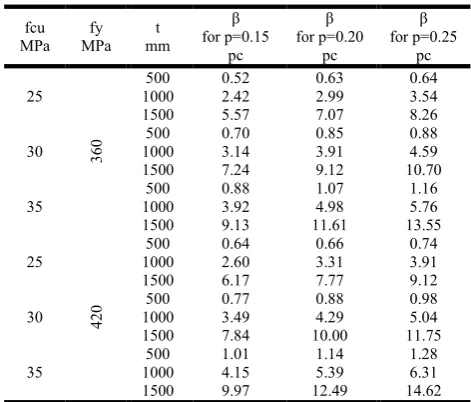
Effect of concrete column thickness on the reliability index
[image:5.595.307.556.308.547.2]The effect of concrete column thickness on the reliability index was explained in tables (11) through (18). These tables show the reliability index at eccentricity/column thickness (e/t) = 0.05, 0.10 and 0.20, for a reinforcement ratios 1.6% , 2.80% and 4.0% at different loading conditions , different concrete compression strength and steel yield strength fy of 360 and 420 MPa.
Table 10. Reliability index (β) for 1500*500 mm R.C. cross
section, Pult= 0.25 Pc
fcu MPa
fy MPa
µ β
for e/t= 0.05
β for e/t= 0.10
β for e/t= 0.20 25 3 6 0 1.6% 2.8% 4% 8.43 12.19 16.30 8.26 12.14 16.10 8.06 11.71 15.08
30 1.6%
2.8% 4% 11.05 15.18 20.10 10.70 15.03 19.90 9.89 13.90 19.19
35 1.6%
2.8% 4% 13.77 18.33 23.39 13.55 18.16 22.97 12.87 17.57 21.20 25 4 20 1.6% 2.8% 4% 9.37 14.35 19.56 9.12 14.00 19.53 8.90 13.14 17.92
30 1.6%
2.8% 4% 11.98 17.30 22.80 11.75 17.36 22.38 11.58 17.08 22.20
35 1.6%
2.8% 4% 14.86 20.72 27.12 14.62 20.66 26.74 13.88 20.06 24.36
Table 11. Reliability index (β) for different concrete cross section, e/t=0.05, µ= 1.6%
fcu MPa fy MPa t mm β for p=0.15 pc β for p=0.20 pc β for p=0.25 pc 25 3 6 0 500 1000 1500 0.57 2.47 5.70 0.70 3.11 7.10 0.81 3.66 8.43
30 500
1000 1500 0.74 3.20 7.31 0.93 4.00 9.22 1.07 4.76 11.05
35 500
1000 1500 0.95 4.07 9.24 1.18 5.03 11.74 1.37 6.03 13.77 25 420 500 1000 1500 0.63 2.71 6.28 0.78 3.44 7.92 0.89 4.04 9.37
30 500
1000 1500 0.84 3.50 8.07 1.01 4.48 10.11 1.18 5.15 11.98
35 500
1000 1500 1.04 4.36 10.07 1.28 5.55 12.77 1.46 6.48 14.86
Where β = reliability index, µ% = reinforcement steel ratio, e = eccentricity (M/P), t = column thickness
Table 12. Reliability index (β) for different concrete cross section, e/t=0.10, µ= 1.6%
[image:5.595.35.289.495.688.2] [image:5.595.314.550.600.801.2]Table 13. Reliability index (β) for different concrete cross section, e/t=0.20, µ= 1.6%
fcu MPa fy MPa t mm Β for p=0.15 pc
Β for p=0.20 pc
[image:6.595.305.560.186.389.2]Β for p=0.25 pc 25 360 500 1000 1500 0.11 2.25 5.36 0.31 2.54 6.44 0.43 2.59 8.06 30 500 1000 1500 .22 3.00 6.91 .41 3.33 8.88 .64 3.56 9.89 35 500 1000 1500 .35 3.08 8.54 .72 4.18 11.52 .88 4.58 12.87 25 4 2 0 500 1000 1500 .34 2.38 6.11 .57 2.47 7.39 .67 2.65 8.90 30 500 1000 1500 .47 3.01 7.50 .72 3.35 9.59 .76 3.55 11.58 35 500 1000 1500 .65 4.09 9.51 .98 4.68 11.70 1.03 4.77 13.88
Table 14. Reliability index (β) for different concrete cross section, e/t=0.05, µ= 2.80%
fcu MPa fy MPa t mm Β for p=0.15 pc Β for p=0.20 pc Β for p=0.25 pc 25 360 500 1000 1500 0.82 3.00 8.28 1.01 4.55 10.49 1.16 4.80 12.19 30 500 1000 1500 1.07 4.60 10.20 1.28 5.58 12.86 1.47 5.90 15.18 35 500 1000 1500 1.29 5.44 12.50 1.57 6.92 15.86 1.81 8.13 18.33 25 4 20 500 1000 1500 0.97 4.18 9.47 1.18 5.28 11.94 1.38 6.17 14.35 30 500 1000 1500 1.18 5.00 11.48 1.40 6.41 14.69 1.69 7.60 17.30 35 500 1000 1500 1.45 5.60 13.94 1.77 7.82 17.98 2.07 8.94 20.72
Table 15. Reliability index (β) for different concrete cross section, e/t=0.10, µ= 2.80%
fcu MPa fy MPa t mm Β for p=0.15 pc Β for p=0.20 pc Β for p=0.25 pc 25 3 6 0 500 1000 1500 0.74 2.70 8.11 0.91 4.54 10.46 1.03 3.86 12.14 30 500 1000 1500 0.94 4.40 10.18 1.16 4.53 12.72 1.33 5.12 15.03 35 500 1000 1500 1.19 5.38 12.24 1.43 6.69 15.67 1.65 7.93 18.16 25 4 20 500 1000 1500 0.87 4.12 9.36 1.07 5.02 11.74 1.22 6.10 14.00 30 500 1000 1500 1.10 4.49 11.38 1.31 6.24 14.49 1.53 7.48 17.36 35 500 1000 1500 1.36 5.46 13.71 1.65 7.68 17.38 1.89 8.95 20.66
From these results it can be noticed that:
Reliability index increased when concrete column
thickness increased
Increasing concrete column thickness from 500 to 1000
mm causes an increase in reliability index up to 400% to 450% for steel yield strength = 360 MPa and 430% to 500% for steel yield strength = 420 MPa.
Increasing concrete column thickness from 1000 to
[image:6.595.42.283.316.509.2]15000 mm causes an increase in reliability index up to 450%to 520% for steel yield strength = 360 MPa and 530% to 580% for steel yield strength = 420 MPa.
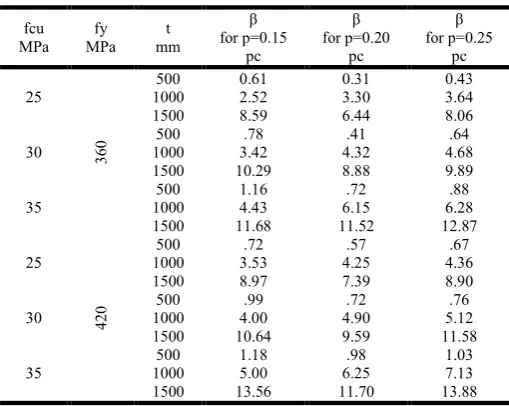
Table 16. Reliability index (β) for different concrete cross section, e/t=0.20, µ= 2.80%
fcu MPa fy MPa t mm β for p=0.15 pc β for p=0.20 pc β for p=0.25 pc 25 3 6 0 500 1000 1500 0.61 2.52 8.59 0.31 3.30 6.44 0.43 3.64 8.06 30 500 1000 1500 .78 3.42 10.29 .41 4.32 8.88 .64 4.68 9.89 35 500 1000 1500 1.16 4.43 11.68 .72 6.15 11.52 .88 6.28 12.87 25 420 500 1000 1500 .72 3.53 8.97 .57 4.25 7.39 .67 4.36 8.90 30 500 1000 1500 .99 4.00 10.64 .72 4.90 9.59 .76 5.12 11.58 35 500 1000 1500 1.18 5.00 13.56 .98 6.25 11.70 1.03 7.13 13.88
Table 17. Reliability index (β) for different concrete cross section, e/t=0.05, µ= 4.0%
fcu MPa fy MPa t mm β for p=0.15 pc β for p=0.20 pc β for p=0.25 pc
25 360 500 1000 1500 1.13 2.37 11.26 1.36 2.78 13.99 1.62 2.98 16.30
35 360 500 1000 1500 1.57 4.08 15.85 1.95 4.88 19.60 2.34 5.41 23.39
25 420 500 1000 1500 1.29 2.56 13.91 1.95 2.97 16.23 1.92 3.12 19.56
35 420 500 1000 1500 1.83 4.35 18.38 1.95 5.18 23.06 2.71 5.68 27.12
Table 18. Reliability index (β) for different concrete cross section, e/t=0.10, µ= 4.0%
fcu MPa fy MPa t mm β for p=0.15 pc
β for p=0.20 pc
β for p=0.25 pc
25 360 500 1000 1500 1.01 2.26 10.92 1.27 2.61 13.81 1.44 2.76 16.10
35 360 500 1000 1500 1.51 3.92 15.35 1.84 4.70 19.06 2.13 5.17 22.97
25 420 500 1000 1500 1.25 2.42 12.97 1.84 2.77 16.20 1.76 2.89 19.53 35 420 500 1000 1500 1.79 4.18 17.60 1.84 4.94 23.05 2.48 5.39 26.74
[image:6.595.318.548.429.590.2] [image:6.595.39.289.549.741.2] [image:6.595.301.568.631.791.2]Conclusion
The following conclusions could be obtained from the work done in this study:
Increasing the column reinforcement ratio (µ) causes an
increase in reliability index. This effect was significant in case of columns with small thickness, also in case of columns subjected to high eccentricity.
Increasing the concrete column thickness (t) causes an
increase in reliability index (β).
Increasing the concrete compressive strength (fcu)
causes an increase in reliability index (β). This effect was significant in case of columns with small reinforcement ratio.
Increasing the yield steel strength (fy) causes an
increase in reliability index (β). This effect was significant in case of columns with small reinforcement ratio.
The good quality control has significant effects on
decreasing the coefficient of variation for the concrete compressive strength, yield steel strength and the dimension of reinforced concrete sections which in turn improve the performance of slender reinforced columns through increasing the reliability index β.
REFERENCES
Ahmed, M.A, Gabr, A.S and Saleh, I. M. 2016. “Reliability of slender reinforced concrete columns : part 1”, ICCSGE: 18th International Conference on Concrete, Structural and Geotechnical Engineering, London United Kingdom Jul 28-29, 18(7) Part XVIII, PP. 2558-2564.
Bazant, E.T. 1991. “The Reliability Estimation of Short and
Slender Columns Under Random Loads”, ACI, Vol. 88, PP.
391-401.
Frangopol, D.M., Ide, Y. and Iwaki, I. 1996. “Effects of Loads Path and Load Correlation on The Reliability of Concrete
Columns”, Probabilistic Mechanics and Strucural
Reliability. Proceeding of the seventh specialty conference, Worcester, Massachusetts, USA, pp. 9-206.
Frangopol, D.M., Ide, Y., Spacone, E. and Iwaki, I. 1996. “A New Look at Reliability of Reinforced Concrete Columns”, Structural Safety, Vol. 18, No.2/3, pp. 123-150.
Freudenthal, A.M., Garretts, J.M. and Shinozoka, M. 1966.
“The Analysis of Structural Safety”, J. Struct. Div., ASCE,
92(ST1), PP.267-325.
Holicky, M. and Vrouwenvelder, T. 1997. “Time Variant Reliability of a Reinforced Concrete Column”, In: Advances in Safety and Reliability. Proceeding of the ESREL 97 International Conference on Safety and Reliability, Lisbon, Portugal, PP. 14-1307.
Hong, H.P. and Zhou, W. 1999. “Reliability Evaluations of RC
Columns”, J. Building Struct., Vol. 125, No. 7,
PP.784-790.
Jiang, Y., Yang, Y. and Yang, W. 2011. “Reliability Analysis Based on Random Correlative Characteristics Between Moment and Axial Force for RC Member Subjected to
Eccentric Compression”, J. Building Struct., Vol. 32, No.8,
pp. 106-112.
Jose, M.A. 2001. “Probbilistic analysis of reinforced concrete columns”, Advances in Engineering Software, Vol. 32, PP. 871-879.
Kwak, H. and Kim, J. 2006. “Nonlinear Behavior of Slender RC Columns (2). Introduction of Design Formula”,
Construction and Building Materials, Vol. 20, PP. 538-553.
Mohamed, A., Soares, R. and Venturini, W.S. 2001. “Partial Safety Factors for Homogeneous Reliability of Non liner
Reinforcement Concrete Columns”, Structural Safely, Vol.
23 , PP. 137-156.
Mostafa, A.M.H. 1989. “Probabilistic Analysis of Reinforced Concrete Short Columns”. A Thesis of Master Degree in Structural Engineering. Ain Shams University.
Sofia, M.C. and Frangopol, D.M. 2003. “Safety Evaluation of Slender High-Strength Concrete Columns Under Sustained Loads”, Computers and structures, Vol. 81, PP.1475-1486. Youbo, J. and Weijun. Y. 2013. “An Approach Based on
Theorem of Total Probability for Reliability Analysis of RC Columns with Random Eccentricity”, Structural Safely, Vol. 41, PP. 37-46.