Title: Endogenous LPA1 receptor agonists demonstrate ligand bias between calcium and ERK signalling pathways in human lung fibroblasts.
Authors: Afrah Sattikar, Mark R Dowling, Elizabeth M Rosethorne
Institutes:
Novartis Institutes for Biomedical Research, Wimblehurst Road, Horsham, West Sussex. RH12 5AB, UK (AS, MRD, EMR)
Novartis Institutes for Biomedical Research, 250 Massachusetts Avenue, Cambridge, MA 02139 (MRD)
Running Title: Endogenous ligand bias at the LPA1 receptor
Corresponding author: Dr E M Rosethorne
School of Life Sciences, Queen’s Medical Centre, University of Nottingham, Nottingham. NG7 2UH
Tel: +44 115 8230080
Email: [email protected]
Text pages: Tables: 4 Figures: 6 References: 33 Abstract: 249 words Introduction: 581 words Discussion: 1583 words
Abstract
Background and Purpose Human lung fibroblasts (HLF) express high levels of the LPA1 receptor, a G protein-coupled receptor (GPCR) that responds to the endogenous lipid mediator lysophosphatidic acid (1-acyl-2-hydroxy-sn-glycero-3-phosphate; LPA). Several molecular species or analogues of LPA exist and have been detected in biological fluids such as serum and plasma. The most widely expressed of the LPA receptor family is the LPA1 receptor, which predominantly couples to Gq/11, Gi/o and G12/13 proteins. This promiscuity of coupling raises the possibility that some of the LPA analogues may bias the LPA1 receptor towards one signalling pathway over another.
Experimental Approach Here we have explored the signalling profiles of a range of LPA analogues in HLF that endogenously express the LPA1 receptor. HLF were treated with LPA analogues, and receptor activation monitored via calcium mobilization and extracellular signal-regulated kinase (ERK) phosphorylation.
Key Results These analyses demonstrated that 16:0, 17:0, 18:2 and C18:1 LPA analogues appear to exhibit ligand bias between ERK phosphorylation and calcium mobilization when compared to 18:1 LPA, one of the most abundant forms of LPA that has been found in human plasma.
Table of Links Targets GPCRs
LPA receptors
http://www.guidetopharmacology.org/GRAC/FamilyDisplayForward?familyId=36
LPA1 receptor
http://www.guidetopharmacology.org/GRAC/ObjectDisplayForward?objectId=272
LPA2 receptor
http://www.guidetopharmacology.org/GRAC/ObjectDisplayForward?objectId=273
LPA3 receptor
http://www.guidetopharmacology.org/GRAC/ObjectDisplayForward?objectId=274
LPA4 receptor
http://www.guidetopharmacology.org/GRAC/ObjectDisplayForward?objectId=94
LPA5 receptor
http://www.guidetopharmacology.org/GRAC/ObjectDisplayForward?objectId=124
LPA6 receptor
http://www.guidetopharmacology.org/GRAC/ObjectDisplayForward?objectId=163
Ligands LPA
http://www.guidetopharmacology.org/GRAC/LigandDisplayForward?ligandId=2906
Introduction
Lysophosphatidic acid (1-acyl-2-hydroxy-sn-glycero-3-phosphate; LPA) belongs to a family of endogenous lipid molecules involved in a number of cellular processes including proliferation, apoptosis and migration. LPA exerts these biological effects through highly efficacious interactions with its corresponding G protein-coupled receptors (GPCRs), the LPA family of receptors, leading to downstream intracellular signalling events. The most widely expressed is the LPA1 receptor, which predominantly couples to Gq/11 and Gi/o, as well as G12/13, leading to calcium mobilization and the inhibition of cAMP generation (Alexander et al., 2015). This can lead to diverse cellular processes such as cell proliferation, actin cytoskeletal rearrangement and neurite retraction (Contos et al., 2000).
Several molecular species or analogues of LPA exist which have varying carbon chain lengths and degrees of saturation, and these LPA analogues have been detected in biological fluids such as serum and plasma, linked to either the sn-1 or sn-2 glycerol backbone. The major analogues of LPA found in human blood are the 16-, 18- and 20- long acyl chain lengths, with 86 % of LPA in serum consisting of 18:1, 18:2 and 20:4 LPA. These are found at high nanomolar concentrations in the plasma but can exceed 10 µM in serum (Baker et al., 2001, Lin et al., 2010).
correlation between degree of saturation and potency was observed (Jalink et al., 1995). The different analogues of LPA will possess a range of physicochemical properties, depending upon the structure of the acyl chain, most notably in their solubility and tendency to form micelles. This may contribute to the range of biological activities that have been observed for these molecules. The vast diversity of the LPA analogues and the range of signalling molecules available to the LPA1 receptor therefore represents a useful system in which to examine agonist-bias from endogenous ligands.
MATERIALS & METHODS LPA analogues
LPA analogues tested were purchased from Avanti Polar Lipids (Alabaster, USA) or Echelon Biosciences (Utah, USA). Purity of the LPA analogues was stated to be >99 % LPA (see Supplementary table 1 for details).
All stock solutions were made up to 10 mM in water and stored at -20 C.
For agonist treatments, all LPA analogues were prepared in Hanks’ balanced salt solution (HBSS) with Ca2+/Mg2+, containing 20 mM HEPES, 0.1 % (w/v) BSA.
Cell culture and maintenance of HLF
HLF were maintained in DMEM containing high glucose and HEPES, supplemented with heat inactivated foetal bovine serum (FBS; 10 % v/v), penicillin (100 iu.mL-1), streptomycin (100 g.mL-1), and sodium pyruvate (1 mM). Starve medium was the same as growth medium but devoid of FBS.
Calcium Mobilization assay
Normal primary HLF were plated in 384-well black walled, clear bottom plates at a density of 8,000 cells.well-1. Cells were incubated for 24 h at 37°C/5 % CO2 in a humidified atmosphere. After this time, spent media was removed, replaced with serum free media and cells incubated for a further 24 h. To monitor changes in intracellular calcium, the FLIPR® Calcium 4 Assay Kit (Molecular Devices, Sunnyvale, USA) was used. The dye was made up in HBSS with Ca2+/Mg2+, containing 20 mM HEPES, 0.1 % (w/v) BSA,2.5 mM probenecid, 0.2 % (w/v) pluronic acid. On the day of experiment, calcium 4 dye, was added to the cell plate and incubated for 45 min at 37°C/5 % CO2. For inhibition assays, antagonist was pre-incubated with cells for 30 min at 37°C/5 % CO2. Agonist was added online using the Functional Drug Screening System 7000 (FDSS7000; Hamamatsu Photonics, Hertfordshire, UK) and fluorescence monitored for 5 min with 1s increments. Peak responses were taken for data analysis (between 2-3 minutes).
For Gi/o versus Gq/11 experiments, cells were pre-treated with 200 ng/mL pertussis toxin (PTx) during the starvation step to inhibit Gi/o-dependent signalling. Calcium mobilisation was then carried out as described above.
Normal primary HLF were plated at 3,000 cells.well-1 in 384-well black walled, clear bottom plates. Cells were incubated for 24 h at 37°C/5 % CO2, after which time spent media was removed, replaced with serum free media and cells incubated for a further 24 h. Cells were then incubated with agonists for 5 min at 37°C/5 % CO2. For IC50 determinations, antagonist was added to the cells 30 min prior to agonist addition. After stimulation, cells were fixed in 4 % paraformaldehyde for 20 min, washed 2x in PBS (with Ca2+/Mg2+), and incubated with permeabilising blocking buffer (dPBS (with Ca2+/Mg2+), 10 % FBS (v/v), 0.1 % Tween-20 (v/v)) for 1 h at 37C. Wells were then washed 3x in wash buffer (TBS-T: Tris Buffered Saline (TBS), 0.05% (v/v) Tween-20) and incubated with the phospho-p44/42 ERK1/2 (Thr202/Tyr204) (D13.14.4E) XP® Rabbit mAb primary antibody (1:1000 dilution) at 4°C overnight. Following 3x wash in TBS-T, wells were incubated with blocking buffer containing Hoechst (2 µM), and CF™647-conjugated Affini-pure goat anti-rabbit IgG (1:1000 dilution) for 1 h at 37°C. Wells were washed 3x in TBS-T to remove secondary antibody and cell plate imaged using the InCell 2000 (GE Healthcare, Chalfont St. Giles, Buckinghamshire, UK) using DAPI filter (0.1 sec exp) for nuclei and Cy5 filter (1.3 sec exp) to monitor ERK1/2 phosphorylation (pERK). Images were analysed for cell intensity using the INCell Analyser software. To quantify levels of pERK fluorescence, a standard Multi-Target Analysis (MTA) algorithm was used in the INCell Analyzer Workstation (v3.7.1). Nuclei were defined using Top-hat segmentation, with a minimum area of 80 µm2 (sensitivity 50). Cells were defined using Multiscale Top-hat segmentation with a characteristic area of 300 µm2 (sensitivity 58). For Gi/o versus Gq/11 experiments, cells were pre-treated with 200 ng/mL PTx during the starvation step, to inhibit Gi/o-dependent signalling. ERK phosphorylation assay was then performed as described above.
Data Analysis
Graphs were fitted to data and statistical analysis performed using GraphPad Prism (V7.00 for
Windows, GraphPad Software, La Jolla California USA, www.graphpad.com). Results are
expressed as the mean ± standard error of mean (SEM) from three separate experiments, run
in duplicate. Concentration-response data were fitted using a four-parameter logistic equation.
The ability of an agonist to cause a functional response after binding to a receptor is known as the transduction coefficient (transduction ratio) and is a function of both the binding affinity (KA) and the efficacy () of the ligand. To compare agonist responses between different assays, the Log(/KA) or LogR was calculated using the Operational model of agonism (for details see van der Westhuizen et al. (2014)). For the purposes of this analysis, only the log of the ratio (LogR) between KA and (Log(/KA)) was calculated for each agonist at each pathway, as bias can arise through differences in either affinity or efficacy. The responses to all agonists at each pathway were globally fitted with the parameters of basal, Emax and n shared for all agonists. For full agonists, KA was constrained to > 0, and estimated directly from curve fitting for partial agonists.
For estimation of observational bias for the different assays, the LogR for each compound was compared to the LogR for the ‘neutral’ compound 18:1 LPA (or 17:0), using equation (1).
∆𝐿𝑜𝑔𝑅 = ∆𝑙𝑜𝑔 (𝐾𝜏
𝐴) = 𝑙𝑜𝑔 (
𝜏
𝐾𝐴)𝐿𝑖𝑔𝑎𝑛𝑑 − 𝑙𝑜𝑔 (
𝜏
𝐾𝐴)𝑅𝑒𝑓𝑒𝑟𝑒𝑛𝑐𝑒 (1)
Ligand bias (LogR) was calculated using the difference between the LogR values derived for each pathway using equation (2), and from this the bias factor for each compound was calculated from equation (3).
∆∆𝐿𝑜𝑔𝑅 = ∆𝐿𝑜𝑔𝑅𝐿1:𝑃1− ∆𝐿𝑜𝑔𝑅𝐿1:𝑃2 (2)
where L1 is ligand 1, P1 is pathway 1, L2 is ligand 2, and P2 is pathway 2.
Bias factor = 10∆∆𝐿𝑜𝑔𝑅 OR 10∆∆𝐿𝑜𝑔( 𝜏
𝐾𝐴) (3)
Reagents
RESULTS
LPA receptor expression
To determine which of the LPA receptors are present at significant levels in HLF, a Taqman assay quantifying the endogenous expression of the different LPA receptors was performed. The relative expression of each receptor was compared to the house keeping gene HPRT1. The LPA1 receptor had the highest level of expression in the HLF (4.4 ±1.5 fold relative expression compared to HPRT; Supplementary figure 1), while the other receptors tested had no measurable expression in these cells ( 0.1 fold relative expression compared to HPRT). Based on the expression data we used the HLF to investigate LPA1 receptor mediated signalling of different molecular analogues of LPA.
Calcium mobilization
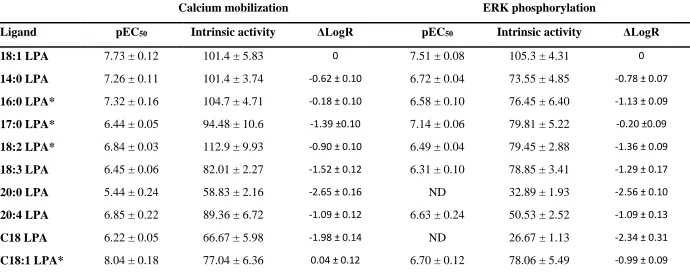
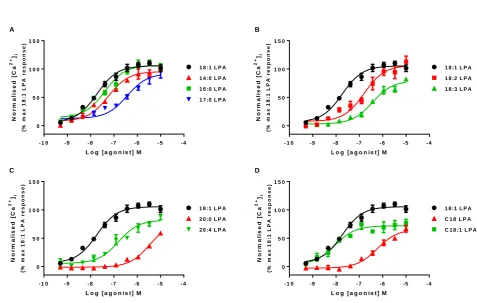
To investigate the intracellular signalling downstream of the LPA1 receptor, we first monitored calcium mobilization in HLF after treatment with a range of concentrations of eleven LPA analogues (see Supplementary table 1 for chemical structures). These eleven analogues can be divided into four sub groups of short chain (14:0, 16:0 and 17:0), 18:x, 20:x and ester C18:x LPA. The most quantitatively abundant forms of LPA in human plasma are 16:0, 18:2, and 18:1 LPA. The latter form is perhaps the most commonly used laboratory reagent for signalling studies, therefore it was used as a positive control in these experiments (Choi et al., 2010). All LPA analogues were able to increase intracellular calcium mobilization in a concentration dependent manner, with a range of potencies and intrinsic activities (figure 1). Of these, C18:1 was the most potent form of LPA, despite having modest intrinsic activity (77 %), with the fully saturated 20:0, C18 and 17:0 the least potent. All analogues except for 20:4, 18:3, C18:1, C18 and 20:0 were fully efficacious, with a comparable Emax to 18:1 LPA (table 1). Among the 18: LPAs tested a general trend was observed where an increase in the degree of saturation of the 18: LPAs resulted in an increase in both potency and intrinsic activity in the calcium mobilization assay. In contrast, among the 20:x and C18:x LPAs tested, the fully saturated 20:0 and C18:0 were the least potent and gave only partial responses in this assay.
ERK phosphorylation
performed a time course of ERK phosphorylation with 18:1 LPA (data not shown). The pERK response was rapid and short-lived, with maximal response achieved between 2 – 5 minutes after which time signal returned to basal levels. For this reason, all further experiments were performed after 5 minute stimulation.
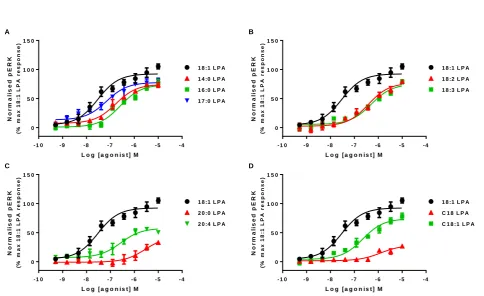
All of the LPA analogues were able to promote ERK phosphorylation with a range of intrinsic activities and potencies (figure 2). 18:1 LPA gave the largest maximal response, so this was taken to be 100 % in these assays. In comparison, all other analogues of LPA tested were partial agonists in the pERK assay, with maximal responses ranging from 25 – 80 % of that of 18:1 LPA (table 1). 20:0 and C18 were the least active LPA analogues in the pERK assay, able to only partially phosphorylate ERK at the highest agonist concentrations. Generally most analogues of LPA had either similar (18:1, 18:3, 20:4) or slightly lower (5 – 10-fold) potency in the pERK compared to the calcium mobilization assay, however 17:0 was more potent at pERK than calcium and C18:1 was more than 20-fold more potent in the calcium assay than pERK. This suggests there may be some bias in the ability of different analogues of LPA to signal to the two different pathways.
Quantification of ligand bias
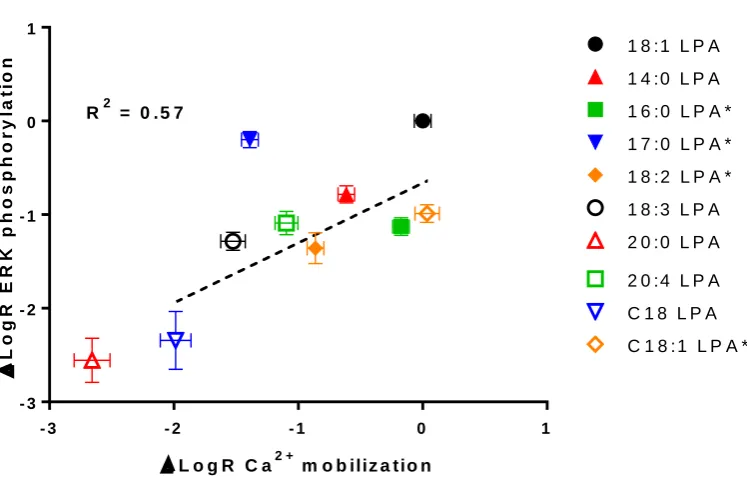
Without truly understanding the difference in system and observational bias between the two assays, it is difficult to use agonist potency to determine which of the LPA analogues are biased and which are non-biased for the different systems being studied. For this reason, we attempted to quantify the level of ligand bias between the two pathways (calcium mobilization versus ERK phosphorylation) using the operational model to calculate LogR or Log(τ/KA) for each ligand (van der Westhuizen et al., 2014, Kenakin and Christopoulos, 2013). We then calculated the LogR for each ligand, using 18:1 as the control ligand as this is one of the most abundant LPA analogues in the body, and was the only agonist that gave a maximal response in both assays (figure 3; Table 1). Comparison of the LogR of each analogue of LPA between the two different assay formats revealed significant differences in the LogR values between assays for 16:0, 17:0, 18:2 and C18:1 LPA (p < 0.05, unpaired t-test), which were selected for further investigation, using comparison 18:1 LPA as the non-biased control ligand.
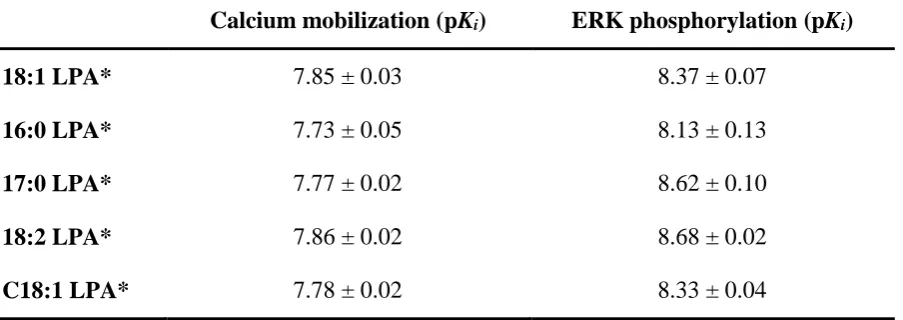
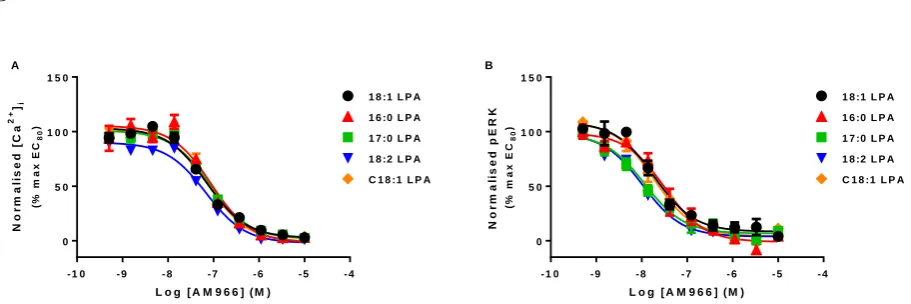
completely inhibit both calcium and pERK responses elicited by 18:1, 16:0, 17:0, 18:2 and C18:1 LPA (figure 4), demonstrating that the calcium response observed is solely due to activation of the LPA1 receptor. IC50 values derived from this assay were converted into Ki
using the Cheng-Prusoff equation (table 2).
Effect of Pertussis toxin on calcium and pERK responses
It has been demonstrated previously that the LPA1 receptor can couple to multiple pathways (Alexander et al., 2015), of which both Gi/o and Gq/11 are capable of causing increases in intracellular calcium release and ERK phosphorylation. We hypothesized that the bias we observed between calcium mobilization and ERK phosphorylation for 16:0, 17:0, 18:2 and C18:1 LPA may be due to activation of different G proteins. To explore this further, the degree of calcium mobilization and ERK phosphorylation was determined after pre-treatment of cells with PTx to inhibit Gi/o proteins.
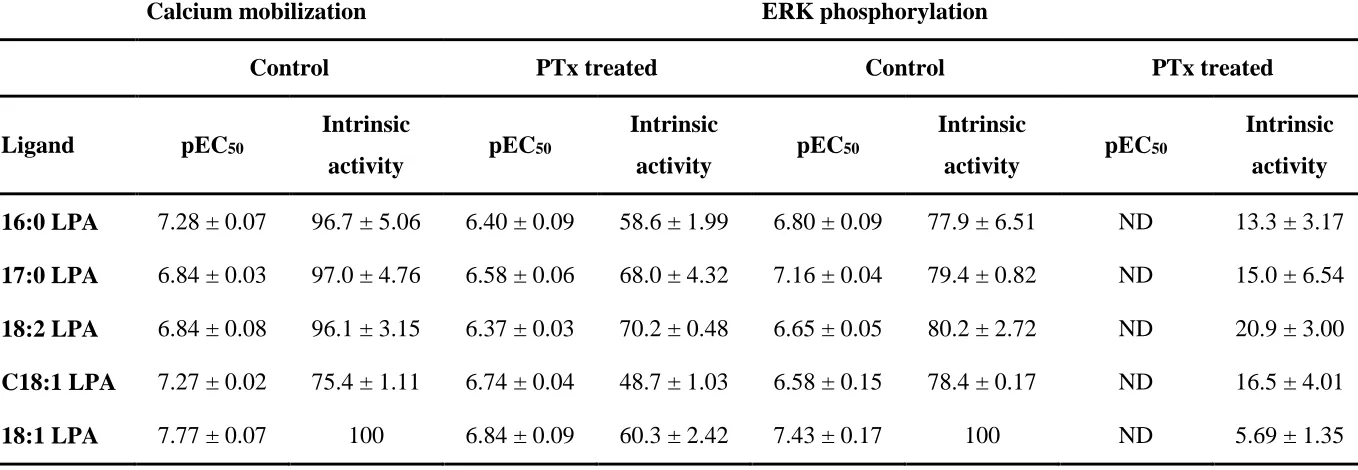
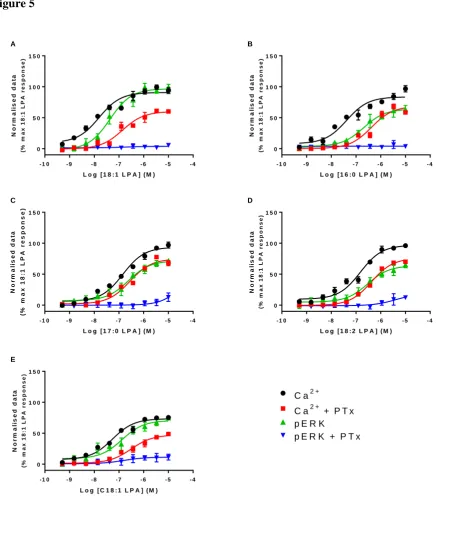
All LPA analogues tested were less potent in the calcium mobilization assay after 24 h treatment with PTx, and demonstrated reduced intrinsic activity. In contrast, we were unable to accurately determine EC50’s in the ERK phosphorylation assay after PTx treatment, as pERK responses were almost completely abolished for all the analogues of LPA tested (figure 5; table 3). From these data we can infer that the calcium response is dependent on the activation of multiple G proteins, whereas the pERK response is predominantly PTx-sensitive. To explore the bias we observed for 16:0, 17:0, 18:2 and C18:1 LPA further, we wanted to quantify the signal bias between the total pERK response and the PTx-insensitive calcium response (data from experiments performed in the presence of PTx).
DISCUSSION
The LPA1 receptor is widely expressed in the body, and has been implicated in diverse cellular and physiological responses, such as proliferation and survival, neurite retraction, brain development, renal and pulmonary fibrosis (Fukushima et al., 1998, Estivill-Torrus et al., 2008, Tager et al., 2008, Pradere et al., 2007). The endogenous ligand, LPA, has many different naturally occurring analogues which differ in chain length or saturation, and are found within a range of biological fluids including serum and blood. The physiological relevance of this diversity is not fully appreciated, however it may play an important role in pathology with evidence demonstrating that certain analogues may be differentially regulated in disease. For example, levels of the polyunsaturated 22:5 and 22:6 LPA are increased after allergen challenge in asthmatics (Park et al., 2013), and IPF patients demonstrated significantly higher levels of 22:4 LPA in their exhaled breath condensate compared to controls (Montesi et al., 2014). It has also been demonstrated that there is a preference for polyunsaturated LPAs in the follicular fluid of patients undergoing in vitro fertilization (Yamamoto et al., 2016). In addition, 18:0, 18:1 and 16:0 LPA have been shown to increase in mouse spinal dorsal horn after nerve injury, with 18:1 LPA being the key species associated with amplification of LPA production in peripheral neuropathic pain (Ma et al., 2013). The way in which these different analogues are regulated and signal within the body after activation of the LPA1 receptor is still relatively poorly understood.
Gi/o or Gq/11 proteins (Goldsmith and Dhanasekaran, 2007), or via G protein-independent mechanisms involving β-arrestin (Lefkowitz and Shenoy, 2005, Rosethorne and Charlton, 2011). The signalling properties of the different LPA analogues were first characterized in the two assays, and PTx treatment used to determine the relative contributions of Gi/o and Gq/11 (G12/13) proteins.
All analogues of LPA were capable of activating both pathways, with 18:1 LPA being the only fully efficacious agonist in both assays. The key difference observed in the responses between the assays was that all LPA analogues except 17:0 LPA were less potent in the pERK assay than the calcium mobilization assay.
In order to understand these differences, we first determined that all responses were due to only the LPA1 receptor. Using the selective LPA1 receptor antagonist AM966, we demonstrated that all responses were solely due to the activation of the LPA1 receptor. We also observed that there were significant differences between the Ki values determined from the two assays, with
AM966 demonstrating consistently higher affinity at the pERK pathway when compared to calcium (2-7 fold). This is most likely due to complications arising from non-equilibrium conditions in the rapid calcium signalling system. As the calcium assay is measured earlier than the pERK, it is likely that we are slightly underestimating the affinity of AM966 at this pathway due to these hemi-equilibrium conditions (Charlton and Vauquelin, 2010).
All responses were AM966-dependent, suggesting that bias exists between the two signalling pathways downstream of the LPA1 receptor. In order to explore the potential bias we have attempted to control for differences in the kinetics of the different assays by taking the initial peak response for both assays. This occurred between 2-3 minutes for the calcium response and at 5 minutes for the pERK response. Recent data have demonstrated that LPA1 receptor phosphorylation occurs after 15-30 minute treatment with LPA, with internalization occurring after 30-60 minutes (Alcántara-Hernández, 2015). Although we cannot completely rule out a contribution of these processes, this suggests that the responses we are measuring will not be affected by differences in receptor state, but are in fact due to differential activation of the pathways being measured.
that obtained for the reference ligand. As all the ligands we have tested here are endogenous LPAs for the LPA1 receptor, we have chosen to use 18:1 LPA as the control agonist, as it was the only analogue that was fully efficacious in both assays. We used the Operational model of agonism to calculate a LogR for each ligand, which is a combination of efficacy (τ) and affinity (K), both of which can contribute to ligand bias in a functional system. By comparing the LogR of each analogue to our control analogue, 18:1, we can eliminate any bias that may exist due to differences in the efficiency of receptor coupling to each second messenger. From this analysis, we chose to further explore the signalling profiles of 16:0, 17:0, 18:2 and C18:1 LPA, as they yielded LogR values that were significantly different between the two assay formats, indicating that they may be biased agonists.
For these selected agonists, we wanted to further explore the signal bias, by determining the role of Gi/o proteins in each of the responses we have measured. To do this we used PTx treatment to inactivate the Gi/o subset of G proteins to determine what effect this would have on the calcium and pERK responses. ERK phosphorylation was almost completely abolished after PTx treatment, while a significant proportion of the calcium response remained. This suggests that the calcium response is due to the activation of multiple G proteins, whereas the pERK response is predominantly PTx-sensitive and therefore may be due to Gi/o protein activation.
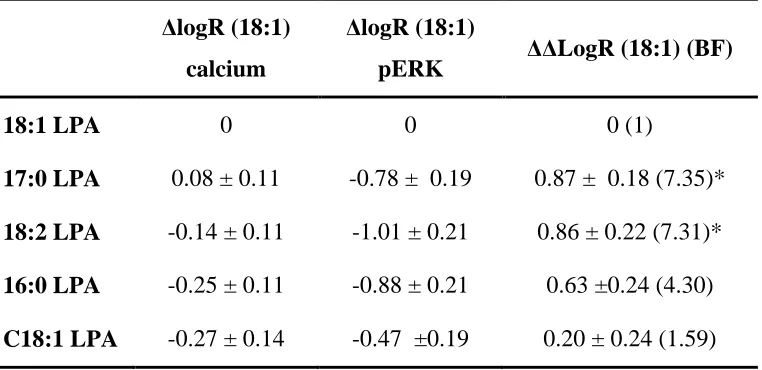
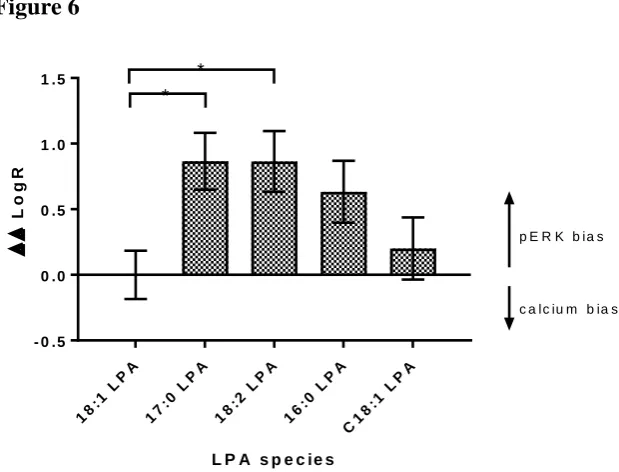
For this reason, we repeated the LogR analysis using data for ERK phosphorylation (without PTx treatment) compared to the PTx-treated calcium responses. From these data we observed a significant difference between the LogR for 18:2 and 17:0 LPA, compared to 18:1, our control LPA, suggesting that these ligands are more biased towards the pERK pathway over the PTx-insensitive calcium response when compared to 18:1 LPA. To confirm that the ERK phosphorylation is occurring independent of Gq/11 activation, and that the PTx-treated calcium responses are solely due to Gq/11 activation, it would be interesting to repeat these experiments in the presence of selective Gq inhibition, or down-regulation of specific G proteins using siRNA treatment. Although we cannot rule out a role for LPA1 receptor mediated EGF transactivation leading to ERK phosphorylation, this has been shown to be dependent upon Gi/o-derived β subunits in fibroblasts, and therefore this would still indicate ligand bias at the level of the G protein (Daub et al., 1996, Tveteraas et al., 2016).
native cell background almost exclusively expressing the LPA1 receptor, using a range of endogenous ligands, they could be indicative of the native in vivo/clinical situation in the lung. The importance of LPA as a key signalling molecule is apparent due to its widespread occurrence in biological fluids and in majority of the tissues in the body. It is also becoming increasingly important for drug discovery efforts and has been shown to play an important role in the pathogenesis of a range of diseases, with fibrosis, rheumatoid arthritis, neuropathic pain, cardiovascular disease and cancer being key areas of interest (Choi et al., 2010, Tigyi, 2010, Yanagida and Ishii, 2011, Lin et al., 2010, Velasco et al., 2016). Due to the diversity in the LPA analogues, it is possible that levels of specific molecular analogues of LPA are deregulated in certain conditions and the ligand bias could be explored in developing selective ligands for therapeutic applications. Here we have investigated signalling bias for the LPA1 receptor between calcium mobilization and ERK phosphorylation, however there is also the potential for signalling through G protein-independent pathways such as -arrestin. These data were all generated in human primary cells which endogenously express the LPA1 receptor, as well as the relevant effector proteins. For this reason we believe the bias we have detected may be more relevant for therapeutic applications. Unfortunately it is still difficult to monitor β-arrestin recruitment or receptor internalization without the need to transfect labelled proteins which may predispose the signalling towards these over-expressed pathways. For this reason we have not monitored these pathways in this study. Together these data demonstrate the importance in considering not only the LPA isoform associated with health and disease, but the receptor signalling pathways activated as well.
AUTHOR CONTRIBUTIONS
Participated in research design: Sattikar, Rosethorne, Dowling Conducted experiments: Sattikar
Contributed new reagents or analytic tools: Performed data analysis: Sattikar, Rosethorne
REFERENCES
ALCÁNTARA-HERNÁNDEZ R, HERNÁNDEZ-MÉNDEZ A, CAMPOS-MARTÍNEZ GA, MEIZOSO-HUESCA A,
GARCÍA-SÁINZ JA (2015). Phosphorylation and Internalization of Lysophosphatidic Acid
Receptors LPA1, LPA2, and LPA3. PLoS ONE, 10, e0140583.
ALEXANDER SPH, DAVENPORT AP, KELLY E, MARRION N, PETERS JA, BENSON HE et al. (2015). The
Concise Guide to PHARMACOLOGY 2015/16: G protein-coupled receptors. Br J Pharmacol 172:
5744–5869.
BAKER DL, DESIDERIO DM, MILLER DD, TOLLEY B, TIGYI GJ (2001). Direct Quantitative Analysis of
Lysophosphatidic Acid Molecular Species by Stable Isotope Dilution Electrospray Ionization
Liquid Chromatography–Mass Spectrometry. Anal Biochem 292:287-295.
BERG KA, MAAYANI S, GOLDFARB J, SCARAMELLINI C, LEFF P, CLARKE WP (1998). Effector
Pathway-Dependent Relative Efficacy at Serotonin Type 2A and 2C Receptors: Evidence for
Agonist-Directed Trafficking of Receptor Stimulus. Mol Pharmacol 54:94-104.
CHARLTON SJ & VAUQUELIN G (2010). Elusive equilibrium: the challenge of interpreting receptor
pharmacology using calcium assays. Br J Pharmacol 161:1250-1265.
CHENG Y & PRUSOFF WH (1973). Relationship Between Inhibition Constant (K1) and Concentration of
Inhibitor Which Causes 50 Per Cent Inhibition (I50) of An Enzymatic-Reaction. Biochem
Pharmacol 22:3099-3108.
CHOI JW, HERR DR, NOGUCHI K, YUNG YC, LEE C-W, MUTOH T et al., (2010). LPA Receptors: Subtypes
and Biological Actions. Annu Rev Pharmacol Toxicol 50:157-186.
CONTOS JJA, ISHII I, CHUN J (2000). Lysophosphatidic Acid Receptors. Mol Pharmacol 58:1188-1196.
CORDEAUX Y, NICKOLLS SA, FLOOD LA, GRABER SG, STRANGE PG (2001). Agonist Regulation of D2
Dopamine Receptor/G Protein Interaction. J Biol Chem 276:28667-28675.
DAUB H, ULRICH WEISS F, WALLASCH C, ULLRICH A (1996). Role of transactivation of the EGF receptor
in signalling by G-protein-coupled receptors. Nature 379:557-560.
ESTIVILL-TORRUS G, LLEBREZ-ZAYAS P, MATAS-RICO E, SANTIN L, PEDRAZA C, DE DIEGO I et al., (2008).
Absence of LPA1 signaling results in defective cortical development. Cereb Cortex 18:938-50.
FUJIWARA Y, SARDAR V, TOKUMURA A, BAKER D, MURAKAMI-MUROFUSHI K, PARRILL A et al., (2005).
Identification of Residues Responsible for Ligand Recognition and Regioisomeric Selectivity of
Lysophosphatidic Acid Receptors Expressed in Mammalian Cells. J Biol Chem
FUKUSHIMA N, KIMURA Y, CHUN J (1998). A single receptor encoded by vzg-1/lpA1/edg-2 couples to
G proteins and mediates multiple cellular responses to lysophosphatidic acid. Proc Natl Acad
Sci USA 95:6151-6.
GAY EA, URBAN JD, NICHOLS DE, OXFORD GS, MAILMAN RB (2004). Functional Selectivity of D2
Receptor Ligands in a Chinese Hamster Ovary hD2L Cell Line: Evidence for Induction of
Ligand-Specific Receptor States. Mol Pharmacol 66:97-105.
GOLDSMITH ZG & DHANASEKARAN DN (2007). G Protein regulation of MAPK networks. Oncogene
26:3122-3142.
GROOT-KORMELINK PJ, FAWCETT L, WRIGHT PD, GOSLING M, KENT TC (2012). Quantitative GPCR and
ion channel transcriptomics in primary alveolar macrophages and macrophage surrogates.
BMC Immunol 13:57.
JALINK K, HENGEVELD T, MULDER S, POSTMA FR, SIMON MF, CHAP H et al., (1995). Lysophosphatidic
acid-induced Ca2+ mobilization in human A431 cells: structure-activity analysis. Biochem J
307:609-616.
KENAKIN T & CHRISTOPOULOS A (2013). Signalling bias in new drug discovery: detection,
quantification and therapeutic impact. Nat Rev Drug Discov 12:205-216.
KENAKIN T & MILLER LJ (2010). Seven Transmembrane Receptors as Shapeshifting Proteins: The
Impact of Allosteric Modulation and Functional Selectivity on New Drug Discovery. Pharmacol
Rev 62:265-304.
KRANENBURG O & MOOLENAAR WH (2001). Ras-MAP kinase signaling by lysophosphatidic acid and
other G protein-coupled receptor agonists. Oncogene 20:1540-6.
LANE JR, POWNEY B, WISE A, REES S, MILLIGAN G (2007). Protean Agonism at the Dopamine D2
Receptor: (S)-3-(3-Hydroxyphenyl)-N-propylpiperidine Is an Agonist for Activation of Go1 but
an Antagonist/Inverse Agonist for Gi1,Gi2, and Gi3. Mol Pharmacol 71:1349-1359.
LEFKOWITZ RJ & SHENOY SK (2005). Transduction of Receptor Signals by {beta}-Arrestins. Science
308:512-517.
LIN ME, HERR DR, CHUN J (2010). Lysophosphatidic acid (LPA) receptors: Signaling properties and
disease relevance. Prostaglandins Other Lipid Mediat 91:130-138.
MA L, NAGAI J, CHUN J, UEDA H (2013). An LPA Species (18:1 LPA) Plays Key Roles in the
Self-Amplification of Spinal LPA Production in the Peripheral Neuropathic Pain Model. Mol Pain
9:29-42
MONTESI SB, MATHAI SK, BRENNER LN, GORSHKOVA IA, BERDYSHEV EV, TAGER AM, et al., (2014).
Docosatetraenoyl LPA is elevated in exhaled breath condensate in idiopathic pulmonary
PARK GY, LEE YG, BERDYSHEV E, NYENHUIS S, DU J, FU P, et al., ( 2013). Autotaxin Production of
Lysophosphatidic Acid Mediates Allergic Asthmatic Inflammation. Am J Respir Crit Care Med
188:928-940.
PRADERE JP, KLEIN J, GRES S, GUIGNE C, NEAU E, VALET P, et al., (2007). LPA1 receptor activation
promotes renal interstitial fibrosis. J Am Soc Nephrol 18:3110-8.
RAJAGOPAL S, RAJAGOPAL K, LEFKOWITZ RJ (2010). Teaching old receptors new tricks: biasing
seven-transmembrane receptors. Nat Rev Drug Discov 9:373-386.
ROSETHORNE EM, CHARLTON SJ (2011). Agonist-Biased Signaling at the Histamine H4 Receptor:
JNJ7777120 Recruits β-Arrestin without Activating G Proteins. Mol Pharmacol 79:749-757.
SAKAI N, CHUN J, DUFFIELD JS, WADA T, LUSTER AD, TAGER AM (2013). LPA1-induced cytoskeleton
reorganization drives fibrosis through CTGF-dependent fibroblast proliferation. FASEB J,
27:1830-1846.
SOUTHAN C, SHARMAN JL, BENSON HE, FACCENDA E, PAWSON AJ, ALEXANDER SP et al. (2016). The
IUPHAR/BPS Guide to PHARMACOLOGY in 2016: towards curated quantitative interactions
between 1300 protein targets and 6000 ligands. Nucl Acids Res 44:D1054–D1068.
SWANEY JS, CHAPMAN C, CORREA LD, STEBBINS KJ, BUNDEY RA, PRODANOVICH PC, et al., (2010). A
novel, orally active LPA(1) receptor antagonist inhibits lung fibrosis in the mouse bleomycin
model. Br J Pharmacol 160:1699-1713.
TAGER AM, LACAMERA P, SHEA BS, CAMPANELLA GS, SELMAN M, ZHAO Z, et al., (2008). The
lysophosphatidic acid receptor LPA1 links pulmonary fibrosis to lung injury by mediating
fibroblast recruitment and vascular leak. Nat Med 14: 45-54.
TIGYI, G. (2010). Aiming drug discovery at lysophosphatidic acid targets. Br J Pharmacol, 161, 241-270.
TVETERAAS IH, AASRUM M, BRUSEVOLD IJ, ØDEGÅRD J, CHRISTOFFERSEN T, SANDNES D (2016).
Lysophosphatidic acid induces both EGFR-dependent and EGFR-independent effects on DNA
synthesis and migration in pancreatic and colorectal carcinoma cells. Tumor Biol
37:2519-2526.
VELASCO M, O'SULLIVAN C, SHERIDAN GK (2016) Lysophosphatidic acid receptors (LPARs): Potential
targets for the treatment of neuropathic pain. Neuropharmacology. In Press
http://dx.doi.org/10.1016/j.neuropharm.2016.04.002.
VAN DER WESTHUIZEN ET, BRETON B, CHRISTOPOULOS A, BOUVIER M (2014). Quantification of Ligand
Bias for Clinically Relevant β2-Adrenergic Receptor Ligands: Implications for Drug Taxonomy.
Mol Pharmacol 85:492-509.
YAMAMOTO J, OMURA M, TUCHIYA K, HIDAKA M, KUWAHARA A, IRAHARA M, TANAKA T, TOKUMURA
fluid from patients programmed with in vitro fertilization. Prostaglandins Other Lipid Mediat.
ePub ahead of print. DIO: 10.1016/j.prostaglandins.2016.07.008
YANAGIDA K & ISHII S (2011) Non-Edg family LPA receptors: the cutting edge of LPA research. J
Table 1 Potency and intrinsic activity for different molecular species of LPA in different functional assays.
Calcium mobilization ERK phosphorylation
Ligand pEC50 Intrinsic activity ΔLogR pEC50 Intrinsic activity ΔLogR
18:1 LPA 7.73 ± 0.12 101.4 ± 5.83 0 7.51 ± 0.08 105.3 ± 4.31 0
14:0 LPA 7.26 ± 0.11 101.4 ± 3.74 -0.62 ± 0.10 6.72 ± 0.04 73.55 ± 4.85 -0.78 ± 0.07
16:0 LPA* 7.32 ± 0.16 104.7 ± 4.71 -0.18 ± 0.10 6.58 ± 0.10 76.45 ± 6.40 -1.13 ± 0.09
17:0 LPA* 6.44 ± 0.05 94.48 ± 10.6 -1.39 ±0.10 7.14 ± 0.06 79.81 ± 5.22 -0.20 ±0.09
18:2 LPA* 6.84 ± 0.03 112.9 ± 9.93 -0.90 ± 0.10 6.49 ± 0.04 79.45 ± 2.88 -1.36 ± 0.09
18:3 LPA 6.45 ± 0.06 82.01 ± 2.27 -1.52 ± 0.12 6.31 ± 0.10 78.85 ± 3.41 -1.29 ± 0.17
20:0 LPA 5.44 ± 0.24 58.83 ± 2.16 -2.65 ± 0.16 ND 32.89 ± 1.93 -2.56 ± 0.10
20:4 LPA 6.85 ± 0.22 89.36 ± 6.72 -1.09 ± 0.12 6.63 ± 0.24 50.53 ± 2.52 -1.09 ± 0.13
C18 LPA 6.22 ± 0.05 66.67 ± 5.98 -1.98 ± 0.14 ND 26.67 ± 1.13 -2.34 ± 0.31
C18:1 LPA* 8.04 ± 0.18 77.04 ± 6.36 0.04 ± 0.12 6.70 ± 0.12 78.06 ± 5.49 -0.99 ± 0.09
Potency and intrinsic activity values for LPA1 receptor agonists in calcium mobilization and ERK phosphorylation assays in HLF. Intrinsic activity was calculated as a percentage of the maximal 18:1 LPA response. ΔLogR were calculated for each agonist using the Operational model of agonism (van der Westhuizen, 2014). Data were analysed in a pairwise manner using a two-tailed unpaired Student’s t test to determine if there was a significant difference in the ΔLogR values between the two assays. Data are expressed as means ± SEM for 3 independent experiments.
Table 2 Affinity values for the LPA1 antagonist AM966 versus different LPA1 agonists.
Calcium mobilization (pKi) ERK phosphorylation (pKi)
18:1 LPA* 7.85 ± 0.03 8.37 ± 0.07
16:0 LPA* 7.73 ± 0.05 8.13 ± 0.13
17:0 LPA* 7.77 ± 0.02 8.62 ± 0.10
18:2 LPA* 7.86 ± 0.02 8.68 ± 0.02
C18:1 LPA* 7.78 ± 0.02 8.33 ± 0.04
Affinity of LPA1 receptor antagonist AM966 in calcium mobilization and ERK phosphorylation assays after treatment with a range of different LPA isoforms. Data were analysed in a pairwise manner using a two-tailed unpaired Student’s t test to determine if there was a significant difference in the affinity values between the two assays. Data are shown as means ± SEM for three independent experiments.
Table 3 Effect of PTx treatment on the potency and intrinsic activity of different LPA1 receptor agonists.
Calcium mobilization ERK phosphorylation
Control PTx treated Control PTx treated
Ligand pEC50 Intrinsic
activity pEC50
Intrinsic
activity pEC50
Intrinsic
activity pEC50
Intrinsic activity 16:0 LPA 7.28 ± 0.07 96.7 ± 5.06 6.40 ± 0.09 58.6 ± 1.99 6.80 ± 0.09 77.9 ± 6.51 ND 13.3 ± 3.17 17:0 LPA 6.84 ± 0.03 97.0 ± 4.76 6.58 ± 0.06 68.0 ± 4.32 7.16 ± 0.04 79.4 ± 0.82 ND 15.0 ± 6.54 18:2 LPA 6.84 ± 0.08 96.1 ± 3.15 6.37 ± 0.03 70.2 ± 0.48 6.65 ± 0.05 80.2 ± 2.72 ND 20.9 ± 3.00 C18:1 LPA 7.27 ± 0.02 75.4 ± 1.11 6.74 ± 0.04 48.7 ± 1.03 6.58 ± 0.15 78.4 ± 0.17 ND 16.5 ± 4.01
18:1 LPA 7.77 ± 0.07 100 6.84 ± 0.09 60.3 ± 2.42 7.43 ± 0.17 100 ND 5.69 ± 1.35
Potency and intrinsic activity of LPA1 receptor agonists in calcium mobilization and ERK phosphorylation assays in HLF, with or without PTx treatment. Intrinsic activity was calculated as a percentage of the maximal 18:1 LPA response. Data are shown as means ± SEM for three independent experiments.
Table 4 ΔΔLogR ratios and bias factors (BF) for selected LPA molecular species at the LPA1 receptor.
ΔlogR (18:1) calcium
ΔlogR (18:1)
pERK ΔΔLogR (18:1) (BF)
18:1 LPA 0 0 0 (1)
17:0 LPA 0.08 ± 0.11 -0.78 ± 0.19 0.87 ± 0.18 (7.35)* 18:2 LPA -0.14 ± 0.11 -1.01 ± 0.21 0.86 ± 0.22 (7.31)* 16:0 LPA -0.25 ± 0.11 -0.88 ± 0.21 0.63 ±0.24 (4.30) C18:1 LPA -0.27 ± 0.14 -0.47 ±0.19 0.20 ± 0.24 (1.59)
Transduction ratios (LogR) and Bias factors (BF) were calculated using the equations described in (van der Westhuizen et al., 2014) from data plotted using the Operational Model. Data used were obtained from calcium experiment performed in the presence of PTx (Gq/11-dependent) and ERK phosphorylation performed in the absence of PTx (Gi/o-dependent), and calculations performed using either 18:1 or 17:0 LPA as the reference ligand. Data are expressed as the mean ± SEM of 3 independent experiments. Data were analysed in a pairwise manner using a two-tailed unpaired Student’s t test [on ΔΔLogR] to determine the significance of the ligand biases.
Figure Legends
Figure 1 Concentration-response curves for calcium mobilization in HLF using a) short chain b) 18:x, c) 20:x and d) C18:x molecular analogues of LPA. Data were normalised to the 18:1 LPA response and are expressed as means ± S.E.M. for three independent experiments. Figure 2 Concentration-response curves for ERK phosphorylation in HLF using a) short chain b) 18:x, c) 20:x and d) C18:x molecular analogues of LPA. Cell intensity was normalised to the 18:1 LPA response and data expressed as means ± S.E.M. for three independent experiments.
Figure 3 Correlation between LogR for calcium versus ERK phosphorylation in HLF. A Pearson correlation coefficient (r) was determined followed by a two-tailed t test to determine significance (P ≤ 0.05).
Figure 4 Concentration-response curve to the selective LPA1 receptor antagonist AM966, in the presence of an EC80 concentration of 16:0, 17:0, 18:2 & C18:1 LPA for a) calcium mobilization or b) ERK phosphorylation. Data are normalised to the EC80 control for each of the different LPA analogues and are expressed as means ± S.E.M. for three independent experiments.
Figure 5 Effect of PTx on calcium mobilization and ERK phosphorylation by selected LPA analogues; a) 18:1 LPA, b) 16:0 LPA, c) 17:0 LPA, d) 18:2 LPA and e) C18:1 LPA. HLF were treated with 150 ng/ml PTx during the serum starvation and the response to selected LPA analogues was measured in calcium mobilization and ERK phosphorylation assay. Data are normalised to the 18:1 LPA response and are expressed as means ± S.E.M. for three independent experiments.
Figure 1
- 1 0 - 9 - 8 - 7 - 6 - 5 - 4
0 5 0 1 0 0 1 5 0
L o g [ a g o n i s t ] M
N o r m a li s e d [ C a 2 +] i (% m a x 1 8 :1 L P A r e s p o n s e )
1 8 :1 L P A
1 4 :0 L P A
1 6 :0 L P A
1 7 :0 L P A A
- 1 0 - 9 - 8 - 7 - 6 - 5 - 4
0 5 0 1 0 0 1 5 0
L o g [ a g o n i s t ] M
N o r m a li s e d [ C a 2 + ] i (% m a x 1 8 :1 L P A r e s p o n s e )
1 8 :1 L P A
1 8 :2 L P A
1 8 :3 L P A B
- 1 0 - 9 - 8 - 7 - 6 - 5 - 4
0 5 0 1 0 0 1 5 0
L o g [ a g o n i s t ] M
N o r m a li s e d [ C a 2 + ] i (% m a x 1 8 :1 L P A r e s p o n s e )
1 8 :1 L P A
2 0 :0 L P A
2 0 :4 L P A C
- 1 0 - 9 - 8 - 7 - 6 - 5 - 4
0 5 0 1 0 0 1 5 0
L o g [ a g o n i s t ] M
N o r m a li s e d [ C a 2 +] i (% m a x 1 8 :1 L P A r e s p o n s e )
1 8 :1 L P A
C 1 8 L P A
Figure 2
- 1 0 - 9 - 8 - 7 - 6 - 5 - 4 0
5 0 1 0 0 1 5 0
L o g [ a g o n i s t ] M
N o r m a li s e d p E R K (% m a x 1 8 :1 L P A r e s p o n s e )
1 8 :1 L P A 1 4 :0 L P A 1 6 :0 L P A 1 7 :0 L P A A
- 1 0 - 9 - 8 - 7 - 6 - 5 - 4 0
5 0 1 0 0 1 5 0
L o g [ a g o n i s t ] M
N o r m a li s e d p E R K (% m a x 1 8 :1 L P A r e s p o n s e )
1 8 :1 L P A 1 8 :2 L P A 1 8 :3 L P A B
- 1 0 - 9 - 8 - 7 - 6 - 5 - 4 0
5 0 1 0 0 1 5 0
L o g [ a g o n i s t ] M
N o r m a li s e d p E R K (% m a x 1 8 :1 L P A r e s p o n s e )
1 8 :1 L P A 2 0 :0 L P A 2 0 :4 L P A C
- 1 0 - 9 - 8 - 7 - 6 - 5 - 4 0
5 0 1 0 0 1 5 0
L o g [ a g o n i s t ] M
N o r m a li s e d p E R K (% m a x 1 8 :1 L P A r e s p o n s e )
Figure 3
- 3 - 2 - 1 0 1
- 3 - 2 - 1 0 1
L o g R C a2 + m o b iliz a t io n
L
o
g
R
E
R
K
p
h
o
s
p
h
o
r
y
la
ti
o
n
R2 = 0 . 5 7
1 8 :1 L P A
1 4 :0 L P A
1 6 :0 L P A *
1 7 :0 L P A *
1 8 :2 L P A *
1 8 :3 L P A
2 0 :0 L P A
2 0 :4 L P A
C 1 8 L P A
Figure 4
- 1 0 - 9 - 8 - 7 - 6 - 5 - 4
0 5 0 1 0 0 1 5 0
L o g [ A M 9 6 6 ] ( M )
N o r m a li s e d [ C a 2 +] i (% m a x E C 8 0 )
1 8 :1 L P A
1 6 :0 L P A
1 7 :0 L P A
1 8 :2 L P A
C 1 8 :1 L P A
A
- 1 0 - 9 - 8 - 7 - 6 - 5 - 4
0 5 0 1 0 0 1 5 0
L o g [ A M 9 6 6 ] ( M )
N o r m a li s e d p E R K (% m a x E C 8 0 )
1 8 :1 L P A
1 6 :0 L P A
1 7 :0 L P A
1 8 :2 L P A
C 1 8 :1 L P A
Figure 5
- 1 0 - 9 - 8 - 7 - 6 - 5 - 4 0
5 0 1 0 0 1 5 0
L o g [ 1 8 : 1 L P A ] ( M )
N o r m a li s e d d a ta (% m a x 1 8 :1 L P A r e s p o n s e ) A
- 1 0 - 9 - 8 - 7 - 6 - 5 - 4 0
5 0 1 0 0 1 5 0
L o g [ 1 6 : 0 L P A ] ( M )
N o r m a li s e d d a ta (% m a x 1 8 :1 L P A r e s p o n s e ) B
- 1 0 - 9 - 8 - 7 - 6 - 5 - 4 0
5 0 1 0 0 1 5 0
L o g [ 1 7 : 0 L P A ] ( M )
N o r m a li s e d d a ta (% m a x 1 8 :1 L P A r e s p o n s e ) C
- 1 0 - 9 - 8 - 7 - 6 - 5 - 4 0
5 0 1 0 0 1 5 0
L o g [ 1 8 : 2 L P A ] ( M )
N o r m a li s e d d a ta (% m a x 1 8 :1 L P A r e s p o n s e ) D
- 1 0 - 9 - 8 - 7 - 6 - 5 - 4 0
5 0 1 0 0 1 5 0
L o g [ C 1 8 : 1 L P A ] ( M )
N o r m a li s e d d a ta (% m a x 1 8 :1 L P A r e s p o n s e )
C a2 +
C a2 + + P T x
p E R K
Figure 6
18 :1 L
PA
17 :0 L
PA
18 :2 L
PA
16 :0 L
PA
C1 8:1
LP A - 0 .5
0 .0 0 .5 1 .0 1 .5
L P A s p e c ie s
L
o
g
R
* *
p E R K b ia s