PROOF
A pilot RCT of prisms, scanning, standard care in
hemianopia
Journal: Acta Neurologica Scandinavica Manuscript ID ANE-O-09-16-454.R1
Manuscript Type: Original Article
Therapy Areas: Vision and ocular movements, Strokes
Keywords: Homonymous hemianopia, Pilot trial, Randomised controlled trial, Standard care, Prism therapy, Stroke, Visual search training
PROOF
A pilot randomised controlled trial comparing effectiveness of prism glasses, visual search training and standard care in hemianopia
A pilot RCT of prisms, scanning, standard care in hemianopia
Fiona J Rowe, PhD1, Elizabeth J Conroy, PhD2, Emma Bedson, PhD3, Emma Cwiklinski, PhD3, Avril Drummond, PhD4, Marta García- Fiñana, PhD2, Claire Howard, MMedSci5, Alex Pollock, PhD6, Tracey Shipman, DBO7 ,Caroline Dodridge, DBO8, Claire MacIntosh, DBO8, Stevie Johnson, DBO9, Carmel Noonan, FRCSI, FRCOphth10, Graham Barton, FRCP11, Catherine Sackley, PhD12
1 Department of Health Services Research, University of Liverpool, Liverpool L69 3GB, [email protected]
2 Department of Biostatistics, University of Liverpool, Liverpool L69 3GA, [email protected], [email protected]
3 Clinical Trials Research Unit, University of Liverpool, Liverpool L69 3GL, [email protected], [email protected]
4 School of Health Sciences, University of Nottingham, Nottingham NG7 2UH, [email protected]
5 Department of Orthoptics, Salford Royal NHS Foundation Trust, Manchester M6 8HD, [email protected]
6 Nursing, Midwifery and Allied Health Professions Research Unit, Glasgow Caledonian University, Glasgow, [email protected]
7 Department of Orthoptics, Sheffield Teaching Hospitals NHS Foundation Trust, Sheffield S10 2JF, [email protected]
8 Department of Orthoptics, Oxford University Hospitals NHS Trust, Oxford OX3 9DU, [email protected], [email protected]
PROOF
9 Eye Clinic Impact Team, Royal National Institute for the Blind, Birmingham B1 1BN, [email protected]
10 Department of Ophthalmology, Aintree University Hospital NHS Foundation Trust, Liverpool L9 7AL, [email protected]
11 Department of Elderly Care, Warrington and Halton Hospitals NHS Foundation Trust, Warrington WA5 1QC, [email protected]
12 Division of Health and Social Care, King’s College, London WC2B 5RL, [email protected]
Corresponding author and address for reprints: Dr Fiona Rowe,
Department of Health Services Research, University of Liverpool,
Liverpool L69 3GB. T: 0151 7944956, E: [email protected]
Word count: 3756626 Number of figures: 2 Number of tables: 7
Running head: VISION hemianopia trial results
Financial support
This trial was funded by the Stroke Association, UK. The sponsor or funding organization had no role in the design or conduct of this research.
PROOF
Conflict of interestsNo conflicting relationship exists for any author
Competing interests
This trial is funded by the UK Stroke Association which includes salaries for EC. The sponsor (University of Liverpool Research Support Office) and funder (the Stroke Organisation) had no role in the study design, collection, management, analysis, interpretation of data, writing of the report; and the decision to submit the protocol for publication.
Author contributions
FR, GB, RB, AD, MGF, SJ, CM, CN, AP, JR and CS conceived of the study, participated in the design and coordination, and helped to draft the manuscript. EB, CD, CH and TS participated in the coordination and helped to draft the manuscript. MGF supervised the statistical analysis. EJC wrote the statistical analysis plan, performed the statistical analysis, participated in the coordination and data monitoring and helped to draft the manuscript. EC participated in the coordination, performed data entry and helped to draft the manuscript. All authors read and approved the final manuscript.
Abbreviations
VISION: vision impairment in stroke:intervention or not UK: United Kingdom
NHS: National health Service
RNIB: Royal National Institute for the Blind 6
PROOF
AbstractObjective: Pilot trial comparing prism therapy and visual search training, for homonymous hemianopia, to standard care (information only).
Methods: Prospective, multicentre, parallel, single-blind, three-arm RCT across fifteen UK acute stroke units.
Participants: Stroke survivors with homonymous hemianopia.
Interventions: Arm a (Fresnel prisms) for minimum 2 hours, 5 days/week over weeks. Arm b (visual search training) for minimum 30 minutes, 5 days/week over 6-weeks. Arm c (standard care-information only).
Inclusion criteria: Adult stroke survivors (>18 years), stable hemianopia, visual acuity better than 0.5logMAR, refractive error within ±5Dioptres, ability to read/understand English, and provide consent.
Outcomes: Primary outcomes were change in visual field area from baseline to 26 weeks and calculation of sample size for a definitive trial. Secondary measures included Rivermead Mobility Index, Visual Function Questionnaire 25/10, Nottingham Extended Activities of Daily Living, Euro Qual, Short Form-12 questionnaires and Radner reading ability. Measures were post-randomisation at baseline and 6, 12, 26 weeks.
Randomisation: Randomisation block lists stratified by site and partial/complete hemianopia.
Blinding: Allocations disclosed to patients. Primary outcome assessor blind to treatment allocation.
Results: 87 patients were recruited: 27 - Fresnel prisms, 30 – visual search training and 30 - standard care. 69% male; mean age 69 years (SD 12). At 26 weeks, full results for 24, 24 and 22 patients respectively were compared to baseline. Sample 6
PROOF
size calculation for a definitive trial determined as 269 participants per arm for a 200 degree2 visual field area change at 90% power. Non-significant relative change in area of visual field was 5%, 8% and 3.5% respectively for the three groups. Visual Function Questionnaire responses improved significantly from baseline to 26 weeks with visual search training (60 (SD19) to 68.4 (SD20)) compared to Fresnel prisms (68.5 (SD16.4) to 68.2 (18.4): 7% difference) and standard care (63.7 (SD19.4) to 59.8 (SD22.7): 10% difference), p=0.05. Related adverse events were common with Fresnel prisms (69.2%; typically headaches).
Conclusions: No significant change occurred for area of visual field area across arms over follow-up. Visual search training had significant improvement in vision-related quality of life. Prism therapy produced adverse events in 69%. Visual search training results warrant further investigation.
The trial is funded by the UK Stroke Association. Trial Registration: Current Controlled Trials ISRCTN05956042.
Keywords: Homonymous hemianopia; Pilot trial; Prism therapy; Randomised controlled trial; Standard care; Stroke; Visual search training
PROOF
IntroductionHomonymous hemianopia results in loss of one half of the visual field in both eyes [1,2]. The reported prevalence of visual field loss following stroke has been as high as 63% [3] in hospital populations although estimates vary widely as the proportion testing positive is highly dependent on time post stroke. Visual field defects can seriously impact functional ability and quality of life following stroke [4,5]. Patients with visual field defects have an increased risk of falling [6], impaired ability to read, poor mood and institutionalization [6-9]. Visual field loss may impact on a patient`s ability to participate in rehabilitation, and may ultimately result in poor long term recovery [8]. Visual field loss can result in accidents or injuries which have subsequent cost implications to the NHS and the patient [10].
Two key interventions commonly used in the clinical setting to improve vision in hemianopia are visual search compensatory training and provision of prisms [11]. A Cochrane systematic review [11] evaluated the interventions for homonymous hemianopia and found evidence in favour of visual search training. Subsequently, Aimola and colleagues [12] conducted a trial of visual search training for
homonymous hemianopia and reported evidence of improved quality of life in the intervention group. The Cochrane review did not find sufficient evidence for prisms as an intervention for hemianopia.
The aim of this pilot trial was to to compare visual rehabilitation interventions with NHS standard care, in patients with hemianopia following stroke. We wished to explore whether visual rehabilitation was more effective than standard care (advice only) at improving functional outcome in patients with hemianopia following stroke, and whether prism therapy or visual search therapy was more effective at improving functional outcome in patients with hemianopia following stroke.
PROOF
MethodsTrial design
VISION was a randomised controlled, multicentre pilot trial with NHS research ethical approval (10/H1003/119). The trial protocol is reported elsewhere [13]. Participants
Patients were eligible for inclusion if they met the criteria: a. 18 years of age or older;
b. Best corrected visual acuity of 0.5 or better in each eye at distance;
c. Stable homonymous hemianopia (partial or complete) induced by recent stroke, defined following WHO guidelines, present over 2 weeks (to exclude rapid recovery cases) but less than 26 weeks prior to randomisation;
d. Refractive error within ±5Dioptres;
e. Willing and able to give consent for the study; f. Prior to stroke able to read and understand English.
Patients were not eligible for inclusion if they were: a. unable to consent due to severe cognitive impairment;
b. assessed to have ocular motility impairment and/or visual inattention in addition to the visual field impairment; or
c. had pre-existent visual field impairment due to previous stroke.
Participants were recruited from stroke units based in 15 United Kingdom (UK) National Health Service (NHS) Trusts. Potentially eligible participants were identified 6
PROOF
investigator (a qualified orthoptist registered with the health and Care Professions Council, UK). Participants eligible for inclusion, and providing consent, attended for a baseline assessment, which included assessment and documentation of patient demographics, visual signs and symptoms, visual acuity measures, any additional ocular problems, comorbidity, severity of stroke and level of disability.
Recruitment and randomisation
Participants were individually randomised to one of three treatment groups using a secure (24-hour) web based randomisation programme. Randomisation lists were generated using block randomisation stratified by centre and degree of hemianopia (partial or complete) with treatment allocation ratio of 1:1:1. The local PI (orthoptist) obtained the treatment allocation and subsequently assigned the participant to the treatment arm.
Interventions
Treatment A: Fresnel prisms
Participants were assessed and given sector Fresnel prisms of 40 prism dioptre strength on their glasses (or plain glasses if not already worn) [14]. Separate prism segments were used as a mechanical displacement to expand the upper and lower quadrants. Full fitting details are detailed in the protocol [13]. Participants were advised to wear the prisms for a minimum of 2 hours daily, for a minimum six weeks, from prism affixation; after this they could elect to continue treatment if wished. Treatment B: Visual search training
Participants were assessed and provided with visual search training. This comprised an A4 landscape card with horizontal and diagonal numbered circles radiating out 6
PROOF
from a central fixation target. Full instructions for training are detailed in the protocol [13]. Participants were instructed to continually scan between the various targets for 30 minutes daily for a minimum six weeks, after which they could elect to continue treatment if they wished. Participants were instructed on the search exercises to ensure their understanding of doing this training. In addition, printed instructions were provided with the visual training target cards.
Treatment C: Control - Standard Care (Information Only)
Participants were given information leaflets from the UK Stroke Association and the UK Royal National Institute for the Blind (RNIB) about visual impairment following stroke.
Participants in all treatment groups received these information leaflets. Details of usage of the prisms and visual search training were collected by diaries, completed daily by participants.
Outcomes
Outcomes were assessed at baseline, 6, 12 and 26 weeks. The primary clinical outcome was relative change in visual field area (measured in degrees2) from baseline to 26 weeks and, based on this change, a sample size calculation for a future definitive trial. Secondary clinical outcomes, assessed by the orthoptist, were reading ability (speed and accuracy). Secondary clinical outcomes, reported by patients, were assessed through questionnaire booklets. [13]. Further key objectives of this pilot trial were to test the operationalisation of the intervention and the study outcome measures [13, 15].
PROOF
Sample size calculationA sample size calculation was estimated for repeated measures analysis of covariance [16], using the data generated on visual field assessment.
Visual field assessment
A blinded qualified Orthoptist assessed visual field area. An Esterman strategy was used for quantitative visual field assessment with standard fixation monitoring strategies of fixation loss, false positive and false negative responses. This was done using either:
• The Esterman programme on Humphrey or Octopus perimetry,
• The III4e target on Goldmann with additional checks of static points in the central visual field.
A template for Goldmann perimetry was supplied for standardisation to match the Esterman strategy on Humphrey and Octopus perimetry. A binocular visual field was measured first followed by monocular assessment of the right and left eyes. Visual fields were performed without prisms in place in the Fresnel prism arm. Where it was not possible to use either of these methods then the standardised confrontation method was used. Whichever method used at baseline was repeated at every follow up visit. Where the confrontation method was used at baseline one of the above quantitative methods was used at the follow-up if possible in addition to repeating the confrontation method.
Reading Ability
Reading ability, assessed using the Radner reading test, is reported as time taken to read (seconds) and number of incorrect words from the 14 word passage [17]. 6
PROOF
Patient Completed Outcome MeasuresParticipants completed a questionnaire booklet containing the following outcome measures:
a. Visual function questionnaire (VFQ 25-10) [18] b. Rivermead mobility index (RMI) [19]
c. Nottingham extended activities of daily living assessment (NEADL) [20] d. Euro Qual [21]
i. 5D (EQ-5D)
ii. VAS score (EQ-VAS) e. Short Form -12 (SF-12) [22]
i. Physical component summary (PCS) ii. Mental component summary (MCS)
Statistical Analysis
There were insufficient data to carry out a formal power calculation to determine sample size for this trial, a sample size of 105 participants was considered sufficient to reach pilot objectives [13].
Outcome data were analysed according to the intention-to-treat principle. Safety analyses included all patients were randomised to and received treatment. A p-value of 0.05 is considered significant, however as this is a pilot study not powered to identify differences, results will be interpreted with caution. Additionally, rather than 6
PROOF
adjust for multiplicity relevant results from other studies will be taken into account in the interpretation of results.
The statistical analysis plan, written by the trial statisticians and agreed by other members of the trial management group (TMG) and independent oversight committees: data and safety monitoring committee (IDSMC) and the trial steering committee (TSC), prior to any comparative analyses together is available on request from the authors. No imputation methods were used for missing data and all patients who withdrew from the trial were encouraged to complete follow up.
All analyses were done with SAS software version 9.2. The primary feasibility outcome of sample size calculation was calculated for a repeated measures analysis of covariance [16]. Data collected from the trial were used to estimate the standard deviation, estimate of correlation and the loss to follow up rate for the main trial. All outcomes were summarised using descriptive statistics, split by treatment, at baseline and 26 week follow up. The primary efficacy outcome was relative change in area of visual field assessment (VFA), defined as the difference in VFA from baseline to 26 weeks follow up, divided by the maximum possible VFA score for each method, and was analysed using ANOVA, controlling for treatment. A sensitivity analysis was performed on the VFA using ANCOVA for the modal assessment method (see Outcomes – Visual Field Assessment). Patient reported secondary outcomes: VFQ 25-10; RMI; NEADL; EQ-VAS and SF-12: PCS and MCS, reported at 26 week follow up, were compared using analysis of covariance,
controlling for treatment and baseline assessment. EQ-5D and Radner Reading Score were summarised using only descriptive statistics,
PROOF
ResultsRecruitment and characteristics
Recruitment and screening have been reported elsewhere [23). In summary, 1171 patients were assessed for eligibility between 17th May 2011 and 9th September 2013. Of these, 993 patients (84.8%) did not meet the inclusion criteria, 91 patients declined to participate (7.8%) leaving 87 patients in the study (7.4%). The reasons for not being eligible and for refusing to consent were recorded and published [23]. In May 2012, the team noted that the proportion of eligible patients was lower than expected and this was slowing recruitment. Upon reviewing the accumulating recruitment data, the IDSMC recommended extending recruitment by one yearand advised that the initial target sample size of 105 be reduced to 90 participants, of which 60 would be needed to complete the study. The TSC agreed with this proposal and the TMG actioned this amendment in June 2012. Figure 1 shows the cumulative recruitment graph, indicating expected, revised expected and actual recruitment by month.
At the end of the recruitment period, 27, 30 and 30 patients were randomised to Fresnel prisms, Visual search training and standard care respectively. Two patients (2/87, 2.3%) withdrew from data analysis and follow up; nine (9/87, 10.3%) from follow up only and five (5/87, 5.7%) were lost to follow up, of which four were from the standard arm (4/5, 80.0%). There was 24 (24/27, 88.9%), 25 (25/30, 83.3%) and 22 (22/30, 73.3%) patients in the Fresnel prisms, Visual search training and standard care respectively at 26 week follow up (see Figure 2).
PROOF
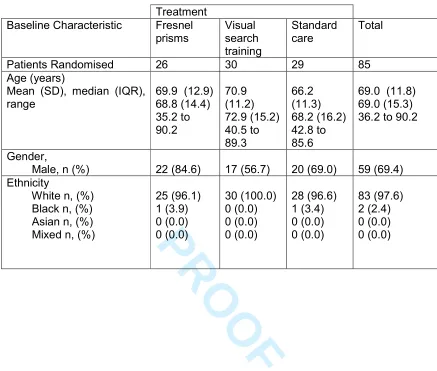
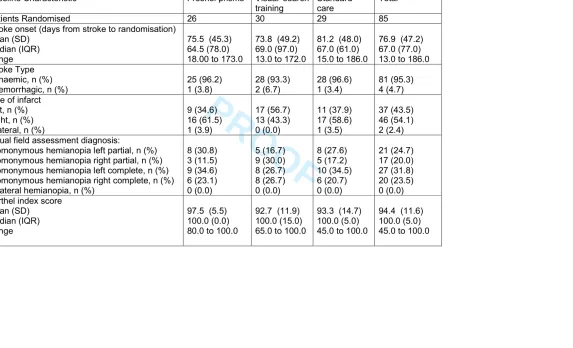
Patient demographic and clinical characteristics at baseline are provided in Table 1 and 2. There were no notable differences at baseline between three arms. The population consisted primarily of white (97.6%) males (69.4%) randomised, on average, 11 weeks post ischaemic (95.3%) stroke (late recruitment relating to the requirement for stable, non-recovering hemianopia).. The infarct was mostly
classified unilateral (43.5% left; 54.1% right).
Sample size outcome
Table 3 provides the sample size needed per arm to detect a minimally clinically important difference in visual field between per arm for a given power. Predictions are provided for three values of the minimally clinically important difference (200, 400 and 600 degrees2) and for three levels of power (90%, 80% and 50%). 80% (70/87) of patients had full data at baseline and 26 weeks. Thus the required number of patients to be recruited was calculated as 1.25 times (=1/0.8) the sample size shown in Table 3. Most recruiting sites used the Humphrey Static methods, with 33 in 70 (47.1%) patients having their VFA assessed using this method. Computing the sample size in the same way for patients being assessed by this method only reduces the number required (Table 3).
Primary clinical outcome
There was some variability in baseline relative change in visual field area across treatment arm and by method (Table 4), particularly those methods used most frequently. For the Humphrey Static Esterman method, the mean baseline visual field area was one-third lower in the standard care arm (955.8 degrees) when compared to the visual search training or Fresnel prism arm; 1428.9 degrees and 6
PROOF
1382.5 degrees respectively. For the Octopus Static Esterman method, the mean baseline visual field was 44.2% and 18.4% higher in the standard care arm when compared to the visual search training and Fresnel prism arm respectively. These differences can be explained by the large within-group variances of visual field expected with a relatively low sample size per method of assessment and per arm. The mean values of relative change in visual field area are given in Table 5, which shows a non-significant average minimal increase in visual field at 26 weeks of 5%, 8% and 3.5% for Fresnel prisms, Visual search training and standard care,
respectively (p-values >5%, <5% and >5%, respectively).
Secondary clinical outcomes
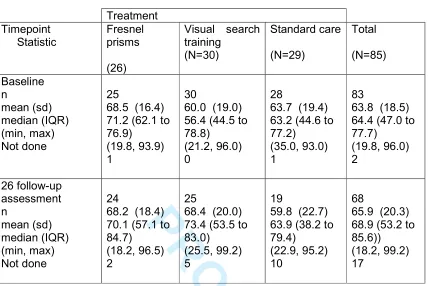
Change in functional activity was evaluated as a secondary analysis. Visual function (using the VFQ 25-10) improved at 26 weeks in the visual search training arm (60 (SD19) to 68.4 (SD20) when compared to the Fresnel Prisms (68.5 (SD16.4) to 68.2 (18.4) and standard care arms ((63.7 (SD19.4) to 59.8 (SD22.7): Table 6, ANCOVA p=0.05). No evidence of differences across arms were found for any of the other secondary outcomes, including functional mobility (ANCOVA p=0.36, extended daily level index (ANCOVA p=0.93), EQ-5D VAS score (ANCOVA p=0.60), change of general health status (ANCOVA p=0.51), reading speed and reading accuracy.
Compliance
There were 73 protocol deviations in 58 patients (68.2% overall: 77% in the Fresnel prism arm, 93% in the visual search arm and 34.5% in the standard care arm). The majority of deviations (n=41, 56.2%) related to lack of compliance in the intervention 6
PROOF
exercises not carried out for 30 minutes daily for 6 weeks). Compliance level was similar across the intervention arms. Patients in the Fresnel prisms arm wore the prisms during 27 days on average, and patients in the visual search training arm followed the visual search exercises 28 days on average. The protocol deviations in the standard group (n=10) were all related to timing and attendance at follow up visits.
Eighteen patients (69.2%) in the Fresnel prisms arm experienced a total of 42 adverse events of which 28 were classified as headache (Table 7). Two patients (6.7%) in the visual search training arm experienced seven adverse events (6 fatigue, 1 headache). No adverse events were recorded for in the standard care arm. Continuation of treatment was greater in the visual search arm than in the Fresnel prisms arm. In the visual search arm, 24 of 25 patients continued the intervention after 6 weeks, 21 of 25 after 12 weeks and 10 of 25 patients after 26 weeks. This was in comparison to 14 of 26 patients in the Fresnel prism arm after 6 weeks, 12 of 23 after 12 weeks and 5 of 24 patients after 26 weeks.
Discussion
Our primary clinical outcome measure was based on formal quantitative visual field assessment. Because of the multi-centre nature of the trial, a variety of visual field assessment methods were used as different hospitals had access to different perimeters. For future phase III trials using multiple visual field assessment methods, our sample size estimation is a maximum of 269 participants per arm for a minimum clinically important difference of 200 degree2 of visual field area relative change. Future trials using just one visual field assessment method require a sample size of a maximum of 132 participants for each arm.
PROOF
The primary clinical outcome measure for this trial was relative change in visual field area from baseline to 26 weeks. A Cochrane systematic review of interventions for post-stroke visual field loss concluded that, generally, interventions for homonymous hemianopia did not result in improvement of visual field [11]. Our results similarly showed minimal non-significant change in visual field across all 3 arms of 5, 8 and 3.5%. We considered that a change of 15% in visual field area would be clinically
significant. The insignificant change in visual field was expected given the deliberate
recruitment ofdenoting the stable hemianopes recruited to the trial. Other trials
recruiting stable hemianopias also report no significant change to extent of visual
field loss [12,24].
Published evidence relating to the effectiveness of interventions for post-stroke visual field loss is limited. Pollock and colleagues [11] concluded from their systematic review that compensatory scanning training interventions may be more beneficial than a placebo or control intervention at improving specific tasks. More recently, Aimola and colleagues [12] conducted a randomised controlled trial of visual exploration versus sham training and reported significant improvement in vision-related quality of life questionnaire scores following the intervention in
comparison to sham training. They found no significant objective improvement noted in activity of daily living tasks. Our secondary clinical outcome measures included a range of questionnaires and indices to measure vision-related and health-related quality of life and activities of daily living. The only outcome measure to show a statistically significant change was vision-related quality of life (VFQ25/10). Pollock and colleagues [11] found insufficient evidence to reach conclusions about the effectiveness of prisms; one more recent trial [24] compared real versus sham 6
PROOF
different in real versus sham prism use. Our data showed no significant difference in motility questionnaire results. However, we noted a range of adverse events related to treatment which were greatest for the Fresnel prism arm (69.2%) versus the visual search training arm (6.7%). There were no adverse events for standard care. Evaluation of recruitment and consent has been conducted for this trial and published previously [23]. We experienced greater recovery for hemianopia than previously reported in the literature and this should be taken into consideration when planning future trials with options to increase number of participating recruitment centres.
Adverse events reported with Fresnel prism therapy included headaches, difficulties with navigation, double vision, optical glare/aberrations and visual confusion, similar to events reported in previous trials [14,24]. Headaches were the most common adverse event for Fresnel prisms. We acknowledge that headaches can also be a post-stroke symptom. However, in this trial, given that headaches were not a symptom reported by patients receiving standard care and uncommon in those receiving visual search training, they were attributed to the Fresnel prism treatment. Given the extent and range of adverse events reported with prism wear, caution must be exercised if prescribing prism glasses as an intervention for homonymous hemianopia.
Adverse events for visual search training were minimal and consisted of fatigue and headache. To help minimise these potential side effects training periods should be curtailed to shorter accumulated periods rather than one long training session. We used treatment diaries to capture patient use of interventions and extracted data from these and the case report forms as to whether patients voluntarily chose to continue their intervention beyond the minimum set treatment period of 6 weeks. 6
PROOF
More patients in the visual search arm voluntarily opted to continue their intervention than patients in the Fresnel prism arm.
We noted 73 protocol deviations. For the intervention arms, these largely related to compliance with the treatment duration although no significant difference was found in the level of compliance in both intervention arms. In future trials participants could be encouraged to break up their treatment duration per day as also suggested for
reduction of adverse events; for example of having 3 shorter blocks of treatment per
day instead of only one large block of treatment. For standard care most deviations
related to follow-up visits taking place outside the time windows stipulated by the protocol. When planning future trials consideration should be given to regular telephone contact with patients to encourage on-going compliance with treatment and with timely reminders of upcoming review visits. This may also help with reducing loss to follow-up cases.
Considerations
A potential limitation of the trial was the need to use different visual field perimeters, and perimetrists, across recruitment sites for the primary outcome visual field measurements. A consideration in future trials would be to use just one perimeter type or consider alternative primary outcome measures. Given that visual fields did not change significantly and requires patients to attend follow-up appointments at hospital eye clinics (a potential deterrent to trial participation) an appropriate alternative primary outcome measure may be a vision-related quality of life questionnaire such as the VFQ25 although there are many other questionnaires to choose from dependent on whether a health-related or condition-specific
PROOF
With regard to generalizability, as this is a pilot trial, results should be interpreted with caution [265]. Although we found a statistically significant improvement in VFQ25 for visual search training, our trial was not powered for this. Nonetheless, the clinical differences are encouraging and warrant further investigation.
There remains insufficient evidence to reach conclusions about whether prisms are an effective intervention, and this study provides evidence of a high rate of adverse events associated with prism use. Clinicians with expert knowledge relating to prisms may consider their use for individual patients, but clinicians and patients both should be fully aware of potential adverse events and have a clear understanding relating to prism use.
Conclusions
Our visual search training or Fresnel prism interventions for hemianopia produced minimal change in visual field area over the 26-week follow-up period. Visual search training produced a significant improvement in vision-related quality of life but not for other activity of daily living tasks. There were no significant improvements for any quality of life measure in our Fresnel prism arm. For the visual search arm, our participants reported a low percentage of adverse events, many continued with training and we found a significant change in quality of life. This must be interpreted with caution given our low sample size
There are a number of considerations in relation to planning future trials. Assessing change in visual field which required formal visual field assessment using a variety of perimeter types. It would help to limit assessment to one method or alternatively remove this as an outcome measure. We experienced low recruitment initially but 6
PROOF
took measures to improve this with increased number of recruitment centres and met the revised target for recruitment.
Acknowledgements
FR had full access to all of the data in the study and takes responsibility for the
integrity of the data and the accuracy of the data analysis.
We should like to thank the patients and staff who participated in this trial and the following collaborators and investigators:
Isabel Ash, Conrad Beacham, Rachel Breen, Judith Burn, Carol Buckley, Joanne Gardiner, Henrietta Holmes-Smith, Sandra Knowles, Tallat Maan, Sonia
MacDiarmid, Lorraine North, Leonie Ripley, Claire Scott, Sarah Spencer, Andrew Twigg, Carole-Anne Vince, Data Monitoring Committee (Cicely Freeman, Irene Stratton, David Wright), Trial Steering Committee (Darren Brand, Catie Bunce, Anne-Marie Mackay, Sarah Peel)
References
1. ROWE FJ, VIS GROUP. Visual impairment following stroke. Do stroke patients require vision assessment? Age and Ageing. 2009; 38: 188-193 2. KERKHOFF G. Restorative and compensatory therapy approaches in
cerebral blindness – a review. Restorative Neurology Neuroscience. 1999; 15: 255-271
3. GRAY CS, FRENCH JM, BATES D, et al. Recovery of visual fields in acute stroke: homonymous hemianopia associated with adverse prognosis. Age and Ageing. 1989; 18: 419-21
PROOF
4. JONGBLOED L. Prediction of function after stroke: a critical review. Stroke. 1986; 17: 765-776
5. DOMBOVY ML, SANDOK BA, BASFORD JR. Rehabilitation for stroke: a review. Stroke. 1986: 17; 363-369
6. RAMRATTAN RS, WOLFS RC, PANDA-JONAS S et al. Prevalence and causes of visual field loss in the elderly and associations with impairment in daily functioning: the Rotterdam Study. Archives of Ophthalmology. 2001; 119: 1788–94
7. KAPLAN J, HIER DB. Visuospatial deficits after right hemisphere stroke. American Journal of Occupational Therapy. 1982; 36: 314–21.
8. JONES SA, SHINTON RA. Improving outcome in stroke patients with visual problems. Age and Ageing. 2006; 35:560-5.
9. WINDSOR RL WINDSOR LK. Hemianopsia: Loss of Half of the Visual field After Stroke or Traumatic Brain Injury.
http://www.lowvision.org/understanding%20hemianopsia1.htm:accessed23/03 /2014
10. ROWE FJ. Who sees visual impairment following stroke?Strabismus.2010: 18; 37-40
11. POLLOCK A, HAZELTON C, HENDERSON CA, et al. Interventions for visual field defects in patients with stroke. Cochrane Database of Systematic Reviews. 2011 Oct 5;(10):CD008388. Review.
12. AIMOLA L, LANE AR, SMITH DT, et al. Efficacy and feasibility of home-based training for individuals with homonymous visual field defects.
Neurorehabilitation Neural Repair. 2014; 28: 207-218 6
PROOF
13. ROWE FJ, BARTON PG, BEDSON E, et al. A randomised controlled trial to compare the clinical and cost-effectiveness of prism glasses, visual search training and standard care in patients with hemianopia following stroke: a protocol. BMJ Open 2014; 4: e005885 doi: 10.1136/bmjopen-2014-005885 14. GIORGI RG, WOODS RI, PELI E. Clinical and laboratory evaluation of
peripheral prism glasses for hemianopia. Optometry and Vision Science. 2009; 86: 492-502
15. LANCASTER GA, DODD S, WILLIAMSON PR. Design and analysis of pilot studies: recommendations for good practice. Journal of Evaluation in Clinical Practice. 2004; 10: 307-12
16. MORGAN TM, CASE LD. Conservative sample size determination for repeated measures analysis of covariance. Annals of Biometrics and Biostatistics, 2013; 1002: 1-6.
17. STIFTER E, KÖNIG F, BAUER P, et al. Reproducibility of measurements – statistical evaluation of the “Radner Reading Charts”. Graefe Arch Klin Ophthalmol. 2004 Jan;242:31-9.
18. RAPHAEL BA, GALETTA KM, JACOBS DA, et al. Validation and test
characteristics of a 10-item neuro-ophthalmic supplement to the NEI-VFQ-25. American Journal of Ophthalmology. 2006; 142: 1026-35
19. LENNON S, JOHNSON L. The modified rivermead mobility index: validity and reliability. Disability and Rehabilitation. 2000; 15: 833-9
20. LINCOLN NB, GLADMAN JR. The extended activities of daily living scale: a further validation. Disability and Rehabilitation. 1992; 14: 41-3
21. BRAZIER JE, WALTERS SJ, NICHOLL JP, KOHLER B. Using the SF-36 and 6
PROOF
22. GANDEK B, WARE JE, AARONSON NK, et al. Cross-validation of item selection and scoring for the SF-12 health survey in nine countries: results from the IQOLA project. International quality of life assessment. Journal of Clinical Epidemiology. 1998; 51: 1181-8
23. ROWE FJ, CONROY EJ, BARTON P, et al. A randomised controlled trial of treatment for post-stroke homonymous hemianopia: screening and
recruitment. Neuro-Ophthalmology. 2016; 40: 1-8
24. BOWERS AR, KEENEY K, PELI E. Community-based trial of a peripheral prism visual field expansion device for hemianopia. Archives of
Ophthalmology. 2008; 126: 657-664
25. HEPWORTH LR, ROWE FJ, HARPER R, et al. Patient reported outcome
measures for visual impairment after stroke: a systematic review. Health and
Quality of Life Outcomes. 2015; DOI: 10.1186/s12955-015-0338-x
25.26. CHARLESWORTH G, BURNELL K, HOE J, ORRELL M, RUSSELL I. Acceptance checklist for clinical effectiveness pilot trials: a systematic approach. BMC Medical Research Methodology. 2013; 13: 1-7
Formatted: Indent: Left: 0.25", Hanging: 0.25"
Formatted: Indent: Left: 0.25", Hanging: 0.25"
Formatted: Font: 12 pt 6
PROOF
Figure 1. Cumulative recruitment graph for all centres
0 20 40 60 80 100 120 N u m b e r o f P a ti e n ts R a n d o m is e d Mar -11 Apr-11 Ma y-11 Jun-11 Jul-11 Aug -11 Sep -11 Oct-11 Nov -11 Dec -11 Jan-12 Feb -12 Mar -12 Apr-12 Ma y-12 Jun-12 Jul-12 Aug -12 Sep -12 Oct-12 Nov -12 Dec -12 Jan-13 Feb -13 Mar -13 Apr-13 Ma y-13 Jun-13 Jul-13 Aug -13
Expected Recruitment 2 6 12 19 25 31 37 43 49 56 62 68 74 80 86 93 99 105
Revised Expected Recruitment 21 24 27 30 33 36 39 42 45 48 52 56 60 64 68
Actual Recruitment 2 5 7 7 9 11 12 13 14 15 16 17 19 21 25 27 27 31 36 36 38 40 45 51 56 63 68 87
PROOF
Acta Neurologica Scandinavica - PROOF 6
PROOF
Follow-Up
♦ Complete
withdrawal* (n=1)
♦ Partial withdrawal#
(n=3)
♦ Loss to follow up
(n=4)
Analysed (n=22) Analysed (n=24)
Analysis
♦ Complete
withdrawal* (n=1)
♦ Partial withdrawal#
(n=1)
♦ Loss to follow up
(n=1)
Allocated to Fresnel prisms (n=27)
♦Received allocated
intervention (n=27)
Allocation
Allocated to visual search training (n=30)
♦Received allocated
intervention (n=30)
Allocated to standard care (n=30)
♦Received allocated
intervention (n=30)
♦ Complete
withdrawal* (n=0)
♦ Partial withdrawal#
(n=5)
♦ Loss to follow up
(n=0)
Analysed (n=25)
Enrolment Assessed for eligibility (n=1171)
Excluded (n=1084)
♦ Not meeting inclusion criteria
(n=993)
♦ Declined to participate (n=91) ♦ Not randomised for other reason
(n=0) Randomised (n=87)
[image:28.612.49.511.81.692.2]PROOF
Treatment
Baseline Characteristic
Fresnel
prisms
Visual
search
training
Standard
care
Total
Patients Randomised
26
30
29
85
Age (years)
Mean (SD), median (IQR),
range
69.9 (12.9)
68.8 (14.4)
35.2 to
90.2
70.9
(11.2)
72.9 (15.2)
40.5 to
89.3
66.2
(11.3)
68.2 (16.2)
42.8 to
85.6
69.0 (11.8)
69.0 (15.3)
36.2 to 90.2
Gender,
Male, n (%)
22 (84.6)
17 (56.7)
20 (69.0)
59 (69.4)
Ethnicity
White n, (%)
Black n, (%)
Asian n, (%)
Mixed n, (%)
25 (96.1)
1 (3.9)
0 (0.0)
0 (0.0)
30 (100.0)
0 (0.0)
0 (0.0)
0 (0.0)
28 (96.6)
1 (3.4)
0 (0.0)
0 (0.0)
83 (97.6)
2 (2.4)
0 (0.0)
0 (0.0)
6 [image:29.612.87.524.89.460.2]PROOF
6PROOF
Baseline Characteristic
Fresnel prisms
Visual search
training
Standard
care
Total
Patients Randomised
26
30
29
85
Stroke onset (days from stroke to randomisation)
Mean (SD)
Median (IQR)
Range
75.5 (45.3)
64.5 (78.0)
18.00 to 173.0
73.8 (49.2)
69.0 (97.0)
13.0 to 172.0
81.2 (48.0)
67.0 (61.0)
15.0 to 186.0
76.9 (47.2)
67.0 (77.0)
13.0 to 186.0
Stroke Type
Ischaemic, n (%)
Haemorrhagic, n (%)
25 (96.2)
1 (3.8)
28 (93.3)
2 (6.7)
28 (96.6)
1 (3.4)
81 (95.3)
4 (4.7)
Side of infarct
Left, n (%)
Right, n (%)
Bilateral, n (%)
9 (34.6)
16 (61.5)
1 (3.9)
17 (56.7)
13 (43.3)
0 (0.0)
11 (37.9)
17 (58.6)
1 (3.5)
37 (43.5)
46 (54.1)
2 (2.4)
Visual field assessment diagnosis:
Homonymous hemianopia left partial, n (%)
Homonymous hemianopia right partial, n (%)
Homonymous hemianopia left complete, n (%)
Homonymous hemianopia right complete, n (%)
Bilateral hemianopia, n (%)
8 (30.8)
3 (11.5)
9 (34.6)
6 (23.1)
0 (0.0)
5 (16.7)
9 (30.0)
8 (26.7)
8 (26.7)
0 (0.0)
8 (27.6)
5 (17.2)
10 (34.5)
6 (20.7)
0 (0.0)
21 (24.7)
17 (20.0)
27 (31.8)
20 (23.5)
0 (0.0)
Barthel index score
Mean (SD)
Median (IQR)
Range
97.5 (5.5)
100.0 (0.0)
80.0 to 100.0
92.7 (11.9)
100.0 (15.0)
65.0 to 100.0
93.3 (14.7)
100.0 (5.0)
45.0 to 100.0
94.4 (11.6)
100.0 (5.0)
45.0 to 100.0
[image:31.612.39.622.84.432.2]PROOF
Table 3. Sample size estimation – total number of patients with complete follow up required per arm (significance level=
0.05)
Type II error (β)
0.1
0.2
0.5
Estimated using data from all visual field assessment methods
Minimally
clinically
important difference
200 degrees
2269
203
98
400 degrees
268
51
25
600 degrees
230
23
11
Estimated using data from modal visual field assessment method: Humphrey
Minimally
clinically
important difference
200 degrees
2132
100
48
400 degrees
233
25
12
600 degrees
215
12
6
Acta Neurologica Scandinavica - PROOF 6
PROOF
Acta Neurologica Scandinavica - PROOF 6
PROOF
Table 4. Descriptive statistics for visual field by group, time-point and assessment method
A: Baseline
Treatment
Timepoint
Perimetry method (degrees
2)
Statistic
Fresnel prisms
(N=26)
Visual search training
(N=30)
Standard care
(N=29)
Total
(N=85)
Baseline
Confrontation
n
mean (sd)
missing
Humphrey Static Esterman
n
mean (sd)
missing
Goldmann Kinetic Esterman
n
mean (sd)
missing
Octopus Static Esterman
n
mean (sd)
missing
Octopus Kinetic Esterman
n
mean (sd)
missing
Other
n
Not done
N
0
NA
NA
13
1382.5 (1190.3)
0
2
779.5 (1102.4)
0
11
1858.5 (1547.8)
0
0
NA
NA
0
0
1
0.0 (NA)
0
14
1428.9 (942.1)
0
5
922.4 (1600.4)
0
9
1525.4 (1169.9)
0
0
NA
NA
1
0
0
NA
NA
12
955.8 (840.8)
0
4
894.3 (1541.9)
0
13
2199.7 (1504.8)
0
0
NA
NA
0
0
1
0.0 (NA)
0
39
1267.9 (1000.3)
0
11
886.2 (1364.7)
0
33
1902.1 (1419.9)
0
0
NA
NA
1
0
PROOF
B: 26 week follow up
assessment
Confrontation
n
mean (sd)
missing
Humphrey Static Esterman
n
mean (sd)
missing
Goldmann Kinetic Esterman
n
mean (sd)
missing
Octopus Static Esterman
n
mean (sd)
missing
Octopus Kinetic Esterman
n
mean (sd)
missing
Not done
n
0
NA
NA
13
1743.5 (1419.6)
0
2
1153.5 (686.6)
0
9
1738.4 (1498.2)
0
0
NA
NA
2
1
3126.0 (NA)
0
11
1542.2 (778.9)
0
5
1792.4 (1940.3)
0
8
1897.6 (1527.3)
0
0
NA
NA
5
0
NA
NA
10
1165.8 (958.6)
0
2
1736.5 (2160.2)
0
10
2101.3 (1514.0)
0
0
NA
NA
5
1
3126.0 (NA)
0
34
1508.5 (1104.5)
0
9
1638.0 (1612.7)
0
27
1920.6 (1461.6)
0
0
NA
NA
14
0 represents complete homonymous hemianopia
6262 is the maximum visual field area score representing a normal hemifield
PROOF
Table 5. Relative change in visual field
A: by treatment group
95% Confidence Interval for
Mean
N
Mean
Std.
Deviation
Std. Error
Lower
bound
Upper bound
Fresnel prisms
24
0.05247973 0.13958788 0.02849326
-0.00646
0.11142
Visual search training
24
0.08152371 0.14880363 0.03037441
0.01869
0.14436
Standard care
22
0.0352049
0.15023043 0.03202924
-0.03140
0.10181
Total
70
0.0570084
0.1453011
0.0173668
0.02236
0.09165
B: ANOVA results for relative change in visual field (comparison across arms)
Source
Sum of squares
DF
Mean
Square
F-test
P-value
Treatment
0.02537506
2
0.01268753 0.59
0.5551
Error
1.43138058
67
0.02136389
Corrected total
1.45675564
69
Acta Neurologica Scandinavica - PROOF 6
PROOF
A: Descriptive statistics by group and time-point
Treatment
Timepoint
Statistic
Fresnel
prisms
(26)
Visual search
training
(N=30)
Standard care
(N=29)
Total
(N=85)
Baseline
n
mean (sd)
median (IQR)
(min, max)
Not done
25
68.5 (16.4)
71.2 (62.1 to
76.9)
(19.8, 93.9)
1
30
60.0 (19.0)
56.4 (44.5 to
78.8)
(21.2, 96.0)
0
28
63.7 (19.4)
63.2 (44.6 to
77.2)
(35.0, 93.0)
1
83
63.8 (18.5)
64.4 (47.0 to
77.7)
(19.8, 96.0)
2
26 follow-up
assessment
n
mean (sd)
median (IQR)
(min, max)
Not done
24
68.2 (18.4)
70.1 (57.1 to
84.7)
(18.2, 96.5)
2
25
68.4 (20.0)
73.4 (53.5 to
83.0)
(25.5, 99.2)
5
19
59.8 (22.7)
63.9 (38.2 to
79.4)
(22.9, 95.2)
10
68
65.9 (20.3)
68.9 (53.2 to
85.6))
(18.2, 99.2)
17
B: Analysis of Covariance (ANCOVA) results for changes in VFQ scores
across arms
Patients who do not have VFQ data for baseline and/or 26 week follow up were not
included
Source
Sum of squares DF Mean Square F-test P-value
Baseline score 13368.70569
1
13368.70569 65.05 <0.0001
Treatment
1294.77789
2
647.38895
3.15
0.0497
Error
12947.44855
63 205.51506
Corrected total 27610.93214
66
Parameter Estimates
Variable
Estimate
Standard
Error
t-value
P-value
Intercept
10.0277624
6
6.92848157
1.45
0.1528
Baseline score
0.80599816
0.09875501
8.16
<0.0001
Visual
Search
10.4170670
4.36870996
2.38
0.0201
[image:37.612.98.526.111.397.2]PROOF
6PROOF
Adverse event
Fresnel prisms
(N=26)
Visual search
training
(N=30)
Standard care
(N=29)
Event
Events:
n
Patients:
n(%)
Events:
n
Patients:
n(%)
Events:
n
Patients:
n(%)
Difficulty with
navigation
2
2 (7.7)
0
0 (0.0)
0
0 (0.0)
Diplopia
5
5 (19.2)
0
0 (0.0)
0
0 (0.0)
Dizziness
2
1 (3.8)
0
0 (0.0)
0
0 (0.0)
Fatigue
0
0 (0.0)
6
1 (3.3)
0
0 (0.0)
Headache
28
6 (23.1)
1
1 (3.3)
0
0 (0.0)
Optical
glare/aberrations
1
1 (3.8)
0
0 (0.0)
0
0 (0.0)
Visual confusion
4
3 (11.5)
0
0 (0.0)
0
0 (0.0)
Total
42
18 (69.2)
7
2 (6.7)
0
0 (0.0)
PROOF
recruitment and grey for actual recruitment.
Figure 2: Flow diagram depicting stages of trial as per CONSORT reporting
guidelines.
Table 1: Baseline demographic characteristics for total trial and per group.
Table 2: Baseline clinical characteristics for total trial and per group.
Table 3: Outcome measure of sample size estimation determined if all visual field
assessment methods were used in a future trial or if only Humphrey visual field
assessment was used.
Table 4: Visual field results descriptive statistics for total trial and per group.
Table 5: Outcome measure of relative change in visual field area by treatment group
and across groups.
Table 6: Outcome measure of VFQ25 questionnaire results for total trial and per
group.
Table 7: Outcome measure of adverse events reported for each group.
PROOF
CONSORT 2010 checklist Page 1
Section/Topic
Item
No
Checklist item
Reported
on page No
Title and abstract
1a Identification as a randomised trial in the title 1
1b Structured summary of trial design, methods, results, and conclusions (for specific guidance see CONSORT for abstracts) 2-3
Introduction
Background and objectives
2a Scientific background and explanation of rationale 3-4
2b Specific objectives or hypotheses 4
Methods
Trial design 3a Description of trial design (such as parallel, factorial) including allocation ratio 5
3b Important changes to methods after trial commencement (such as eligibility criteria), with reasons n/a
Participants 4a Eligibility criteria for participants 5
4b Settings and locations where the data were collected 5-6
Interventions 5 The interventions for each group with sufficient details to allow replication, including how and when they were
actually administered 6-7
Outcomes 6a Completely defined pre-specified primary and secondary outcome measures, including how and when they
were assessed 7
6b Any changes to trial outcomes after the trial commenced, with reasons n/a
Sample size 7a How sample size was determined 8
7b When applicable, explanation of any interim analyses and stopping guidelines n/a
Randomisation: Sequence
generation
8a Method used to generate the random allocation sequence 5
8b Type of randomisation; details of any restriction (such as blocking and block size) 5-6
Allocation concealment mechanism
9 Mechanism used to implement the random allocation sequence (such as sequentially numbered containers),
describing any steps taken to conceal the sequence until interventions were assigned
5
Implementation 10 Who generated the random allocation sequence, who enrolled participants, and who assigned participants to
interventions 5, 8
Blinding 11a If done, who was blinded after assignment to interventions (for example, participants, care providers, those
Acta Neurologica Scandinavica - PROOF 6
PROOF
CONSORT 2010 checklist Page 2
12b Methods for additional analyses, such as subgroup analyses and adjusted analyses 9-10
Results
Participant flow (a diagram is strongly recommended)
13a For each group, the numbers of participants who were randomly assigned, received intended treatment, and
were analysed for the primary outcome 11
13b For each group, losses and exclusions after randomisation, together with reasons 11
Recruitment 14a Dates defining the periods of recruitment and follow-up 11
14b Why the trial ended or was stopped 11
Baseline data 15 A table showing baseline demographic and clinical characteristics for each group 11
Numbers analysed 16 For each group, number of participants (denominator) included in each analysis and whether the analysis was
by original assigned groups 11
Outcomes and estimation
17a For each primary and secondary outcome, results for each group, and the estimated effect size and its
precision (such as 95% confidence interval) 12-13
17b For binary outcomes, presentation of both absolute and relative effect sizes is recommended n/a
Ancillary analyses 18 Results of any other analyses performed, including subgroup analyses and adjusted analyses, distinguishing
pre-specified from exploratory 12-13
Harms 19 All important harms or unintended effects in each group (for specific guidance see CONSORT for harms) 13-14
Discussion
Limitations 20 Trial limitations, addressing sources of potential bias, imprecision, and, if relevant, multiplicity of analyses 17
Generalisability 21 Generalisability (external validity, applicability) of the trial findings 14-15
Interpretation 22 Interpretation consistent with results, balancing benefits and harms, and considering other relevant evidence 14-16
Other information
Registration 23 Registration number and name of trial registry 3
Protocol 24 Where the full trial protocol can be accessed, if available 4
Funding 25 Sources of funding and other support (such as supply of drugs), role of funders 3, 18
*We strongly recommend reading this statement in conjunction with the CONSORT 2010 Explanation and Elaboration for important clarifications on all the items. If relevant, we also recommend reading CONSORT extensions for cluster randomised trials, non-inferiority and equivalence trials, non-pharmacological treatments, herbal interventions, and pragmatic trials. Additional extensions are forthcoming: for those and for up to date references relevant to this checklist, see www.consort-statement.org.
Acta Neurologica Scandinavica - PROOF 6