The Scaling of Diving Time Budgets: Insights from an Optimality Approach.
Author(s): Philip A. Stephens, Chris Carbone, Ian L. Boyd, John M. McNamara,
Karin C. Harding, and Alasdair I. Houston
Source: The American Naturalist, Vol. 171, No. 3 (March 2008), pp. 305-314
Published by:
The University of Chicago Pressfor
The American Society of NaturalistsStable URL:
http://www.jstor.org/stable/10.1086/527491
.
Accessed: 12/08/2014 09:08
Your use of the JSTOR archive indicates your acceptance of the Terms & Conditions of Use, available at
.
http://www.jstor.org/page/info/about/policies/terms.jsp.
JSTOR is a not-for-profit service that helps scholars, researchers, and students discover, use, and build upon a wide range of content in a trusted digital archive. We use information technology and tools to increase productivity and facilitate new forms of scholarship. For more information about JSTOR, please contact [email protected].
.
vol. 171, no. 3 the american naturalist march 2008
The Scaling of Diving Time Budgets: Insights from an
Optimality Approach
Philip A. Stephens,1,*Chris Carbone,2,† Ian L. Boyd,3,‡John M. McNamara,1,§Karin C. Harding,4,k
and Alasdair I. Houston5,#
1. Department of Mathematics, University of Bristol, University Walk, Bristol BS8 1TW, United Kingdom;
2. Institute of Zoology, Zoological Society of London, Regent’s Park, London NW1 4RY, United Kingdom;
3. Sea Mammal Research Unit, Gatty Marine Laboratory, University of St. Andrews, St. Andrews, Fife KY16 8LB, United Kingdom;
4. Department of Marine Ecology, Go¨teborg University, Box 461, 405 30 Go¨teborg, Sweden;
5. School of Biological Science, University of Bristol, Woodland Road, Bristol BS8 1UG, United Kingdom
Submitted May 23, 2007; Accepted August 29, 2007; Electronically published January 16, 2008
abstract: Simple scaling arguments suggest that, among
air-breathing divers, dive duration should scale approximately with mass to the one-third power. Recent phylogenetic analyses appear to con-firm this. The same analyses showed that duration of time spent at the surface between dives has scaling very similar to that of dive duration, with the result that the ratio of dive duration to surface pause duration is approximately mass invariant. This finding runs counter to other arguments found in the diving literature that suggest that surface pause duration should scale more positively with mass, leading to a negative scaling of the dive-pause ratio. We use a pub-lished model of optimal time allocation in the dive cycle to show that optimal decisions can predict approximate mass invariance in the dive-pause ratio, especially if metabolism scales approximately with mass to the two-thirds power (as indicated by some recent analyses) and oxygen uptake is assumed to have evolved to supply
* Corresponding author. Present address: School of Biological and Biomedical Sciences, Durham University, South Road, Durham DH1 3LE, United King-dom; e-mail: [email protected].
† E-mail: [email protected].
‡ E-mail: [email protected].
§ E-mail: [email protected].
k
E-mail: [email protected]. #E-mail: [email protected].
Am. Nat. 2008. Vol. 171, pp. 305–314.䉷2008 by The University of Chicago. 0003-0147/2008/17103-42620$15.00. All rights reserved.
DOI: 10.1086/527491
the body tissues at the required rate. However, emergent scaling rules are sensitive to input parameters, especially to the relationship be-tween the scaling of metabolism and oxygen uptake rate at the sur-face. Our results illustrate the utility of an optimality approach for developing predictions and identifying key areas for empirical re-search on the allometry of diving behavior.
Keywords: allometry, diving physiology, marginal value theorem,
metabolic scaling, optimal foraging, symmorphosis.
Species that forage underwater but are constrained to breathe at the surface exhibit a range of striking behavioral and physiological adaptations to their way of life (Boyd 1997; Kooyman and Ponganis 1997). In spite of the variety of adaptations that exists, the constraints imposed by for-aging underwater are powerful selective forces, leading to a high degree of convergence in aspects of physiological performance (Halsey et al. 2006a). Understanding the lim-its imposed by this environment is crucial for applications as diverse as explaining breeding strategies (Houston et al. 2007), determining the energetic viability of species in changing marine environments (Winship et al. 2002), and understanding the evolution of brain size among marine mammals (Marino et al. 2006). One approach to deter-mining the constraints imposed on breath-hold divers by their lifestyle is to examine cross-taxa relationships be-tween diving performance and body size.
Calder 1971). Therefore, dive duration should increase with mass to the one-third power (assuming, implicitly, that the fraction of potential oxygen stores used during typical dives is constant across species).
Halsey et al. (2006b) also found that duration of time spent at the surface between dives scaled with mass to the one-third power, such that the ratio of time spent under-water to that spent at the surface (the dive-pause ratio; Dewar 1924) appeared approximately mass invariant. This result is less readily explained. Indeed, Halsey et al. (2006b) summarized arguments prevalent in the diving literature, suggesting that surface duration would increase with body mass more rapidly than dive duration, leading to a negative relationship between dive-pause ratio and body mass. Al-though these arguments are superficially compelling, they are based on simplistic assumptions regarding the scaling of oxygen uptake with mass (see further below). By con-trast, past theoretical and experimental research on diving behavior implies that, in addition to the importance of oxygen stores and average metabolic rate, diving time bud-gets are affected by rates of oxygen uptake and specific rates of oxygen use at different stages in the dive cycle (Houston and Carbone 1992; Carbone and Houston 1994). One outcome of those findings is that diving time budgets are unlikely to be easily explained on the basis of simple arguments.
In this article, we develop an analysis to explore how diving time budgets are related to body mass. Our analysis is based on an optimal diving model (Houston and Car-bone 1992) and observed diving depths (Halsey et al. 2006a, 2006b). We use this approach to assess variation in diving time budgets and, in particular, the relationship between the dive-pause ratio and the body mass of air-breathing divers. The model is a simple representation of the allocation of time during the dive cycle, based on the assumption that oxygen consumption over the whole cycle is balanced by oxygen intake while at the surface. This generally assumes aerobic diving, an assumption that is well supported for the majority of dives (Kooyman 1966; Kooyman et al. 1983; Butler 2006; Green et al. 2007; but see, e.g., Carbone and Houston 1996; Mori 1999 for con-sideration of divers performing anaerobically). It is as-sumed that a diver will maximize its fitness by maximizing the proportion of its time during the dive cycle that is spent foraging. By considering plausible allometric rela-tionships for the model’s main parameters, we are able to assess the implications of optimal diving behavior for the dive-pause ratio.
Methods
We begin by outlining the basic structure of the model, before going on to describe plausible scaling relationships
for its underlying parameters. For further details of the model, see Houston and Carbone (1992).
Model Outline
Dives are assumed to be of the “square” type, composed of descent, a relatively horizontal foraging phase, and as-cent; square dives account for the vast majority of observed dives in a wide range of taxa (Schreer et al. 2001). The complete dive cycle is divided into three components:t
is the time spent traveling between the surface and the foraging stratum and back again, t is the time spent for-aging, and s is the time spent at the surface. It is assumed that the oxygen used during these three periods depends on the different rates (per unit time) of metabolic oxygen consumption, m1, m2, and m3, respectively.
During time at the surface, it is assumed that oxygen concentration in the tissues increases but that it does so at a rate that is proportional to the difference in oxygen partial pressures between the air and the oxygen storage tissues (Wilson and Quintana 2004). As a result, the rate of replenishment of oxygen stores diminishes with time (Kramer 1988; Parkes et al. 2002; Halsey et al. 2003). From this, it follows that a plausible ordinary differential equa-tion for rate of oxygen store replenishment after time s at the surface is
dx(s)
[ ]
paK⫺x(s) .
ds
Whenx(0)p0, this gives the following function to de-scribe the replenishment of oxygen stores (Houston and Carbone 1992):
⫺as
x(s)pK(1⫺e ), (1)
where x(s) is oxygen stores accumulated by a diver that spends time s at the surface (net of the oxygen used while at the surface, m3s), K is the upper limit to the oxygen that can be stored (i.e., total oxygen storage capacity), and
a is the initial rate of oxygen replenishment (as a pro-portion of K). Over a series of dives, the total oxygen stores gained during surface periods are assumed to bal-ance oxygen use during the dive (Wilson and Quintana 2004), so
x(s)pm1t⫹m t2
and
x(s)⫺m1t
tp . (2)
The Scaling of Diving Time Budgets 307
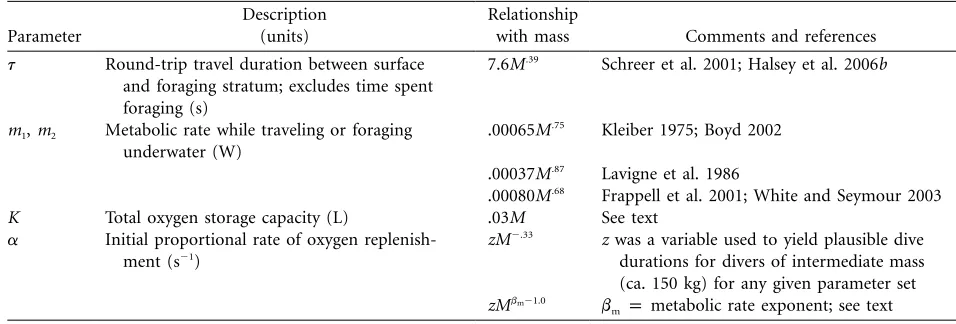
Table 1:Allometry of parameters used to solve equation (5)
Parameter
Description (units)
Relationship
with mass Comments and references
t Round-trip travel duration between surface and foraging stratum; excludes time spent foraging (s)
7.6M.39 Schreer et al. 2001; Halsey et al. 2006b
m1, m2 Metabolic rate while traveling or foraging
underwater (W)
.00065M.75 Kleiber 1975; Boyd 2002
.00037M.87 Lavigne et al. 1986
.00080M.68 Frappell et al. 2001; White and Seymour 2003
K Total oxygen storage capacity (L) .03M See text
a Initial proportional rate of oxygen replenish-ment (s⫺1)
zM⫺.33 z was a variable used to yield plausible dive durations for divers of intermediate mass (ca. 150 kg) for any given parameter set bm⫺1.0
zM bmpmetabolic rate exponent; see text
Note: See text for further details.
It is assumed that the diver will maximize the proportion of time spent foraging,t/(t⫹t⫹s), which is equivalent to maximizing
t
pp .
(s⫹t)
Using equation (2), we have
x(s)⫺m1t
p(s)p . (3)
m (s2 ⫹t)
From the optimality condition,pp0, so
x(s)⫺m1tpx (s)(s⫹t). (4)
Using equation (1), we have an equation for the optimal value of s, termeds∗:
∗ ∗
⫺as ⫺as ∗
K(1⫺e )⫺m1t⫺aKe (s ⫹t)p0. (5)
This equation can be solved numerically to yields∗, the optimal surface duration, as a function of the equation’s other parameters (t, m1, K, anda). Given an estimate for
m2, values of s∗ can be substituted in equation (2), in order to yield estimates oft∗(the period of the dive that is spent foraging). Thus, given certain assumptions about the scaling of the other parameters of equation (5),s∗and can be derived for any diver body mass. Together with ∗
t
an empirical estimate of the scaling of t (Halsey et al. 2006b), therefore, it is possible to use the optimality model to determine expected allometric relationships for surface duration, total dive duration, and dive-pause ratio.
Allometry of Model Parameters
We are interested in the allometric relationships (for sur-face duration, dive duration, and dive-pause ratio) that emerge from the model, given assumed relationships about the allometries of underlying parameters. In all our dis-cussions of allometric relationships, we use the notation , where p is the parameter subject to allometric
bp
ppb Mp
prediction, bpis a coefficient, andbpis the allometric ex-ponent. To determine how s∗ and t∗ are likely to scale with body mass, we need to know the scaling of other components of equation (5), including t, m1, K, and a, as well as the scaling of m2. The principal relationships that we use are summarized in table 1, but, where nec-essary, we discuss the derivation of those relationships in greater detail.
Scaling of Travel Duration (t)
on species of disparate sizes suggest that, although speeds and dive angles may differ somewhat between species (Wa-tanuki et al. 2006), speeds of descent and ascent are un-affected by size (Butler and Jones 1997; Ropert-Coudert et al. 2002; Beck et al. 2003; Davis et al. 2003), and we assumed an average vertical speed of 1 m s⫺1(Schreer et al. 2001, p. 146).
Scaling of Metabolic Rates (m1, m2)
The allometry of metabolic rates is very hard to determine with conviction (Glazier 2005), and a wide range of ex-ponents (here termedbm) is obtained when studies using different methodologies are included (Boyd 2002). Boyd (2002) notes that for predictions of basal metabolic rate (BMR in W), the Kleiber (1975) equation remains useful and is given as BMR 0.75. However, data have
p3.39M
suggested relationships with very different allometric ex-ponents, varying frombmp0.68for birds and mammals (Frappell et al. 2001; White and Seymour 2003) to for phocid seals (Lavigne et al. 1986).
Conse-bmp0.87
quently, we examined cases using all three of these possible relationships. Data from 26 studies of field metabolic rates in marine mammals show mean and median energy ex-penditures in the region of 3.6 and 3.4 times predicted BMR, respectively (Boyd 2002). These probably under-estimate metabolic rate during active diving, although to what extent is unclear and depends on the methods by which diving metabolic rate was measured (de Leeuw 1996). As an approximate, baseline estimate of metabolism during a dive, we multiplied all relevant constants by a factor of 3.75 (representing3.75#predicted BMR), but we examined model sensitivity to this factor (see below). To obtain the relationships shown in table 1, we converted metabolic rates from watts into liters of O2 per second, assuming an energy yield from metabolism of 19,670 J L⫺1 O2 (Boyd 2002). In the absence of more detailed infor-mation, we assume the same scaling relationships for m1 and m2.
Scaling of Oxygen Storage Capacity (K)
Total oxygen storage capacity is generally believed to scale approximately with mass, and, although some species ap-pear to have exceptionally high oxygen storage capacities (e.g., Weddell seals, Leptonychotes weddellii; Ponganis et al. 1993), median values for mass-specific oxygen stores ap-pear to be closer to 40 mL kg⫺1(Gentry et al. 1986; Butler 2001; McIntyre et al. 2002; Richmond et al. 2006). Oxygen is always required for the central nervous system and heart (Butler 2006). Consequently, the dive lactate threshold (the dive duration at which postdive blood lactate concentra-tion increases, potentially invalidating our assumpconcentra-tion of
oxygen balance over the dive cycle) will be reached before oxygen stores are completely exhausted (Butler and Jones 1997). Because little is known about the proportion of oxygen stores that can be used before equation (1) is in-validated, we assumed a value of 75% (see, e.g., Hudson and Jones 1986), suggesting a figure of 30 mL kg⫺1 for oxygen stores available during diving.
Scaling of the Initial Rate of Oxygen Uptake (a)
The initial rate of oxygen replenishment,a(expressed as a proportion of total available stores, K), depends on the speed of oxygen uptake. Empirical data with which to assess plausible scaling patterns for this parameter are lim-ited (see further in “Discussion”). However, theory sug-gests two possible scaling relationships for the initial rate of oxygen replenishment. First, ignoring thatais relative to K, oxygen uptake might be expected to be limited by the surface area available for gaseous exchange (implying a scaling exponent of approximately two-thirds). Alter-natively, the principle of symmorphosis (Weibel et al. 1998) has been used to argue that each component of the oxygen supply chain must have evolved to supply oxygen at the rate required by the muscles (Taylor and Weibel 1981); consequently, we might expect oxygen uptake to scale with the same exponent as metabolism (see above). Asais a rate proportional to K (which scales with M1.0
),
a itself is likely to scale with an allometric exponent in the region of bap⫺0.33 if the surface area argument holds orbapbm⫺1if symmorphosis holds.
Results
The allometric relationships shown in table 1 yielded six possible parameter sets: the three metabolic rate relation-ships witha∝M⫺0.33and the three metabolic rate rela-tionships witha∝Mbm⫺1 (wherebm is the exponent for the scaling of metabolism). For each set of relationships and for body masses ranging from 10 to over 1,250 kg, we determined surface durations that would maximize time available for foraging during the dive cycle. The con-sequences of these calculations for the allometry of dive parameters are summarized in table 2.
The Scaling of Diving Time Budgets 309
Table 2:Allometry of input and emergent dive parameters in the optimal diving model
Parameter set
Underlying allometries Emergent allometries
m1, m2 a
Dive duration (t⫹t)
Surface duration (s)
Dive-pause ratio ([t⫹t]/s) 1 .00065M.75 .090M⫺.33 32.94M.28 13.38M.40 2.46M⫺.12 2 .00037M.87 .080M⫺.33 52.09M.18 11.49M.45 4.53M⫺.28 3 .00080M.68 .075M⫺.33 27.04M.34 16.82M.37 1.61M⫺.03 4 .00065M.75 .060M⫺.25 31.72M.28 18.34M.34 1.73M⫺.05 5 .00037M.87 .040M⫺.13 49.95M.19 20.31M.29 2.45M⫺.10 6 .00080M.68 .075M⫺.32 27.07M.34 16.84M.36 1.61M⫺.02 Relationships from table 2 of
Halsey et al. 2006b 21.20M.37 18.80M.33 1.80M.04
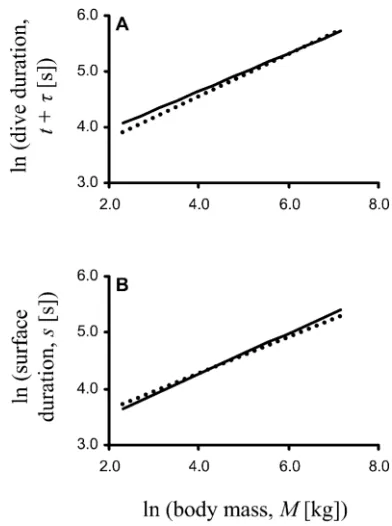
Figure 1: Allometry of dive parameters emerging from model 6 (see table 2; solid lines) and determined by Halsey et al. (2006b; dotted lines): (A) dive duration and (B) surface duration, both as a function of body mass.
and⫺0.02, respectively). Because the outcomes of these parameter sets matched empirical observation most closely, and because the two sets were highly similar, we used parameter set 6 for further illustration. For dive du-ration and surface dudu-ration, the relationships emerging from parameter set 6 are illustrated in figure 1.
In addition to the allometric exponents explaining var-iation in metabolism andawith body size, it is important to examine model sensitivity to a number of other param-eters. Using parameter set 6, we varied each remaining parameter independently, observing the consequences for the three emergent allometric exponents (fig. 2). As ex-pected, none of the coefficients had a strong effect on emergent allometries within the ranges examined. The only substantially nonlinear effects of varying a coefficient resulted when the coefficient of oxygen stores, bK, was reduced to a low level. However, as stated above, such low levels of usable oxygen are not well supported by empirical data. The effects of varying allometric exponents were more pronounced (fig. 2E, 2F). Scaling of the component of dive duration that is spent traveling (t) is difficult to determine, and here we have based our estimates on the scaling of dive depth. Given the sensitivity of outcomes to this (fig. 2E), further work might usefully examine the scaling of transit times more accurately. Outcomes were especially sensitive tobK, the exponent determining how oxygen stores scale with mass (fig. 2F). Although oxygen stores are generally believed to scale proportionally with mass, there is some evidence for diving animals having exponents greater than unity (i.e.,b 11.0; Hudson and
K
Jones 1986). A relatively small increase (ca. 5%) in bK could lead to emergent exponents using parameter set 6 that match much more closely those found by Halsey et al. (2006b).
Discussion
In this article, we have shown that an optimal foraging model can be used to refine predictions, identifying
[image:6.612.328.524.392.655.2]behav-Figure 2:Sensitivity of parameter set 6 to variation in individual parameters. All panels show emergent allometric exponents of dive duration (dotted lines, left-hand Y-axes), surface duration (dashed lines, left-hand Y-axes), and dive-pause ratio (solid lines, right-hand Y-axes). Each of the key parameters in equation (5) is predicted by a relationship of the form , where p is the parameter, bpis a coefficient, andbpis the
bp ppb Mp
allometric exponent. Results of specific scenarios for the allometric exponents of metabolism (bm) and oxygen uptake (ba) are shown in table 2.
Here we focus on sensitivity to (A) coefficient of metabolism (bm), (B) coefficient of oxygen uptake (ba), (C) coefficient of travel time (bt), (D) coefficient of oxygen stores (bK), (E) allometric exponent of travel time (bt), and (F) allometric exponent of oxygen stores (bK). All other parameters are estimated as indicated for parameter set 6 in table 2. In each panel, these standard parameter values are indicated by the triangle. Note that in A, the range of bmillustrated is equivalent to in-water metabolism varying from1#BMRto2#BMR. In E, the range ofbtillustrated is approximately
equivalent to 1 SE either side of the mean value reported by Halsey et al. (2006b).
ioral traits. Using allometric relationships (with empirical and theoretic support) for dive depth and physiological parameters, we have shown that it is possible to explain the approximate mass invariance of dive-pause ratios among breath-hold divers. Our results are sensitive to the
allometric exponents of all input parameters, however, suggesting that those exponents would need to be deter-mined with conviction before the insights gained can be treated with complete confidence.
[image:7.612.95.511.86.527.2]The Scaling of Diving Time Budgets 311
usage hypothesis (Butler and Jones 1982), but departures from the expectations of that hypothesis (that dive du-ration should scale with an exponent of1⫺bm) become more marked when metabolism scales more steeply (i.e.,
bmincreases). The allometric exponent for the dive-pause ratio,br, was also closer to mass invariance for lower values ofbm, particularly where the initial rate of oxygen uptake was modeled as scaling with mass to the power bm⫺1 (which might be expected on the basis of symmorphosis). For the six parameter sets examined,brdid not approach the low positive value determined by Halsey et al. (2006b). This discrepancy could be attributed to uncertainty in the input parameters (see fig. 2F in particular). In reality, how-ever, even a highly approximate match between theory and empirical data is surprising, given the variation inherent in the empirical data set. For example, the data set must include divers with dive patterns other than the square dives of Schreer et al. (2001), as well as single-prey loaders (Thompson and Fedak 2001), lunge feeders (Goldbogen et al. 2006), species with an additional component of aerial travel after surfacing (Falk et al. 2002), and, potentially, data recorded during periods of anaerobic activity. This type of inherent variation suggests that pursuing an exact match between theory and data with a model based on a single diving strategy (constant-rate, pelagic foragers div-ing aerobically) is unlikely to yield success.
As we noted at the outset, Halsey et al. (2006b) devel-oped simple arguments to suggest that dive-pause ratios would be expected to decrease with increasing mass. It is worth considering their argument in greater detail. Spe-cifically, Halsey et al. reasoned that dive duration would scale positively with mass because K scales with bKp , while metabolism scales with . Thus, potential
1.0 b !1.0
m
dive duration scales withb ⫺b 10. They further
sug-K m
gested that longer dive durations among larger-bodied di-vers would lead to greater absolute oxygen use and, owing to diminishing returns in restoring depleted oxygen re-serves (Kramer 1988; Houston and Carbone 1992), ex-ponentially longer surface durations. Although it is likely that Halsey et al.’s (2006b) argument holds when consid-ering longer dives among animals of equal body mass, it is not clear why it should apply to longer dives among animals of greater body mass. In particular, it assumes that oxygen uptake ability does not scale with mass, so that the time taken to restore some absolute volume of oxygen reserves is the same in two divers of different size.
In contrast to Halsey et al. (2006b), we have shown that the scaling of surface duration (and consequent scaling of the dive-pause ratio) is critically dependent on the scaling ofa, the initial proportional rate of oxygen replenishment. Consider, for example, the case where all divers use some fixed proportion (v) of their oxygen reserves during a dive. In this case, we can rewrite equation (1) as
⫺as
vKpK(1⫺e ),
so
⫺ln (1⫺v)
sp ,
a
suggesting that surface duration should scale with ⫺ba
(the allometric exponent for the initial rate of oxygen re-plenishment). This suggests that where maximum oxygen uptake is sufficient to meet the demands of metabolism (i.e.,ascales with bapbm⫺1; see “Methods”), surface duration should scale with1⫺bm. Given that this is the same as the scaling of dive duration (see above), then this simple argument, based on the use of a constant propor-tion of oxygen stores regardless of body mass, does predict a mass-invariant dive-pause ratio. As we showed (table 2), the optimal dive model does not always predict the same outcomes as these simple arguments. In particular, the proportional use of oxygen reserves, v (and consequent surface duration), is sensitive to the metabolic rate mass exponent (bm), suggesting that approximate mass invari-ance of dive-pause ratios will be observed only whenbm
is toward the low end of its suggested range (i.e., around 0.6–0.7; fig. 3). This illustrates two important points. First, it appears that a mass-invariant dive-pause ratio depends on approximate mass invariance in v, the proportion of oxygen storage potential that is used in a dive. Second, although there is no a priori reason to assume thatvshould be mass invariant, for metabolic exponents in the region of 0.6–0.7, the optimality model does suggest that this would be approximately the case.
The findings of our model depend critically on input parameters, and, consequently, data limitations are im-portant. Among the input parameters, perhaps the most weakly supported are those that model the scaling of a, the initial rate of oxygen uptake (net of oxygen use at the surface). There have been relatively few attempts to mea-sure this rate (but see Parkes et al. 2002; Halsey et al. 2003), and, certainly, too few data exist to determine the broad-scale allometric relationships necessary for our pur-poses here. Assessing data from individual studies carries the risk of focusing on the idiosyncrasies of a small number of species, rather than appreciating the broad, cross-taxa patterns necessary for allometric prediction. Moreover, it would be difficult to determine oxygen uptake and storage parameters applicable to the model from studies that use variable dive durations, as implied parameters depend on the degree to which oxygen stores have been depleted by the preceding dive (see Halsey et al. 2003, fig. 4).
Figure 3:Comparison between predictions of simple scaling arguments (dotted lines) and emergent predictions of the optimal diving model (solid lines). The simple scaling arguments are based on the assumption that (A) proportional use of oxygen stores does not vary with body mass, and they predict that both (B) dive duration and (C) surface duration will scale with1⫺bm, while (D) dive-pause ratio remains mass invariant. By contrast, the optimality model suggests that proportional use of oxygen stores will be sensitive to the scaling of metabolic rate, so that the dive-pause ratio will be close to mass invariance only when the metabolic mass exponent is low (in the region of0.6≤bm≤0.7).
to modify this type of framework for benthic feeders, as well as single-prey loaders or lunge feeders, in order to determine whether those activities give rise to similar emergent allometries. More intriguingly, we have been constrained to using empirical data on travel distance in our model. Clearly, dive depth (and hence travel time) among benthic foragers is dictated by the water depth. However, for pelagic species, it remains unclear why larger species often dive so deeply. Mori (1998, 2002) showed that where food is normally distributed with depth, larger divers are expected to dive closer to the depth of maximal food availability. Moreover, when food is abundant in rel-atively shallow waters, the efficiency of smaller divers may be greater than that of larger divers; this will select for smaller size in areas where food is exploited in shallow waters (Mori 2002). Nevertheless, many large divers dive to such depths that they must pass through some of the most productive parts of the ocean. It is possible that theoretical models could yet shed additional light on the scaling of dive depth with size. For example, simple geo-metric models of the scaling of day range in terrestrial mammals (Garland 1983; Carbone et al. 2005) illustrate the importance of the scaling of food items taken in re-lation to consumer mass and the density of those items. Future research could fruitfully consider whether these parameters are also associated with the scaling of dive depth among breath-hold divers. Finally, agreement be-tween empirical estimates of the scaling of the dive-pause ratio and those emerging from the model appears to de-pend on mass invariance in the proportion of potential oxygen stores used during typical dives. Whether this re-quirement is supported by empirical data will have im-portant implications for our understanding of diving behavior.
Acknowledgments
Thanks to two anonymous reviewers for constructive com-ments on an earlier draft. We are grateful to the Natural Environment Research Council for support with this work (grant NER/A/S/2003/00616).
Literature Cited
Bainbridge, R. 1958. The speed of swimming of fish as related to size and to the frequency and amplitude of the tail beat. Journal of Experimental Biology 35:109–133.
Beck, C. A., W. D. Bowen, J. I. McMillan, and S. J. Iverson. 2003. Sex differences in the diving behaviour of a size-dimorphic capital breeder: the grey seal. Animal Behaviour 66:777–789.
Bennett, P. M., and P. H. Harvey. 1987. Active and resting metabolism in birds: allometry, phylogeny and ecology. Journal of Zoology (London) 213:327–363.
The Scaling of Diving Time Budgets 313
———. 2002. Energetics: consequences for fitness. Pages 247–277
in A. R. Hoelzel, ed. Marine mammal biology. Blackwell Science,
Oxford.
Brett, J. R. 1965. Relation of size to rate of oxygen consumption and sustained swimming speed of sockeye salmon (Oncorhynchus
nerka). Journal of the Fisheries Research Board of Canada 22:1491–
1501.
Butler, P. J. 2001. Diving beyond the limits. News in Physiological Sciences 16:222–227.
———. 2006. Aerobic dive limit: what is it and is it always used appropriately? Comparative Biochemistry and Physiology A 145: 1–6.
Butler, P. J., and D. R. Jones. 1982. The comparative physiology of diving in vertebrates. Advances in Comparative Physiology and Biochemistry 8:179–364.
———. 1997. Physiology of diving of birds and mammals. Physi-ological Reviews 77:837–899.
Carbone, C., and A. I. Houston. 1994. Patterns in the diving behavior of the pochard, Aythya farina: a test of an optimality model. Animal Behaviour 48:457–465.
———. 1996. The optimal allocation of time over the dive cycle: an approach based on aerobic and anaerobic respiration. Animal Be-haviour 51:1247–1255.
Carbone, C., G. Cowlishaw, N. J. B. Isaac, and J. M. Rowcliffe. 2005. How far do animals go? determinants of day range in mammals. American Naturalist 165:290–297.
Davis, R. W., L. A. Fuiman, T. M. Williams, M. Horning, and W. Hagey. 2003. Classification of Weddell seal dives based on 3-dimensional movements and video-recorded observations. Marine Ecology Progress Series 264:109–122.
de Leeuw, J. J. 1996. Diving costs as a component of daily energy budgets of aquatic birds and mammals: generalizing the inclusion of dive-recovery costs demonstrated in tufted ducks. Canadian Journal of Zoology 74:2131–2142.
Dewar, J. M. 1924. The bird as a diver. Witherby, London. Domenici, P. 2001. The scaling of locomotor performance in
predator-prey encounters: from fish to killer whales. Comparative Biochemistry and Physiology A 131:169–182.
Falk, K., S. Benvenuti, L. Dall’Antonia, G. Gilchrist, and K. Kampp. 2002. Foraging behaviour of thick-billed murres breeding in dif-ferent sectors of the North Water polynya: an inter-colony com-parison. Marine Ecology Progress Series 231:293–302.
Frappell, P. B., D. S. Hinds, and D. F. Boggs. 2001. Scaling of re-spiratory variables and the breathing pattern in birds: an allometric and phylogenetic approach. Physiological and Biochemical Zool-ogy 74:75–89.
Garland, T., Jr. 1983. Scaling the ecological cost of transport to body mass in terrestrial mammals. American Naturalist 121:571–587. Gentry, R. L., D. P. Costa, J. P. Croxall, J. H. M. David, R. W. Davis,
G. L. Kooyman, P. Majluf, et al. 1986. Synthesis and conclusions. Pages 220–264 in R. L. Gentry and G. L. Kooyman, eds. Fur seals: maternal strategies on land and at sea. Princeton University Press, Princeton, NJ.
Glazier, D. S. 2005. Beyond the “3/4-power law”: variation in the intra- and interspecific scaling of metabolic rate in animals. Bi-ological Reviews 80:611–662.
Goldbogen, J. A., J. Calambokidis, R. E. Shadwick, E. M. Oleson, M. A. McDonald, and J. A. Hildebrand. 2006. Kinematics of foraging dives and lunge-feeding in fin whales. Journal of Experimental Biology 209:1231–1244.
Green, J. A., L. G. Halsey, P. J. Butler, and R. L. Holder. 2007. Es-timating the rate of oxygen consumption during submersion from the heart rate of diving animals. American Journal of Physiology 292:R2028–R2038.
Halsey, L., A. Woakes, and P. Butler. 2003. Testing optimal foraging models for air-breathing divers. Animal Behaviour 65:641–653. Halsey, L. G., T. M. Blackburn, and P. J. Butler. 2006a. A comparative
analysis of the diving behaviour of birds and mammals. Functional Ecology 20:889–899.
Halsey, L. G., P. J. Butler, and T. M. Blackburn. 2006b. A phylogenetic analysis of the allometry of diving. American Naturalist 167:276– 287.
Houston, A. I., and C. Carbone. 1992. The optimal allocation of time during the diving cycle. Behavioral Ecology 3:255–265.
Houston, A. I., P. A. Stephens, I. L. Boyd, K. C. Harding, and J. M. McNamara. 2007. Capital or income breeding? a theoretical model of female reproductive strategies. Behavioral Ecology 18:241–250. Hudson, D. M., and D. R. Jones. 1986. The influence of body-mass on the endurance to restrained submergence in the Pekin duck. Journal of Experimental Biology 120:351–367.
Kleiber, M. 1975. The fire of life: an introduction to animal energetics. Krieger, Huntington, NY.
Kooyman, G. L. 1966. Maximum diving capacities of Weddell seal
Leptonychotes weddelli. Science 151:1553–1564.
Kooyman, G. L., and P. J. Ponganis. 1997. The challenges of diving to depth. American Scientist 85:530–539.
Kooyman, G. L., M. A. Castellini, R. W. Davis, and R. A. Maue. 1983. Aerobic diving limits of immature Weddell seals. Journal of Comparative Physiology 151:171–174.
Kramer, D. L. 1988. The behavioral ecology of air breathing by aquatic animals. Canadian Journal of Zoology 66:89–94. Lasiewski, R. C., and W. A. Calder. 1971. Preliminary allometric
analysis of respiratory variables in resting birds. Respiration Phys-iology 11:152–166.
Lavigne, D. M., S. Innes, G. A. J. Worthy, K. M. Kovacs, O. J. Schmitz, and J. P. Hickie. 1986. Metabolic rates of seals and whales. Ca-nadian Journal of Zoology 64:279–284.
Marino, L., D. Sol, K. Toren, and L. Lefebvre. 2006. Does diving limit brain size in cetaceans? Marine Mammal Science 22:413– 425.
McIntyre, I. W., K. L. Campbell, and R. A. MacArthur. 2002. Body oxygen stores, aerobic dive limits and diving behaviour of the star-nosed mole (Condylura cristata) and comparisons with non-aquatic talpids. Journal of Experimental Biology 205:45–54. McKechnie, A. E., and B. O. Wolf. 2004. The allometry of avian basal
metabolic rate: good predictions need good data. Physiological and Biochemical Zoology 77:502–521.
Mori, Y. 1998. Optimal choice of foraging depth in divers. Journal of Zoology (London) 245:279–283.
———. 1999. The optimal allocation of time and respiratory me-tabolism over the dive cycle. Behavioral Ecology 10:155–160. ———. 2002. Optimal diving behaviour for foraging in relation to
body size. Journal of Evolutionary Biology 15:269–276. Parkes, R., L. G. Halsey, A. J. Woakes, R. L. Holder, and P. J. Butler.
2002. Oxygen uptake during post dive recovery in a diving bird
Aythya fuligula: implications for optimal foraging models. Journal
of Experimental Biology 205:3945–3954.
metabolic rates, postdive end-tidal Po2’s, and blood and muscle
oxygen stores. Physiological Zoology 66:732–749.
Richmond, J. P., J. M. Burns, and L. D. Rea. 2006. Ontogeny of total body oxygen stores and aerobic dive potential in Steller sea lions (Eumetopias jubatus). Journal of Comparative Physiology B 176: 535–545.
Ropert-Coudert, Y., A. Kato, K. Sato, Y. Naito, J. Baudat, C. A. Bost, and Y. Le Maho. 2002. Swim speed of free-ranging Ade´lie penguins
Pygoscelis adeliae and its relation to the maximum depth of dives.
Journal of Avian Biology 33:94–99.
Sato, K., Y. Watanuki, A. Takahashi, P. J. O. Miller, H. Tanaka, R. Kawabe, P. J. Ponganis, et al. 2007. Stroke frequency, but not swimming speed, is related to body size in free-ranging seabirds, pinnipeds and cetaceans. Proceedings of the Royal Society B: Bio-logical Sciences 274:471–477.
Schreer, J. F., K. M. Kovacs, and R. J. O. Hines. 2001. Comparative diving patterns of pinnipeds and seabirds. Ecological Monographs 71:137–162.
Taylor, C. R., and E. R. Weibel. 1981. Design of the mammalian respiratory system. 1. Problem and strategy. Respiration Physiology 44:1–10.
Thompson, D., and M. A. Fedak. 2001. How long should a dive last?
a simple model of foraging decisions by breath-hold divers in a patchy environment. Animal Behaviour 61:287–296.
Watanuki, Y., S. Wanless, M. Harris, J. R. Lovvorn, M. Miyazaki, H. Tanaka, and K. Sato. 2006. Swim speeds and stroke patterns in wing-propelled divers: a comparison among alcids and a penguin. Journal of Experimental Biology 209:1217–1230.
Weibel, E. R., R. C. Taylor, and L. Bolis. 1998. Principles of animal design. Cambridge University Press, Cambridge.
White, C. R., and R. S. Seymour. 2003. Mammalian basal metabolic rate is proportional to body mass2/3. Proceedings of the National
Academy of Sciences of the USA 100:4046–4049.
Williams, T. M., and G. A. J. Worthy. 2002. Anatomy and physiology: the challenge of aquatic living. Pages 73–97 in A. R. Hoelzel, ed. Marine mammal biology. Blackwell Science, Oxford.
Wilson, R. P., and F. Quintana. 2004. Surface pauses in relation to dive duration in imperial cormorants: how much time for a breather? Journal of Experimental Biology 207:1789–1796. Winship, A. J., A. W. Trites, and D. A. S. Rosen. 2002. A bioenergetic
model for estimating the food requirements of Steller sea lions
Eumetopias jubatus in Alaska, USA. Marine Ecology Progress Series
229:291–312.