Supplemental Information:
Task-specific transfer of perceptual
learning across sensory modalities
[image:1.595.59.537.185.536.2]David P. McGovern, Andrew T. Astle, Sarah L. Clavin and Fiona N. Newell
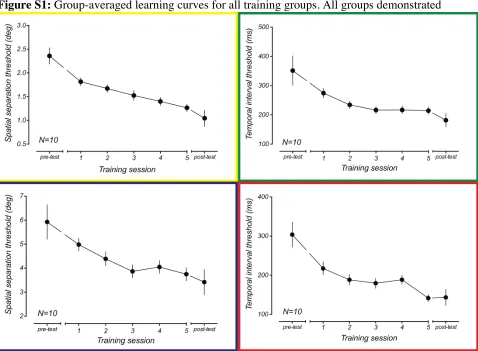
Figure S1: Group-averaged learning curves for all training groups. All groups demonstrated
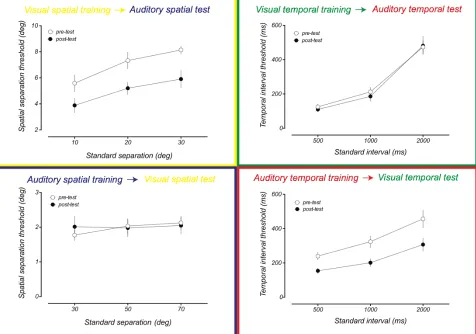
Figure S2: Discrimination thresholds for crossmodal conditions. Participants trained on visual
spatial and auditory temporal tasks (yellow and red boxes, respectively) display lower thresholds in the other sensory modality following training. This was not the case for those who trained on the visual temporal or auditory spatial tasks (green and blue boxes, respectively). Error bars indicate ±1 SEM across participants.
Supplemental Experimental Procedures
Participants
Forty-three volunteers participated in the study (19 male, mean age=22 years), all
of whom were recruited from the student population of Trinity College Dublin. Three participants were excluded from the study after the first session as a reliable
threshold could not be obtained on one or more of the tasks, leaving a total of 40
participants. All participants had self-reported normal hearing and normal or
corrected-to-normal vision and were naïve to the purposes of the experiment. All recruitment and experimental procedures were approved by the School of
Psychology, Research Ethics Committee, Trinity College Dublin in accordance
Stimuli
Visual stimuli consisted of a pair of identical Gaussian blobs presented on a
background of mean luminance (47 cd/m2). The size of each Gaussian blob was
defined by its standard deviation, which measured 0.2° at a viewing distance of 27.1 cm. Unless otherwise stated, visual stimuli were located 25° either side of a
fixation cross presented in the centre of the screen (50° separation between
stimuli). Stimuli in each interval were presented sequentially and were separated
by a 1000ms interval. On each trial, one stimulus from a pair was randomly
chosen to be presented first and each stimulus was presented for 200ms. Visual
stimuli were presented on a 21-inch Dell Trinitron P1130 monitor, at a resolution of 1024 x 768 pixels and a refresh rate of 60 Hz.
Auditory stimuli consisted of a pair of 100ms white noise bursts
(200Hz-13kHz passband, 44.1kHz sampling rate) convolved with a non-individualised set
of head-related transfer functions (see [S1] for measurement details) and were presented via Sennheiser HD 650 linear headphones at approximately 70dB.
Unless otherwise stated, stimuli were presented 10° either side of the midline with
respect to the azimuthal plane (20° separation between stimuli). Stimuli in each
interval were presented sequentially and were separated by a 1000ms interval. On each trial, one stimulus from a pair was randomly chosen to be presented first. All
stimuli were programmed and displayed in Matlab using components from the
Psychtoolbox [S2,S3].
Temporal interval discrimination tasks
In the temporal interval discrimination tasks, participants were required to
indicate which of two intervals contained the stimuli separated by the longest
duration. In each trial, two stimuli were presented in each of two intervals. In the
standard interval, stimuli were separated by a fixed interval (t), which, unless otherwise stated, was 1000ms in duration. In the comparison interval, stimuli
were separated by an interval equal to t plus an additional period (∆t), which
presentation order of standard and comparison intervals was randomised across
trials.
Spatial separation discrimination tasks
In the spatial separation discrimination tasks, participants were required to judge which of two intervals contained the stimuli separated by the largest physical
distance. In each trial, two stimuli were presented in each of two intervals. In the
standard interval, stimuli were separated by a fixed separation (d), which, unless
otherwise stated, was 50° for visual stimuli and 20° for auditory stimuli. In the
comparison interval, stimuli were separated by a distance equal to d plus an
additional distance (∆d), which varied adaptively according to a 3-down, 1-up staircase procedure. The presentation order of standard and comparison intervals
was randomised across trials.
Procedure
The experiment consisted of a pre-training session, a post-training session and
five training sessions. In pre- and post-training sessions, observers’ thresholds
were measured on all four task variants with task order randomised for each
individual. Thresholds for visual and auditory temporal interval tasks were measured for standard intervals of 500ms, 1000ms and 2000ms. Thresholds for
the spatial separation task were measured for separations of 30°, 50° and 70° for
visual stimuli and 10°, 20° and 30° for auditory stimuli. Pre- and post-training
sessions lasted approximately 90 minutes.
Following the pre-training session, participants were pseudorandomly
assigned to one task on which they trained for five consecutive days. Each
training session consisted of 6 blocks of 50 trials (300 trials per training session)
and participants received auditory feedback at the end of each trial. For
motivational purposes, participants were also informed of their threshold at the end of a block, accompanied by a message indicating whether they had performed
better or worse than the previous block. Thresholds on all tasks were measured
using a staircase procedure. Initially, the difficulty of the task varied according to
3-down, 1-up staircase tracking an accuracy level of 79.3%. Discrimination
thresholds were calculated as the average of the last four staircase reversals and a
daily estimate of task performance was obtained by averaging thresholds across
all 6 blocks. Training sessions were separated by no more than 3 days.
Supplemental Results
Training data
A summary of each group’s performance as a function of the training session can
be seen in Figure S1. All groups demonstrated significant learning on their
respective task, with thresholds gradually decreasing over the course of training.
Raw discrimination thresholds from pre- and post-training sessions
As detailed in the Supplemental Methods, we measured thresholds for a range of
standard intervals and separations in the pre- and post-training sessions. Figure S2
shows thresholds for the different standard values for each of the key crossmodal comparisons. Plots on the left-hand side of the figure indicate how training on
each of the spatial tasks affected thresholds in the other sensory modality, while
the analogous comparison for the temporal tasks is found on the right-hand side of
the figure. For groups that trained in the non-dominant modality for each task (i.e. visual temporal or auditory spatial conditions), there was no change in thresholds
for any condition (see Figure S2, blue and green boxes). For groups that trained in
the dominant modality for each task, thresholds improved in the other sensory
modality and this improvement generalised to all of the different standard
conditions (see Figure S2, yellow and red boxes). In contrast to some previous
findings (e.g. [S4]), this generalisation of learned improvements was also observed in each of the within-task conditions (data not shown). Since there was
no significant difference in the extent of learning across the different standard
conditions either within-task (all ps>0.118) or crossmodally (all ps>0.37), we
averaged thresholds across these conditions in our main analysis.
S1. Deas, R.W., Roach, N.W. and McGraw, P.V. (2008). Distortions of perceived auditory and visual space following adaptation to motion. Exp. Brain Res. 191, 473-485.
S2. Brainard, D.H. (1997). The psychophysics toobox. Spat. Vis. 10, 433-436.
S3. Pelli, D.G. (1997). The videotoolbox software for visual psychophysics: transforming numbers into movies. Spat. Vis. 10, 437-442.
S4. Wright, B.A., Buonomano, D.V., Mahncke, H.W. and Merzenich, M.M. (1997). Learning and generalization of auditory temporal-interval