Accepted
Article
This article has been accepted for publication and undergone full peer review but has not
been through the copyediting, typesetting, pagination and proofreading process, which may
lead to differences between this version and the Version of Record. Please cite this article as
DR AYE CHAN PAING (Orcid ID : 0000-0002-7758-7466) DR ALISON KIRK (Orcid ID : 0000-0002-6534-3763)
Article type : Research Article
Diabetic Medicine
Article type: Research Article
Article number: 2018-00225
Copy editor: Maria Hale
Proofs to: [email protected]
Copyright: Diabetes UK
Author running head: A. C. Paing et al.
Short title running head: Dose–response of breaks on basal glucose
Research Article Treatment
Dose–response between frequency of interruption of
sedentary time and fasting glucose, the dawn phenomenon
and night-time glucose in Type 2 diabetes
A. C. Paing
1, K. A. McMillan
2, A. F. Kirk
2, A. Collier
1, A. Hewitt
2and S. F. M.
Chastin
1,31
School of Health and Life Sciences, Glasgow Caledonian University and 2Physical Activity for Health Group, School of Psychological Sciences and Health, University of Strathclyde, Glasgow, UK, and 3Department of Movement and Sports Science, Ghent University, Ghent, Belgium
Accepted
Article
What’s new?
There is a dose–response between how often sitting is interrupted and basal glucose control.
Frequent interruptions of prolonged sitting with short light-intensity walking breaks every 15 min reduce fasting glucose, magnitude of the dawn phenomenon, duration of the dawn phenomenon and night-time glycaemic variability.
Interrupting sedentary time every 15 min with short light-intensity walking breaks could be a simple therapy to improve basal glucose control.
Abstract
Aim To explore the dose–response between frequency of interruption of sedentary time and basal glucose (fasting glucose, the dawn phenomenon and night-time glucose) in Type 2 diabetes.
Methods In a randomized three-treatment, two-period balanced incomplete block trial, 12 people with Type 2 diabetes (age, 60.0 ± 3.2 years; BMI, 30.2 ± 1.4 kg/m2) completed two of three
conditions: sitting for 7 h interrupted every 60 min (Condition 1), 30 min (Condition 2), and 15 min (Condition 3) by 3-min light-intensity walking breaks. The activPAL3 and FreeStyle Libre were used to assess physical activity/sedentary behaviour and continuous glucose profile. Standardized meals were provided, and changes in basal glucose of the nights and early mornings before and after treatment conditions were calculated (mean ± SE).
Results After treatment conditions, fasting glucose and duration of the dawn phenomenon were lower for Condition 3 (−1.0 ± 0.2 mmol/l, P < 0.02; −3.1 ± 1.3 h, P = 0.004) compared with Condition 1 (−0.1 ± 0.2 mmol/l; 1.9 ± 1.2 h). The magnitude of the dawn phenomenon was reduced in
Condition 3 (−0.6 ± 0.4 mmol/l, P = 0.041) compared with Condition 2 (0.6 ± 0.3 mmol/l). Night-time glycaemic variability (coefficient of variation) was reduced in Condition 3 (−9.7 ± 3.9%) relative to Condition 2 (6.1 ± 4.8%, P < 0.03) and Condition 1 (2.5 ± 1.8%, P = 0.02). There was no change in night-time mean glucose.
Conclusions Frequent interruptions of prolonged sitting with 3 min of light-intensity walking breaks every 15 min improves fasting glucose, the dawn phenomenon and night-time glycaemic variability, and this might be a simple therapeutic intervention to improve glucose control.
Accepted
Article
<H1>Introduction
Basal hyperglycaemia, including high fasting glucose, the dawn phenomenon and night-time glucose, could be indicative of insulin resistance and pancreatic β-cell deficiency, which are two important underlying mechanisms in Type 2 diabetes [1–3]. Basal hyperglycaemia influences daily glucose and HbA1c control [2,4]. It makes a greater contribution to overall hyperglycaemia in people with HbA1c > 68 mmol/mol (8.4%), whereas postprandial glucose is a main contributor in people with HbA1c < 56 mmol/mol (7.3%) [5]. Consequently, basal hyperglycaemia can lead to vascular complications [6], so good basal glucose control is important. However, high fasting glucose and the dawn phenomenon, defined as a spontaneous elevation of glucose from nocturnal (starting at midnight) nadir glucose to pre-breakfast glucose, have been reported in people with Type 2 diabetes, even with combination therapy of oral anti-diabetes agents [2,7,8]. This suggests that medications might not be enough to address basal hyperglycaemia, and adjunct lifestyle interventions are needed.
There is evidence that sedentary time is associated with high fasting glucose, insulin resistance and metabolic risk profile [9–11]. By contrast, breaks in sedentary time have a beneficial effect on metabolic risk profile and postprandial glucose, and this beneficial effect might extend to basal glucose control [12]. A break in sedentary time is defined as a short period of standing or walking between two periods of sitting [13]. The reduction in postprandial glucose and insulin resistance with light-intensity walking breaks is well established in healthy adults and those with Type 2 diabetes in an experimental laboratory setting [14]. However, experimental evidence to inform the beneficial effect of light-intensity walking breaks in sedentary time on fasting glucose, the dawn phenomenon and night-time glucose is limited. One experimental study showed a reduction in night-time glucose with 3-min light-intensity walking breaks every 30 min compared with
uninterrupted sitting (7 h) [15]. However, in real life people very rarely sit all day but rather naturally break sitting on an irregular basis [16], and there is limited consensus on how frequently sitting should be interrupted. It is therefore important to find out if more frequent breaks have a beneficial effect. In other words, the dose–response relationship between frequency of breaks and basal glucose needs to be explored to inform potential therapeutic intervention based on breaking sedentary time. This study aimed to compare the effect of light-intensity walking breaks every 60 min of sitting with light-intensity walking breaks every 30 min and 15 min on fasting glucose, the dawn phenomenon and night-time glucose.
<H1>Methods
<H2>Study design
Accepted
Article
Participants completed two of the following three treatment conditions: sitting interrupted by 3 min light-intensity walking breaks every 60 min (Condition 1), 30 min (Condition 2) or 15 min (Condition 3).
<H2>Participants and recruitment
Participants were recruited between January and June 2017 from diabetes support groups in Glasgow. Eligibility criteria included self-reported Type 2 diabetes, age ≥ 35 years and BMI ≥ 25 kg/m2. Exclusion criteria were insulin therapy, pregnancy, liver and renal diseases, cancer, alcohol and substance abuse, mobility issues and diabetes-related complications such as foot ulcer, foot deformity, peripheral neuropathy and peripheral arterial diseases.
<H2>Randomization
Until the first treatment condition day, participants were blinded to trial condition order. The order was assigned using block randomization sequence produced by SPSS.
<H2>Experimental protocol
The total duration of the experimental protocol was 15 days: 4 days of pre-experimental monitoring, 1 day of first treatment condition, 5 days of wash-out period, 1 day of second treatment condition and 4 days of post-experimental monitoring. Participants resumed their habitual diet and physical activity during the pre-experimental monitoring, wash-out and post-experimental monitoring periods, and refrained from alcohol, smoking and moderate to vigorous physical activity (MVPA) throughout the study. To ensure compliance with protocol, they were reminded at each visit.
<H2>Pre-experimental monitoring period (visit 1)
Participants visited the university laboratory at Glasgow Caledonian University or University of Strathclyde. A researcher recorded participants’ demographic information and medication history. Participants were fitted with a continuous glucose monitoring (CGM, Abbott FreeStyle Libre) and activPAL3 activity monitor (PAL Technologies, Glasgow, UK). They were provided with a FreeStyle Libre reader to scan glucose every 8 h, a sleep diary to record bedtime and waking time, and a 24-h dietary recall form to record medication and dietary intake during study period. Participants then completed their normal daily living behaviour for 4 days.
<H2>First treatment condition (visit 2)
After an overnight fast (starting at 22:00 h), participants reported to the laboratory at 08:00 h. Participants remained seated for 1 h to achieve a steady state. The internet, a personal computer and books were provided for entertainment. A standardized breakfast, consisting of 50–53.7 g carbohydrate, 9.1–12.6 g fat, 14.7–22.4 g protein and 1.4–1.7 MJ energy, was consumed at 09:00 h. One of the following treatment conditions commenced after breakfast according to the
Accepted
Article
1. Condition 1. Participants performed 3 min of light-intensity walking on level ground every 60 min at a pace of 10 m in 11 s (3.2 km/h), and timing and supervision were done by the researcher to ensure full adherence to the treatment condition as per protocol. Participants then sat for 60 min, and this was repeated until the end of treatment condition (16:00 h). There were six bouts (18 min) of walking.
2. Condition 2. The procedure was identical to Condition 1, but participants walked for 3 min every 30 min of sitting. There were 12 bouts (36 min) of walking.
3. Condition 3. The procedure was the same as above two conditions except that 3 min of walking was introduced every 15 min of sitting. Participants performed 23 bouts (69 min) of walking.
Participants consumed a standardized lunch with 75 g carbohydrate, 14.5 g fat, 28 g protein and 2.2 MJ energy at 12:36 h. Participants were also provided with a ready-meal dinner, consisting of 50.1–55.6 g carbohydrate, 7.3–12.3 g fat, 20.1–30.1 g protein and 1.4–1.8 MJ energy, and a snack, consisting of 10–13.1 g carbohydrate, 0.3–0.6 g fat, 0.3–2.6 g protein and 0.2–0.3 MJ energy, to consume at home after treatment condition. Dinner was consumed between 18:00 h and 21:00 h, and the snack between 16:30 h and 22:00 h. On treatment condition days, participants were only allowed to have meals they were provided with. Participants refrained from caffeine in addition to alcohol, smoking and MVPA.
<H2>Wash-out period
A 5-days of wash-out period was introduced between two treatment conditions to avoid the potential carryover effect.
<H2>Second treatment condition (visit 3)
Procedures, diet and meal time were identical to the first treatment condition except that
participants performed another of the three treatment conditions, which was not performed on the first treatment condition day.
<H2>Post-experimental monitoring period (visit 4)
After 4 days of post-experimental monitoring, participants visited the laboratory to remove the CGM and activPAL3. This was the end of the trial period.
<H2>Physical activity and sedentary behaviour monitoring
Accepted
Article
activPAL data for 3 days before each treatment condition were used to calculate baseline daily sedentary time, standing time and walking time after sleeping time was excluded using the sleep diary and activPAL file. Baseline energy expenditure during 3 days before the treatment condition and energy expenditure on treatment condition day were computed using the 24-h activPAL data.
<H2>Continuous glucose monitoring
Participants wore the CGM providing interstitial glucose records every 15 min for 2 weeks. The sensor was inserted into the subcutaneous tissue on the back of upper arm. The interstitial glucose value recorded using this well-tolerated consumer grade device is as accurate as the capillary blood glucose [19]. The accuracy is not influenced by type of diabetes, HbA1c, age and BMI [19]. The reader and FreeStyle Libre software (version 1.0) were respectively used to retrieve the data wirelessly every 8 h and to download the glucose data.
Glucose outcome measures were changes in fasting glucose, magnitude and duration of the dawn phenomenon, night-time mean glucose and night-time glycaemic variability [coefficient of variation (CV%) = (SD/mean) × 100] of the nights and early mornings before and after treatment conditions. Changes in glucose variables were calculated by subtracting glucose values before treatment conditions from glucose values after treatment conditions. The CGM glucose value just before the start of breakfast was defined as fasting glucose (pre-breakfast glucose) [20]. The dawn
phenomenon was calculated by subtracting nocturnal (starting at midnight) nadir glucose from pre-breakfast glucose [8]. The time interval between nocturnal nadir glucose and pre-pre-breakfast glucose was defined as the duration of the dawn phenomenon [8]. If all nocturnal glucose values were greater than the pre-breakfast glucose value, the dawn phenomenon and duration of the dawn phenomenon were recorded as zero [8]. The period between bedtime and waking time reported in the sleep diary was defined as night-time. Night-time mean glucose and glycaemic variability (CV%) were calculated using glucose values during this period.
<H2>Statistical analyses
Sample size calculations were based on a previous study [21]. Allowing for a statistical power of 80%, a 0.05 probability level and a correlation of 0.5 between repeated measures, we estimated that 12 participants would be needed to detect a 24% change in glucose based on the effect size observed in this previous study [21]. There were no inclusion or exclusion criteria regarding missing glucose values. Across all treatment conditions, 3.5% of night-time glucose values (54 of 1527 glucose points) were missing, and within-individual mean substitution was applied. Within-individual mean
substitution might underestimate standard errors (SE), however, this method has been shown to be effective and accurate to deal with ≤ 10% of missing data [22].
Accepted
Article
treatment condition day, and Model 2 was additionally adjusted for anti-diabetes medication dose (mg/day), sedentary time (h/day) and walking time (h/day) on treatment condition day. All variables were added as continuous variables except for gender. Differences in baseline participant
characteristics were assessed with multilevel mixed-effects linear regression. To locate differences between conditions, pairwise comparisons were performed using post hoc Fisher LSD tests. Statistical analyses were conducted using IBM SPSS Statistics software (version 24.0). Data are expressed as mean ± SE unless otherwise indicated, and P ≤ 0.05 was considered statistically significant. No adjustment was applied for multiple comparisons.
<H1>Results
Twelve participants (eight men, four women; mean duration of diabetes, 5.2 ± 0.8 years; mean age, 60.0 ± 3.2 years; mean BMI, 30.2 ± 1.4 kg/m2) were randomized and completed trial conditions. Baseline participant characteristics before treatment conditions are displayed in Table 1, and no significant differences between conditions were observed.
Table 2 shows the changes in glucose variables in three treatment conditions. Fasting glucose was significantly lowered in Condition 3 (−1.0 ± 0.2 mmol/l, P < 0.02), but not after Condition 2
(−0.6 ± 0.2 mmol/l, P = 0.12) compared with Condition 1 (−0.1 ± 0.2 mmol/l). Moreover, the duration of the dawn phenomenon was significantly reduced in Condition 3 (−3.1 ± 1.3 h, P = 0.004), but not in Condition 2 (−0.1 ± 1.4 h, P = 0.37) in comparison with Condition 1 (1.9 ± 1.2 h). Compared with Condition 2 (0.6 ± 0.3 mmol/l), there was significant reduction in the magnitude of the dawn phenomenon after Condition 3 (−0.6 ± 0.4 mmol/l, P = 0.041). In addition, Condition 3 (−9.7 ± 3.9%) significantly reduced night-time glycaemic variability (CV%) compared with Condition 2 (6.1 ± 4.8%,
P<0.03) and Condition 1 (2.5 ± 1.8%, P=0.02).
A reduction in fasting glucose and the duration of the dawn phenomenon in Condition 3 (−1.0 ± 0.2 mmol/l, P < 0.02; −3.0 ± 2.1 h, P < 0.03) relative to Condition 1 (−0.1 ± 0.2 mmol/l; 1.9 ± 1.6 h) was observed, independent of medication, sedentary time and walking time (Model 2). Moreover, there was a consistent reduction in the magnitude of the dawn phenomenon and night-time glycaemic variability (CV%) in Condition 3 (−0.6 ± 0.4 mmol/l, P < 0.01; −6.1 ± 3.8%, P < 0.04) compared with Condition 2 (0.8 ± 0.3 mmol/l; 5.2 ± 3.2%). No difference in night-time mean glucose was observed in both Model 1 and Model 2.
<H1>Discussion
The main finding of this study is that interrupting prolonged sitting frequently (at least every 15 min ) improves basal glucose control in Type 2 diabetes. Lower fasting glucose, the magnitude and duration of the dawn phenomenon, and night-time glycaemic variability (CV%) were observed if the previous day sedentary time was interrupted more frequently.
3-Accepted
Article
min walking breaks every 30 min in comparison with uninterrupted sitting (7 h) [15], but our study did not observe the difference in night-time mean glucose between treatment conditions. The lowering of night-time glycaemic variability (CV%) after more frequent breaks (Condition 3) is similar to the reduction in 22 h glycaemic variability reported previously [15]. The lower glycaemic
variability and basal glucose with frequent walking breaks might contribute to reducing risks of vascular complications [6,24].
Basal glucose control is one of the main therapeutic goals of diabetes management. However, most anti-diabetes agents, such as prandial glucose regulators, -glucosidase inhibitors and incretins, are designed to reduce postprandial glucose, and increasing the sulphonylurea dose is not ideal to control basal glucose because of the risk of hypoglycaemia [2]. Among oral anti-diabetes agents, metformin is effective in reducing fasting glucose and insulin resistance. However; basal glucose is not adequately controlled by metformin or a combination of oral anti-diabetes agents [2,7,8]. In addition to anti-diabetes agents, at least 150 min of MVPA per week is recommended to improve glucose control and pancreatic β-cell function, and to reduce insulin resistance [25]. However, adherence to exercise is often suboptimal in people with Type 2 diabetes.
This study found that light-intensity walking breaks improved basal glucose. The mechanism for this is unclear. However, frequent interruption of sedentary time every 15 min could be considered in addition to the current treatment regimen. A feasibility study conducted in overweight and obese adults discovered that breaks in sedentary time (3-min break every 30 min vs. 6-min break every 60 min vs. 12-min break every 120 min) reduce sedentary time and improve physical activity, with greater compliance with more frequent breaks [26]. But, the feasibility and clinical relevance of walking breaks in free-living conditions in Type 2 diabetes should be tested in future studies. This study has a number of strengths. First, the reference condition (Condition 1) and light-intensity walking (3.2 km/h) on level ground were relatively closer to habitual sedentary and activity patterns observed in Type 2 diabetes [16,27]. Second, this is the first study to compare the effects of different frequencies of walking breaks on basal glucose, especially the dawn phenomenon, although
postprandial metabolic responses to different frequencies of standing breaks have been investigated previously [28]. Third, analyses were adjusted for different confounding variables, which might influence glucose homeostasis. Finally, the activPAL3 and CGM allowed relatively long duration of sedentary behaviour/physical activity and interstitial glucose monitoring.
Accepted
Article
participant. Sixth, the difference in sedentary time, physical activity time, energy expenditure and timing of activity breaks in relation to meals could influence the effect of breaks. Future studies should compare different frequencies of breaks when these factors are matched. Finally, the dose– response of breaks on insulin resistance could not be assessed directly due to lack of insulin measurement. Nonetheless, lower fasting glucose and the dawn phenomenon in response to Condition 3 could reflect improved insulin sensitivity [1–3]. Observational and experimental studies have already reported that breaks in sedentary time improve insulin homeostasis [10,14].
In conclusion, this study demonstrates the dose–response of frequency of light-intensity walking breaks on basal glucose. The introduction of short frequent breaks in sedentary time could be an effective approach to improve fasting glucose, the dawn phenomenon and night-time glycaemic variability. Longer-term exposure to light-intensity walking breaks every 15 min of sitting added to current treatment regimen might produce sustainable clinical effect in Type 2 diabetes, and this should be explored in long-term studies.
Funding sources
This work was supported by PAL Technologies Ltd (Glasgow, UK) and School of Health and Life Sciences, Glasgow Caledonian University. The funding agencies did not play any role in preparing and writing up manuscript, and in making a decision to submit manuscript.
Competing interests
None declared.
Acknowledgements
We are grateful for the support of PAL Technologies Ltd (Glasgow, UK) and School of Health and Life Sciences, Glasgow Caledonian University. We would like to thank Prof. Joanne Booth (Glasgow Caledonian University) who provided financial support for participants’ meals. We also wish to express our gratitude to the participants who volunteered and devoted their time to the study.
References
1 Matthews DR, Hosker JP, Rudenski AS, Naylor BA, Treacher DF, Turner RC. Homeostasis model assessment: insulin resistance and beta-cell function from fasting plasma glucose and insulin concentrations in man. Diabetologia 1985; 28: 412–419.
2 Porcellati F, Lucidi P, Bolli GB, Fanelli CG. Thirty years of research on the dawn phenomenon: lessons to optimize blood glucose control in diabetes. Diabetes Care 2013; 36: 3860–3862. 3 Kanat M, Mari A, Norton L, Winnier D, DeFronzo RA, Jenkinson C et al. Distinct β-cell defects
in impaired fasting glucose and impaired glucose tolerance. Diabetes 2012; 61: 447–453. 4 Riddle M, Umpierrez G, Digenio A, Zhou R, Rosenstock J. Contributions of basal and
Accepted
Article
intensification in type 2 diabetes. Diabetes Care 2011; 34: 2508–2514.
5 Monnier L, Colette C. Postprandial and basal hyperglycaemia in type 2 diabetes: contributions to overall glucose exposure and diabetic complications. Diabetes Metab 2015; 41(Suppl 5): 9– 15.
6 Tanaka M. Relationship between fasting and 2-hour postprandial plasma glucose levels and vascular complications in patients with type 2 diabetes mellitus. J Int Med Res 2012; 40: 1295–1303.
7 Paing AC, Kirk A, Collier A, Chastin SFM. Basic and clinical science posters: Type 2 diabetes.
Diabet Med 2017; 34(Suppl 1): 74–83.
8 Monnier L, Baptista G, Colette C, Regnier-Zerbib A, Sardinoux M, Owens D. Frequency and severity of the dawn phenomenon in type 2 diabetes: Relationship to age. Diabetes Care
2012; 35: 2597–2599.
9 Helmerhorst HJF, Wijndaele K, Brage S, Wareham NJ, Ekelund U. Objectively measured sedentary time may predict insulin resistance independent of moderate- and vigorous-intensity physical activity. Diabetes 2009; 58: 1776–1779.
10 Sardinha LB, Magalhães JP, Santos DA, Júdice PB. Sedentary patterns, physical activity, and cardiorespiratory fitness in association to glycemic control in type 2 diabetes patients. Front Physiol 2017; 8: e262.
11 Honda T, Chen S, Kishimoto H, Narazaki K, Kumagai S. Identifying associations between sedentary time and cardio-metabolic risk factors in working adults using objective and subjective measures: a cross-sectional analysis. BMC Public Health 2014; 14: 1307–1316. 12 Healy GN, Dunstan DW, Salmon J, Cerin E, Shaw JE, Zimmet PZ et al. Breaks in sedentary time.
Diabetes Care 2008; 31: 661–666.
13 Tremblay MS, Aubert S, Barnes JD, Saunders TJ, Carson V, Latimer-Cheung AE et al. Sedentary Behavior Research Network (SBRN) – Terminology Consensus Project process and outcome.
Int J Behav Nutr Phys Act 2017; 14: e12966.
14 Chastin SFM, Egerton T, Leask C, Stamatakis E. Meta-analysis of the relationship between breaks in sedentary behavior and cardiometabolic health. Obesity 2015; 23: 1800–1810. 15 Dempsey PC, Blankenship JM, Larsen RN, Sacre JW, Sethi P, Straznicky NE et al. Interrupting
prolonged sitting in type 2 diabetes: nocturnal persistence of improved glycaemic control.
Diabetologia 2017; 60: 499–507.
16 van der Berg JD, Stehouwer CDA, Bosma H, van der Velde JHPM, Willems PJB, Savelberg HHCM et al. Associations of total amount and patterns of sedentary behaviour with type 2 diabetes and the metabolic syndrome: The Maastricht Study. Diabetologia 2016; 59: 709– 718.
Accepted
Article
ordinal responses. Int J Biostat 2017; 13: 467–480.
18 Grant PM, Ryan CG, Tigbe WW, Granat MH. The validation of a novel activity monitor in the measurement of posture and motion during everyday activities. Br J Sports Med 2006; 40: 992–997.
19 Bailey T, Bode BW, Christiansen MP, Klaff LJ, Alva S. The performance and usability of a factory-calibrated flash glucose monitoring system. Diabetes Technol Ther 2015; 17: 787–794. 20 Thomas F, Pretty CG, Desaive T, Chase JG. Blood glucose levels of subelite athletes during 6
days of free living. J Diabetes Sci Technol 2016; 10: 1335–1343.
21 Dunstan DW, Kingwell BA, Larsen R, Healy GN, Cerin E, Hamilton MT et al. Breaking up
prolonged sitting reduces postprandial glucose and insulin responses. Diabetes Care 2012; 35: 976–983.
22 Cheema JR. Some general guidelines for choosing missing data handling methods in educational research. J Mod Appl Stat Methods 2014; 13: 53–75.
23 Duvivier BMFM, Schaper NC, Hesselink MKC, van Kan L, Stienen N, Winkens B et al. Breaking sitting with light activities vs structured exercise: a randomised crossover study
demonstrating benefits for glycaemic control and insulin sensitivity in type 2 diabetes.
Diabetologia 2017; 60: 490–498.
24 Nalysnyk L, Hernandez-Medina M, Krishnarajah G. Glycaemic variability and complications in patients with diabetes mellitus: evidence from a systematic review of the literature. Diabet Obes Metab 2010; 12: 288–298.
25 Mudaliar S. Choice of early treatment regimen and impact on Beta-cell preservation in type 2 diabetes. Int J Clin Pract 2013; 67: 876–887.
26 Bond DS, Thomas JG, Raynor HA, Moon J, Sieling J, Trautvetter J et al. B-MOBILE – a
smartphone-based intervention to reduce sedentary time in overweight/obese individuals: a within-subjects experimental trial. PLoS ONE 2014; 9: e100821.
27 Johnson ST, Tudor-Locke C, McCargar LJ, Bell RC. Measuring habitual walking speed of people with type 2 diabetes: are they meeting recommendations? Diabetes Care 2005; 28: 1503– 1504.
28 Hawari NSA, Al-Shayji I, Wilson J, Gill JMR. Frequency of breaks in sedentary time and postprandial metabolic responses. Med Sci Sports Exerc 2016; 48: 2495–2502.
29 Bailey DP, Locke CD. Breaking up prolonged sitting with light-intensity walking improves postprandial glycemia, but breaking up sitting with standing does not. J Sci Med Sport 2015;
18: 294–298.
30 Dempsey PC, Larsen RN, Winkler EAH, Owen N, Kingwell BA, Dunstan DW. Prolonged
Accepted
[image:12.595.37.539.107.519.2]Article
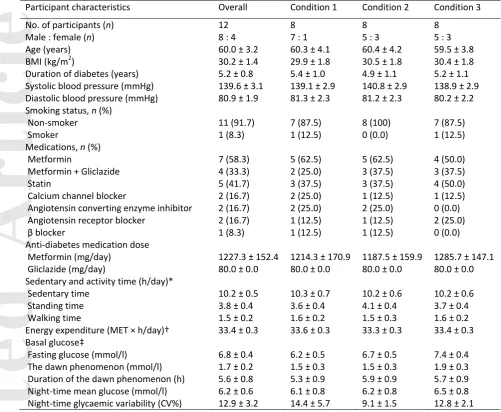
Table 1 Baseline participant characteristics before treatment conditions
Data are means ± SE or n (%).
CV, coefficient of variation.
*Sedentary and activity time during three days before treatment conditions.
†Energy expenditure during three days before treatment conditions.
‡Basal glucose of the nights and early mornings before treatment conditions.
There were no significant differences in age, BMI, duration of diabetes, systolic blood pressure, diastolic blood pressure, sedentary and activity time, energy expenditure and basal glucose between treatment conditions. Participant characteristics Overall Condition 1 Condition 2 Condition 3
No. of participants (n) 12 8 8 8
Male : female (n) 8 : 4 7 : 1 5 : 3 5 : 3
Age (years) 60.0 ± 3.2 60.3 ± 4.1 60.4 ± 4.2 59.5 ± 3.8
BMI (kg/m2) 30.2 ± 1.4 29.9 ± 1.8 30.5 ± 1.8 30.4 ± 1.8
Duration of diabetes (years) 5.2 ± 0.8 5.4 ± 1.0 4.9 ± 1.1 5.2 ± 1.1 Systolic blood pressure (mmHg) 139.6 ± 3.1 139.1 ± 2.9 140.8 ± 2.9 138.9 ± 2.9 Diastolic blood pressure (mmHg) 80.9 ± 1.9 81.3 ± 2.3 81.2 ± 2.3 80.2 ± 2.2 Smoking status, n (%)
Non-smoker 11 (91.7) 7 (87.5) 8 (100) 7 (87.5)
Smoker 1 (8.3) 1 (12.5) 0 (0.0) 1 (12.5)
Medications, n (%)
Metformin 7 (58.3) 5 (62.5) 5 (62.5) 4 (50.0)
Metformin + Gliclazide 4 (33.3) 2 (25.0) 3 (37.5) 3 (37.5)
Statin 5 (41.7) 3 (37.5) 3 (37.5) 4 (50.0)
Calcium channel blocker 2 (16.7) 2 (25.0) 1 (12.5) 1 (12.5)
Angiotensin converting enzyme inhibitor 2 (16.7) 2 (25.0) 2 (25.0) 0 (0.0) Angiotensin receptor blocker 2 (16.7) 1 (12.5) 1 (12.5) 2 (25.0)
β blocker 1 (8.3) 1 (12.5) 1 (12.5) 0 (0.0)
Anti-diabetes medication dose
Metformin (mg/day) 1227.3 ± 152.4 1214.3 ± 170.9 1187.5 ± 159.9 1285.7 ± 147.1 Gliclazide (mg/day) 80.0 ± 0.0 80.0 ± 0.0 80.0 ± 0.0 80.0 ± 0.0 Sedentary and activity time (h/day)*
Sedentary time 10.2 ± 0.5 10.3 ± 0.7 10.2 ± 0.6 10.2 ± 0.6
Standing time 3.8 ± 0.4 3.6 ± 0.4 4.1 ± 0.4 3.7 ± 0.4
Walking time 1.5 ± 0.2 1.6 ± 0.2 1.5 ± 0.3 1.6 ± 0.2
Energy expenditure (MET × h/day)† 33.4 ± 0.3 33.6 ± 0.3 33.3 ± 0.3 33.4 ± 0.3 Basal glucose‡
Accepted
[image:13.595.28.530.91.391.2]Article
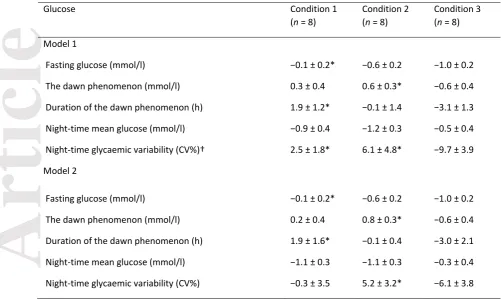
Table 2 Change in glucose variables
Data are marginal means ± SE.
Model 1 was adjusted for age, sex, BMI, carbohydrate intake and energy expenditure.
Model 2 was additionally adjusted for anti-diabetes medication dose, sedentary time and walking time.
*Significantly different compared with Condition 3 (P ˂ 0.05).
†CV, coefficient of variation.
Glucose Condition 1
(n = 8)
Condition 2 (n = 8)
Condition 3 (n = 8)
Model 1
Fasting glucose (mmol/l) −0.1 ± 0.2* −0.6 ± 0.2 −1.0 ± 0.2
The dawn phenomenon (mmol/l) 0.3 ± 0.4 0.6 ± 0.3* −0.6 ± 0.4
Duration of the dawn phenomenon (h) 1.9 ± 1.2* −0.1 ± 1.4 −3.1 ± 1.3
Night-time mean glucose (mmol/l) −0.9 ± 0.4 −1.2 ± 0.3 −0.5 ± 0.4
Night-time glycaemic variability (CV%)† 2.5 ± 1.8* 6.1 ± 4.8* −9.7 ± 3.9
Model 2
Fasting glucose (mmol/l) −0.1 ± 0.2* −0.6 ± 0.2 −1.0 ± 0.2
The dawn phenomenon (mmol/l) 0.2 ± 0.4 0.8 ± 0.3* −0.6 ± 0.4
Duration of the dawn phenomenon (h) 1.9 ± 1.6* −0.1 ± 0.4 −3.0 ± 2.1
Night-time mean glucose (mmol/l) −1.1 ± 0.3 −1.1 ± 0.3 −0.3 ± 0.4