University of Warwick institutional repository: http://go.warwick.ac.uk/wrap
A Thesis Submitted for the Degree of PhD at the University of Warwick
http://go.warwick.ac.uk/wrap/66999
This thesis is made available online and is protected by original copyright. Please scroll down to view the document itself.
INNOVATION REPORT
The Development ofa Laser-EMAT System
Suitable for On-Line Inspection in the
Continuous Casting Plant
lain Baillie
ABSTRACT
During the continuous casting process, both surface and internal defects can arise in the as-cast steel semi products, causing problems for downstream processes and customers(l). These problems could be minimised if the steel could be inspected on-line, during the manufacturing process, whereby a feedback control system could be developed to alert operators should any defects arise and modifications need to be made to the process. The main benefit of on-line inspection is reducing operating costs. Additionally, the material flow through the mills and to the customer could be streamlined and optimised to ensure that defective or out of tolerance material is not sent through additional, expensive, value added processes(2,3). The problem is that steel in the caster is at temperatures in excess of 800°C and the environment is so harsh that most inspection technologies will not work under these conditions.
A review of the literature was conducted to assess technologies that could be applied to inspect the surface and internal quality of hot, moving steel within the harsh environment of a continuous caster(4). This review enabled a non-contact ultrasonic technique to be selected, as this was suitable for the hostile environment and could find both internal and surface defects at the same time(4). A further literature study was undertaken which showed that a Laser-EMAT (ElectroMagnetic Acoustic Transducer) system could be suitable for the application(5). This technology uses a high energy, pulsed laser beam to generate ultrasound in the steel and non-contact EMATs to detect the ultrasonic signals. As this technology was not available off-the shelf, significant research needed to be conducted and ultrasonic experiments to find defects at room temperature and hot, moving steel were carried out(6).
ACKNOWLEDGEMENTS
Corus R, D & T
Mr P Griffith (Researcher):
All Lab VIEW work presented in this report was programmed by Peter who followed my software specifications and who helped to take measurements with me.
Mr I Jones (Technician), Mr B Barry (Fitter) and Mr R Goater (Drawing Officer):
These people helped me to design and build numerous EMA Ts and EMA T holders and offered invaluable assistance installing apparatus both at Teesside and Swinden Technology Centres. Dr AS Normanton (Manager), Mr A Scholes, Mr B Patrick:
For supporting me on my EngD.
The University of Warwick
Dr S Dixon (Senior Lecturer):
Explained Laser-EMAT technology to me and was my mentor throughout this project. Dr X Jian (Research Assistant):
Conducted measurements on steel samples for finding internal defects using an EMAT-EMAT system. Used Finite Element Models to compare the theory against my practical
measurements.
CONTENTS
I. INTRODUCTION ... I
2. THE CONTINUOUS CASTING PROCESS ... 3
3. THE IMPORTANCE OF ON-LINE INSPECTION TO REDUCING COSTS ... 6
3.1 Correcting Defects via Feedback Control during the Manufacturing Process ... 6
3.2 Reducing the Amount of Manual Inspection and Delays in the Slab yard ... 6
3.3 Reducing the Costs Associated with Scarfing ... 7
4. HOW NON-CONTACT LASER-EMA T (ULTRASONIC) TECHNOLOGY WAS SELECTED BY REVIEWING THE LITERATURE ... 8
5. STEPS TAKEN TO DEVELOP AN ON-LINE SYSTEM ... 10
6. LASER-EMAT THEORy ... 11
6.1 The Laser Beam as a Broadband Ultrasonic Source ... 11
6.2 The EMA T as an Ultrasonic Receiver ... 11
6.3 How Surface waves can be used to Find Defects ... 12
6.4 How Bulk Waves Can be Used to Find Internal Defects ... 15
6.5 Optimising a Laser-EMA T System ... 16
7. DEVELOPMENT OF AN EMAT SENSOR CAPABLE OF WITHSTANDING TEMPERATURES GREATER THAN 1000 °C ... 17
7.1 Mechanisms that Affect Ultrasonic Signals when the Steel is Hot.. ... 17
7.2 Ultrasonic Experiments on Hot Steel Samples ... 20
7.3 Additional Tests and Results Conducted at High Temperature ... 24
7.4 Summary ... 29
8. DEVELOPMENT OF AN AUTOMATED INSPECTION SYSTEM ... 30
8.1 Construction of a Mechanical EMA T Holder to Accommodate Variability in Product Thickness ... 30
8.2 Constructing a New, Dedicated Data-logging PC ... 32
8.3 Construction of an Automated Trolley Inspection System ... 32
9. ON-LINE SURFACE DEFECT DETECTION ON HOT, MOVING STEEL ... 34
9.1 Experimental Method ... 34
9.2 How the Presence of a Surface Defect Can Affect Ultrasonic Signals ... 35
9.3 LabVIEW Controlled Trolley System to Inspect an Incrementally Moving Billet Sample at Room Temperature ... 36
9.4 Additional Tests to Move the Billet at a Constant Velocity ... 40
9.5 Pilot Rolling Mill System to Inspect a Moving Billet Sample at Room Temperature ... .41
9.6 Pilot Rolling Mill System to Inspect a Moving, Hot Billet Sample ... .41
9.7 Recommendations for Further Work to Improve Measurements at Elevated Temperature ... 43
10. DETECTING DEFECTS ON THE BOTTOM FACE OF THE BILLET, WITH THE LASER EMAT EQUIPMENT MOUNTED ON THE TOP FACE ... 44
11. LASER-EMAT ARRAyS ... 46
12. INSTALLATION ON THE PILOT PLANT CONTINUOUS CASTER ... 49
13. RECOMMENDATIONS FOR THE FINAL LASER-EMAT SYSTEM ... 53
14. MAIN INNOVATIONS ... 55
15. CONCLUSIONS ... 57
16. LIST OF PUBLISHED PAPERS RESULTING FROM THE ENGINEERING DOCTORATE PROJECT ... 58
17. REFERENCES ... 59
1.
INTRODUCTION
A schematic diagram showing an overview of this Engineering Doctorate project can be found in Fig. 1. This schematic shows the chronological progression of the work undertaken for this project and how the individual portfolio submissions were linked to one another and have been summarised for this Innovation Report.
Engineering Doctorate Submission Number 1 concluded that during the continuous casting process, both surface and internal defects can arise in steel products, causing problems for downstream processes and customers(l). This submission illustrated how problems could be minimised if the steel could be inspected on-line, during the manufacturing process, whereby a feedback control system could be developed to alert operators should any defects arise thereby allowing them to make modifications to the process. The main benefit of on-line inspection is reducing operating costs. Additionally, the material flow through the mills and to the customer could be streamlined and optimised to ensure that defective or out of tolerance material is not sent through additional, expensive, value added processes(2.3). The problem is that steel in the caster is at temperatures in excess of 800 °C and the environment is so harsh that most inspection technologies will not work under these conditions.
Engineering Doctorate Submission Number 2 contained a review of the literature whereby different inspection technologies were assessed and their suitability for inspecting the surface and internal quality of hot, moving steel were reviewed(4). This review concluded that a non-contact ultrasonic technique should be selected, as this was suitable for the hostile environment and could find both internal and surface defects at the same time(4).
Engineering Doctorate Submission Number 3 was a further literature study that reviewed non-contact ultrasonics and showed that a Laser-EMA T (ElectroMagnetic Acoustic Transducer) system could be suitable for on-line inspection in the continuous casting plant<5).
A problem was identified for the continuous casting process where currently, there is no technology commercially available that can inspect steel for surface and
internal defects. (Sections 1 & 2 and Submission No.1)
+
A Review of the Literature was conducted to assess what technologies had the potential for on-line inspection. Non-contact ultrasonics was found to be the most
viable. (Section 3 and Submission No.2)
+
A further Review of the Literature was conducted whereby a non -contact Laser-EMAT system was highlighted as being the most viable system, but still required
development. (Section 4 and Submission No.3)
+
Work was then undertaken to deliver a solution (Le. a Laser-EMAT system). (Submission No.4)
+
Ultrasonic measurements taken using Laser-EMATs on stationary steel, at room temperature. (Section 5 and Submission No.4)
+
+
EMATs for high temperature Measurements were taken on steel moving measurements developed. at room temperature using a trolley system. (Section 6 and Submission No.4) (Section 7)
I I
...
...
..
...
Ultrasonic Different defects Hardware and
measurements taken EMATs installed on were found in Software using Laser-EMATs Pilot Plant caster to moving billets at developed to save on stationary steel, at ensure they could room temperature. and analyse data. temperatures >800°C. survive casting (Sections 8 & 9 and (Section 7 and
(Section 6 and temperatures. Submission No.4) Submission No.4)
Submission No.4) (Submission No.4) I I
...
Laser-EMAT system used to find defects on moving steel at room temperature using a Pilot scale
rolling mill.
(Section 8 and Submission No.4) I
Laser-EMAT system used to find defects on hot, moving steel using a Pilot scale
rolling mill. (Section 8 and Submission No.4)
+
Considered practicalities for adapting and installing the system for the Pilot Plant continuous caster.
(Sections 10, 11 & 12 and Submission No.4)
Fig. 1: Schematic diagram showing the main stages of the EngD project and how the individual portfolio submissions are linked into the sections of
2.
THE CONTINUOUS CASTING PROCESS
During the complex continuous casting process, both surface and internal defects can arise in the as-cast semi steel products. This problem has been identified and there is a need to develop an automated, on-line inspection technique to examine the surface and internal quality of semis in the steel industry(l). The harsh environment with surface temperatures in excess of 800
°
c,
water sprays and steam is not compatible with most measuring techniques. This was initially discussed in the first Engineering Doctorate submission entitled "An introduction to the defects caused during the continuous casting of steel and the need to detect them on-line,,(l). This showed that defects can be classified into two main categories - surface and internal. Surface defects include cracks, blowholes and inclusions, whilst internal defects can also include cracks, porosity, inclusions and segregation. Figure 2 shows an example of different surface and internal defects that can exist in continuously cast steel.The industrial manufacturing process for first transforming liquid steel into rectangular solid steel products such as slabs, blooms and billets is typically via continuous casting machines which operate in a very harsh and hot environment(I,3,4). These "as-cast" products are called 'semis' in the steel industry and are the precursors for the final rolled product.
Stu Cracks
Centreline Segregation
Oscillation marks (Found around the perimeter of the product. These ue not defects, but rather a nature! phenomenon of the casting process caused by mould oscillation).
Transverse Cracks
Comer Cracks
Longitudinal Comer Cracks
Off· Comer Cracks
Spider Cracks
A diagrammatic view of a continuous caster can be seen in Fig. 3. This shows liquid steel being held in a refractory lined ladle, which may hold around 300 tonnes of liquid metal. When the ladle is positioned above the tundish, the steel flows through a ladle shroud (attached to the ladle to prevent oxidisation of the steel) and into the tundish.
~Ladle
.-_--Ladle Shroud
D
=
Molten Steel= Solid Steel
~ Tundish
Spray
Chamber andl-~~
Rollers
Submerged Entry Nozzle ater Cooled Mould
Cut-Off
I
Fig. 3: A diagram of a continuous caster with key components highlighted.
The continuous casting process is so named, because even whilst the strand is being cut to length at the cut-off point, new liquid steel is being constantly poured into the mould. When one ladle has been emptied, the tundish still holds a significant volume of molten steel and as the emptied ladle is removed, a new ladle is brought into position. This ladle will be opened and a fresh supply of liquid steel will be poured into the tundish, always keeping the tundish full until casting is ready to stop. Casting of several ladles is known as "sequence casting" and a sequence can last for several days.
3.
THE IMPORTANCE OF ON-LINE INSPECTION TO
REDUCING COSTS
The ability to inspect steel on-line would lead to significant process improvements and cost reductions in the steel manufacturing process. A letter of support, from the Technical Director of Corus Scunthorpe Works can be found in Appendix 1, which states some of the benefits an on-line inspection system could have to Corus. One of the major advantages for on-line inspection would be to alert operators to casting defects when the steel is being made, thereby giving them an opportunity to alter the casting machine to rectify the situation. Significant costs could be saved if defects were detectable earlier in the steel manufacturing process, rather than the defects causing problems for downstream processes or being contained in the final product which has been delivered to customers. The aim of on-line inspection is to correct and control the casting process to ensure that no defective or 'out-of-tolerance' material is supplied to internal Corus Business Units or external customers(l,2,7,8).
After casting, each semi is issued with a 'Quality Number,(9). This Quality Number allows for certain quality tolerances to be permitted in the semi. For semis containing defects not permissible for one particular Quality Number, the steel would be rejected and then either scrapped or used for other applications, which is dependent on the steel grade. Therefore, knowing the size and type of defects per cast would determine whether the customer requirements were being met for that particular cast product.
3.1 Correcting Defects via Feedback Control during the Manufacturing Process
Having an automated, on-line inspection system could alert operators who could then alter casting parameters in near real time, should defects be detected. Therefore, rather than continuously cast several thousand tonnes of steel and manufacture semis that could potentially contain defects, defective material would be detected after a few minutes of casting, when the steel moves past an automated, fixed inspection point. Operators could then take steps to adjust casting parameters or stop casting entirely. This would lead to significant cost savings, as operators would be able to alter casting parameters whilst the steel was being made. Take, for example, a case of corner cracking which normally arises if there is a problem with spray cooling. If it is known that a semi contains this type of defect, then the operators can check and make adjustments to the casting machine, thereby correcting the source of the problem(3). As semis can be tracked through the steel mill, any semis that contain defects could be closely monitored to ensure they do not cause problems downstream and routed accordingly.
3.2
Reducing the Amount of Manual Inspection and Delays in the Slab YardOnly a small fraction of steel semis are ever manually inspected, due to the time taken to complete the assessment and the costs involved.
and iron oxide scale, making small defects very difficult to see. An on-line inspection system would inspect all semis for their surface quality, thereby allowing operators to send the semis to the relevant downstream processes without incurring significant delays.
For internal inspection, a thin slice is cut off the as-cast semi and the sample is prepared before taking sulphur prints for inspection. (Sulphur prints are taken using photographic bromide paper, soaked in sulphuric acid and pressed onto a ground steel surface. The sulphur print shows sulphur segregation which can outline the primary grain structure and internal defects.) Small representative samples may also be taken for metallurgical examination, using microscopes. This technique can only be completed after a few days when the steel has been cooled sufficiently and only checks a small volume of steel being cast. An on-line inspection system would be able to find internal defects throughout an entire semi, not just a small sample. With enough confidence in the system, the costly procedure involved in taking sulphur prints could be considerably reduced when replaced with an on-line system. This would reduce significantly the delays for downstream processes that currently need to wait for the sulphur print results before performing subsequent processing.
3.3
Reducing the Costs Associated with ScarfingWhen a steel grade is required to have a very good surface quality, scarfing is conducted, which is a process whereby approximately 5 to 10 millimetres of the steel surface of a semi are removed using oxygen-propane torches that bum off the top, bottom and side faces of a slab. This means that only surface defects are removed provided they are shallower than the depth being scarfed off. This surface rectification is a costly process in terms of equipment, manpower and energy that can result in significant yield losses of up to 7%(4).
4.
HOW NON-CONTACT
LASER-EMAT
(ULTRASONIC)
TECHNOLOGY WAS SELECTED BY REVIEWING THE
LITERATURE
A variety of different on-line systems for both surface and internal inspection are available for use within the steel industry and these were assessed as part of a review of the literature(4), but some of the techniques cannot be applied in the manufacturing environment of the continuous caster. These harsh environments pose significant problems and therefore demand industrially robust sensors and instruments to accommodate this, for a variety of reasons, which include:
1) Large vibrations of the manufacturing machinery.
2) The hot, dirty environment caused by mould powder and iron oxide scale that can clog instruments and mechanical parts.
3) The temperature of the steel product can be in the range of 600°C to 1100 °C and therefore there is a need to ensure that a sensor is not affected by the Curie Point which is approximately 770°C.
4) Steel can be moving at speeds between 0.5 m/min and 5 m/min.
It is therefore highly desirable that sensors and instruments used in the steel industry be non-contact and are able to work at high temperatures so they can function reliably for an extended period of time in a harsh industrial environment with minimal maintenance requirements. This is because any sensor in physical contact with a casting strand would not survive for long unless it had excellent heat resistant properties. There is also a need to make any results from an inspection system suitably easy to interpret for operators or for an automated inspection system.
A summary of different inspection techniques available is given in Table
1,
along with an assessment of their suitability for on-line inspection in the unique operating environment of the steel industry. Each of these technologies is considered in Engineering Doctorate Submission Number 2(4). From Table 1, it can be seen that the only technique available for inspecting the internal quality of a "semi" on-line is ultrasonic. Surface quality could be assessed using ultrasonics or alternative methods such as Eddy current(lI-14) and Conoscopic Holography(lo.15-17). However having a system that could find internal and surface defects at the same time should be the most cost effective. Because the steel is moving and is in excess of 700°C, any contact ultrasonic method can be eliminated from the list of potential systems as any probe or sensor within such close contact with the hot, moving steel would not survive for long due to the harsh environment and therefore a non-contact ultrasonic system must be used. The literature was investigated further to ascertain what the current non-contact ultrasonic state-of-the-art system could be and to investigate the possibility of using such a system in the steel industry(5). This Engineering Doctorate Submission detailed some of the work accomplished by some of the major worldwide steel manufacturers, universities and companies working in the non-contact ultrasonics field at high temperatures and showed that no system was commercially available off-the-shelf.of a high energy, pulsed laser beam system(4-6,18-28). Reception of the ultrasound can be via an electromagnetic coupled device such as an EMAT (ElectroMagnetic Acoustic Transducer) or a laser interferometer system(4-6,29-3 I). Ultrasonics can also be used to gauge crack depth(1 I).
Laser interferometers are prohibitively expensive and multiple interferometers would need to be purchased to inspect a steel slab. However, relatively inexpensive EMA Ts could be used in an array configuration to detect defects. From the review of the literature(4,5), it could be shown that Laser-EMAT technology had the potential for being engineered for the high temperature, on-line inspection of semis(4,5,21,29,32-36). Laser-EMAT systems have been developed in the past for on-line inspection of steel plates at room temperature and hot pipes, although neither of these systems is available commercially (37-40).
Table 1
Summary of different inspection types, indicating the suitability of each technique for inspecting hot, moving steel
Can Is the Can it be used Suitable for surface, sub- What are the diSadvantages of the technique? technique technique at surface or internal defect
be used non- temperatures detection?
on-line? contact? > 700'C?
OPTICAL TECHNIQUES
- - -
---Human Visual Ins~ection
--
V -V Partially Surface only Open to human interpretation---IC_CDNideo Cafl!jlra . V V V Surface onl Scale/rough steel surface gives false readings
---CO'l2-~iCJ::lologra h - - - V V _ V_ Surface onty OnJy for use on longitudinal cracks-Laser Triangulation V V V Surface and sub-surface' Large defects only
Scarfing Spark - - -
-
V V - V Surface and sub-surface' Automated system not as quick as manual scarfingTHERMAL TECHNIQUES
- -
- I·-Infrared Camera V V V
-
Surface on!Y Scale/rough steel surface gives false readings ELECTROMAGNETIC TECHNIQUES-
-Eddy Current - - V V V Surface and sub-surface' Surface. Sub-surface possible if steel Is above Curie Point.
-ULTRASONIC TECHNIQUES
-- --
-
-
-Piezoelectric V N N All Contact and needs couplant
ElectroMagnetic Aco~nsducers V V V Surface and sub-surface' Small stand-off. Difficult to probe for Intemal defects when lEMATs
- - -
-
hot.Laser-EMAT V V
I- V All Small stand-off for EMAT
Laser-Lmr V V .:L...
--
Ali Expensive. Sensitive to surface finish, e.g. scaleS~-Wheel - V N N
--
All Contact. Corus system does not work on products >1cm
-OTHERJECHNIQUES
-
--Dye Penetrant J N
-
N - Surface only Off-line--Sul~hur Printing N N
I- N
-
Internal only Off-line. Only small sample taken from steel cast -~agnetic Flux leakage ~ - V .:L N Surface only Onl useful for steel below Curie Point-Magnetic Particle Inspection (MPI) V V N 1- Surface only Lack of automatic focusing and needs a flat surface ~s and Gamma Ra~ '----_ _ N V
-
- -N Surface only Cannot be used on moving objectsMicrowave - - V V V All Large defects onx
5.
STEPS TAKEN TO DEVELOP AN ON-LINE SYSTEM
The review of the literature showed there was no commercially available Laser-EMA T system suitable for on-line inspection of hot, moving steel(3). Therefore research and development work was undertaken to develop technology that was laboratory based and primarily designed for testing stationary cold steel (i.e. steel at room temperature) in order to create a novel, prototype system suitable for the on-line inspection of hot (Le. steel above 600 °C), moving steel. At the start of the Engineering Doctorate, the expertise rested with the Ultrasonics Group at The University of Warwick, who could test stationary steel samples at room temperature and find defects in the steel. Some high temperature trials have previously been conducted at Warwick in the mid 1990s and the results of these have been published(l9,20). At Corus, expertise was developed and a new facility where Laser-EMA T technology could be designed and developed in order to inspect moving steel at high temperatures was built as part of this project.
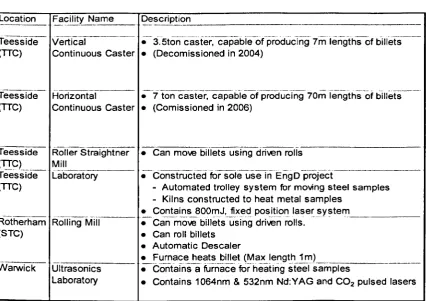
[image:15.543.49.476.417.718.2]Corns has pilot scale mills at its two UK research sites; Teesside and Rotherham. The facilities used as part of this project are summarised in Table 2. Standard practice at Corns involves rigorously testing any new equipment on the pilot mills before installing it in a commercial manufacturing plant. Therefore, Corns utilises pilot plants (i.e. smaller versions of the manufacturing machinery steel plants) to conduct a series of tests under different controlled conditions to validate systems. The following sections demonstrate how these facilities were used to validate the Laser-EMAT system,
Table 2
A list of facilities used during the course of the project
location Fa~ility Name
---~_escription
TeessTCfe Vertical ~ 3. 5toncasier~ capabieo(producTi,g 7mlengthsof billets---(TTC) Continuous Caster • (Decomissioned in 2004)
Teesside Horizontal--- ; -i ton caster~apat.:>-leorproducTng 70m len-gths-of billets ---(TTC) Continuous Caster • (Comissioned in 2006)
Teesside Roller Straightner (TTC) Mill
Teesside Ll:iboratory---(TTC)
= , : -• Can move billets using driven rolls
--- ---• Constructed for sole use in EngD project
- Automated trolley system for moving steel samples - Kilns constructed to heat metal samples
______ • Contains 800mJ, fixed position laser system
Rollii1gMii-1 - - ; -Can~-mo~ billets using dri~-n rolls. - - _._-" Rotherham
(STC) • Can roll billets
• Automatic Descaler
• Fumace heats billet (Max length 1 m)
Warwick U--cI:t:-r-as-o-n~ic-s--- ~containsa fijrnacetOr-heating steel samples
6.
LASER-EMAT THEORY
6.1 The Laser Beam as a Broadband Ultrasonic Source
Defects in steel can be detected (i.e. their location found and sized) using ultrasonics. In Laser-EMAT technology, a pulsed laser beam incident on the sample surface can generate ultrasonic waves in steel(18-28). This happens when a high energy density pulsed laser beam (at Corns this is 800 mJ at 1064 nm with a beam diameter of 6 mm or a different laser with 150 mJ at 532 nm with a beam diameter of 5 mm) is incident on a sample surface, resulting in a plasma being formed from ablation of the steel surface and breakdown of air(21). At room temperature, approximately 4% of this energy is absorbed by a clean steel surface and some of this energy is converted to ultrasound(21). The shape of the impact point on the steel is approximately circular, as this represents the natural shape of the laser beam. The diameter of the impact point is dependent upon the focused laser beam diameter and when this is significantly less than the ultrasonic wavelength considered, then the laser beam can be considered as a point source. (The optimal laser beam diameter was determined by experiment(6) by acquiring ultrasonic waveforms at different focal lengths for a particular EMA T design). When viewed from above, a laser beam point source will generate surface wave fronts that are approximately circular on the surface of the sample and these can be seen in Fig. 3a. A point source will generate wavefronts on the surface of the sample that are surface waves which are 2-D in nature and can be seen in Fig. 3b. The use of bulk waves to find internal defects is detailed in Section 6.4.
Laser beam point source
Fig. 3a: Plan view of wavefronts emanating from a point source.
Fig. 3b: Plan view showing the curved wavefront reaching the linearly wound
EMAT coil.
6.2
The EM AT as an Ultrasonic ReceiverThe approach to monitoring the received ultrasonic signals is dependent upon the alignment
between the linear EMAT coil and the crack orientation. Therefore the relative position and
distances between the EMA T coil, laser and defect are all-important. This configuration is also
dependent upon the dimensions of the steel product.
6.3 How Surface waves can be used to Find Defects
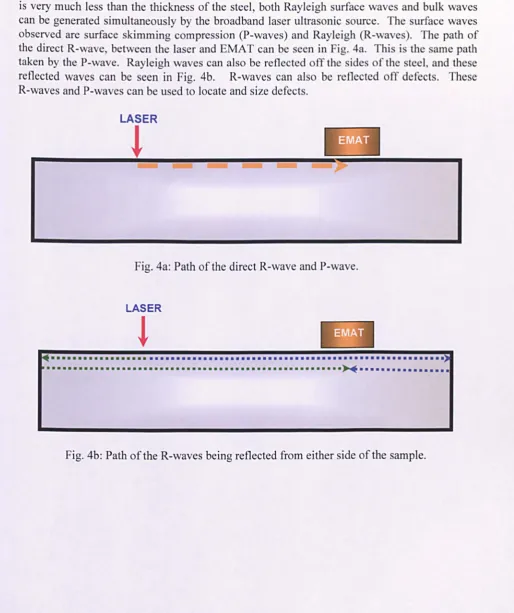
On thick samples where the wavelength of ultrasonic waves generated by the pulsed laser beam
is very much less than the thickness of the steel, both Rayleigh surface waves and bulk waves
can be generated simultaneously by the broadband laser ultrasonic source. The surface waves
observed are surface skimming compression (P-waves) and Rayleigh (R-waves). The path of
the direct R-wave, between the laser and EMA T can be seen in Fig. 4a. This is the same path taken by the P-wave. Rayleigh waves can also be reflected off the sides of the steel, and these reflected waves can be seen in Fig. 4b. R-waves can also be reflected off defects. These R-waves and P-waves can be used to locate and size defects.
Fig. 4a: Path of the direct R-wave and P-wave.
LASER
l
[image:17.533.8.522.158.771.2].•...
...••...•
...•...
.
~•...•....•
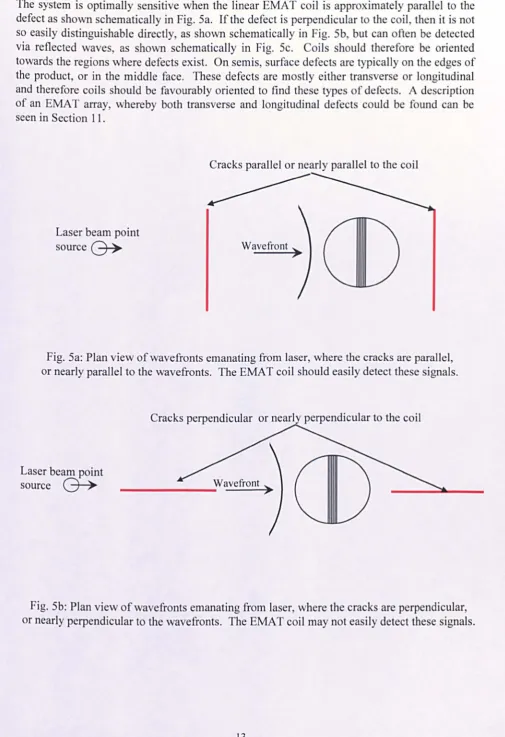
The system is optimally sensitive when the linear EMA T coil is approximately parallel to the defect as shown schematically in Fig. 5a. If the defect is perpendicular to the coil, then it is not so easily distinguishable directly, as shown schematically in Fig. 5b, but can often be detected via reflected waves, as shown schematically in Fig. 5c. Coils should therefore be oriented towards the regions where defects exist. On semis, surface defects are typically on the edges of the product, or in the middle face. These defects are mostly either transverse or longitudinal and therefore coils should be favourably oriented to find these types of defects. A description of an EMA T array, whereby both transverse and longitudinal defects could be found can be seen in Section 11.
Laser beam point source~
Fig. 5a: Plan view of wave fronts emanating from laser, where the cracks are parallel,
or nearly parallel to the wavefronts. The EMA T coil should easily detect these signals.
Laser beam point
source ~
Cracks perpendicular or nearly perpendicular to the coil
[image:18.533.13.518.46.783.2]Laser beam point
source O~ Wavefront)
Fig. 5c: Here, a wavefront is being reflected off the crack and detected by the EMA T.
Figure 6a shows a plan view of a steel sample, showing the relative position of a laser beam
and EMAT coil. Here, the direct R-wave is indicated on the schematic and the arrival time of this wave can be calculated using the equation t = d/v, where t is time, d is distance between
laser beam and EMAT coil and v is the velocity. The arrival time of the Rayleigh wave can
then be calculated using the velocity of ultrasound in mild steel at room temperature
(2996 ms-1(41)) provided the distance between the laser generator and EMAT receiver is known.
The P-wave travels the same distance, but has a velocity of 5960 m/s(41) and therefore this wave
arrives at approximately half the time of the direct R-wave. An accurate method for
determining the velocity of ultrasound in steel is detailed in Engineering Doctorate Submission
Number 4(6).
The R-wave is clearly distinguishable as it has significantly higher amplitude as compared with
the P-wave and indeed the other ultrasonic waves. This is mainly due to the R-wave having a
lower geometric attenuation. The R-wave can also be reflected from the edges of a sample and
be detected by the EMA T coil.
Direct
Reflected Rayleigh
wave
e
Centre of---r
--
-
--
-
---
EMATcoil~:v~"gh
__-
0
---- _____
_
___
_
Centre oflaser beam
Fig. 6a: Plan view of the billet being tested. Nothing is blocking the path between
the laser and EMA T.
Figure 6b shows a plan view of a steel sample, showing a defect blocking the direct path
between the laser beam and EMA T coil. Because the Rayleigh wave is broadband, lower
frequency components of the Rayleigh wave with wavelengths longer than the defect depth can
at least partially propagate under a defect and be detected by the EMAT coil(l8). The R-wave
that propagates under the defect may also have enough energy to be reflected off the sample
wavelength, the R-wave can be attenuated so much that it is not detectable(18). The P-wave might also be detectable some distance after the crack, but may not be detectable immediately
after the crack. It can be detected if the EMA T is located further away from the defect as the P-wave is associated with a bulk compression wave. The R-wave can also take longer to arrive when a defect is present due to only the lower frequency content passing under the defect and it requires some propagation distance fro the crack for energy to propagate back up to the surface boundary.
A detailed example of how a defect can be found when the steel is moving is given in Section 9.
6.4
--
-
---
-
--
8
----
--
---
-
~
~:r :~il
Centre of
---I---~--- defect
---0 --- Centre of
laser beam
Fig. 6b: Plan view of the billet being tested. Here, a defect is blocking the path between the laser and EMA T.
How Bulk Waves Can be Used to Find Internal Defects
When the laser beam and EMA T are positioned on the top surface of the steel, in addition to
the R-wave, shear (S-wave) and longitudinal (L-wave) waves can both be generated
simultaneously. The attenuation of bulk and Rayleigh waves is different, due to the way their energies are spread. The energy of the R-wave is localised on the surface around a
circumference of a circle, whereas bulk wave energy is localised on the surface of a hemisphere
and is therefore geometrically attenuated more strongly than the R-wave. The exact
distribution of bulk wave energy is non-trivial(21). These bulk waves reflect off the bottom
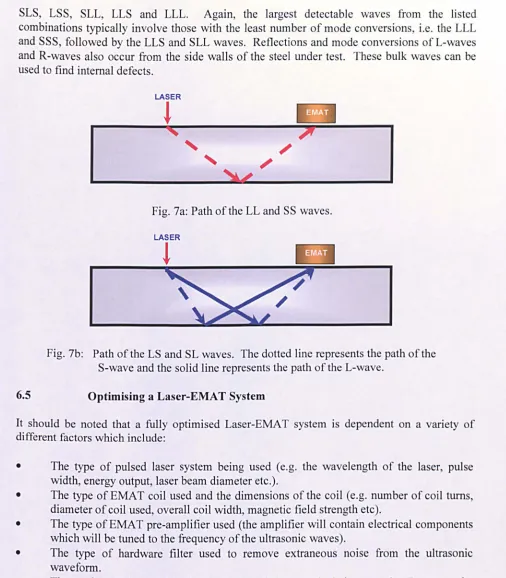
surface of the sample and can then form shear bulk waves (SS) and longitudinal bulk waves (LL). This path can be seen in Fig. 7a. Additional waves can also be detected, such as SL (shear to longitudinal waves) and LS (longitudinal to shear waves) which have mode converted on reflection from the back surface and the path of these waves can be seen in Fig. 7b. In
addition to these waves, multiple wave reflections can occur, and these include the following wave combinations; LLLL, LLLS, LLSL, LSLL, SLLL, LLSS, LSLS, SLSL, SSLL, LSSL,
LSSS, SLSS, SSLS, SSSL and SSSS. Typically, the largest detectable waves from the listed combinations involve those with the least number of mode conversions, i.e. the LLLL and SSSS, followed by the LLLS and SLLL waves. However, it should be noted that the appearance of these waves is dependent on a number of factors including; the characteristics of the generation source used, the characteristics of the receiver, the dimensions of the steel and
SLS, LSS, SLL, LLS and LLL. Again, the largest detectable waves from the listed combinations typically involve those with the least number of mode conversions, i.e. the LLL
and SSS, followed by the LLS and SLL waves. Reflections and mode conversions of L-waves
and R-waves also occur from the side walls of the steel under test. These bulk waves can be used to find internal defects.
6.5
LASER
!
I
,
,
,
"
I
Fig. 7a: Path of the LL and SS waves.
Fig.7b: Path of the LS and SL waves. The dotted line represents the path of the S-wave and the solid line represents the path of the L-wave.
Optimising a Laser-EMAT System
It should be noted that a fully optimised Laser-EMA T system is dependent on a variety of different factors which include:
• The type of pulsed laser system being used (e.g. the wavelength of the laser, pulse width, energy output, laser beam diameter etc.).
• The type of EMAT coil used and the dimensions of the coil (e.g. number of coil turns, diameter of coil used, overall coil width, magnetic field strength etc).
• The type of EMA T pre-amplifier used (the amplifier will contain electrical components which will be tuned to the frequency of the ultrasonic waves).
• The type of hardware filter used to remove extraneous noise from the ultrasonic waveform.
• The surface and material characteristics of the sample being tested. For example, different surfaces will vary the frequency dependant attenuation. Scale may also affect
the performance of both the laser generation source and the EMA T and the presence of scale is discussed later in Section 7.1.
Therefore a balance was achieved via experimentation whereby all these different factors were
[image:21.532.10.516.36.614.2]7.
7.1
DEVELOPMENT OF AN EMAT SENSOR CAPABLE OF
WITHSTANDING TEMPERATURES GREATER THAN
1000
0C
Mechanisms that Affect Ultrasonic Signals when the Steel is Hot
Different factors affect the measured amplitude of the ultrasonic waveforms at high temperatures. The EMA T used in these particular experiments utilises both the Lorentz force and magnetoelastic mechanisms when the steel is ferromagnetic (i.e. below the Curie point which is approximately 770°C). At room temperatures, below the Curie point, ultrasonic attenuation is relatively lower and consequently the waveform amplitudes are typically very high and a good signal to noise signal ratio can be achieved.
When the temperature is above the Curie point, the following effects are evident:
• The amplitude of the ultrasonic waves detected by the EMA T decrease due to the changes in the material properties of the sample. There is an increase in the attenuation of the received ultrasonic signals. This means the signal amplitude is decreases. Above the Curie point, when the steel is paramagnetic, the magnetoelastic mechanism is lost and electrical conductivity decreases and therefore the EMA T becomes far less sensitive to ultrasound(l9).
• One advantage, according to Scruby(21), is that 35% less optical power from a laser is needed to generate the same amount of ultrasound at 1000 °C than at 0 °C. More energy is absorbed by the hot steel at higher temperatures. The skin effect of the steel also varies with temperature. The skin effect is important as it affects the absorption of the laser energy and therefore the resulting size of the ultrasonic waves generated in the steel. This is in contrast to the point raised above.
• The magnetic field generated by the NdFeB magnet used in the EMAT decreases with temperature because the magnet temperature increases, meaning there is a drop in the magnetic field strength. This means the received signals have a smaller amplitude. • The average grain size increases as the steel is heated. Larger crystals cause the
ultrasound to attenuate further(42).
The amplitude of received ultrasonic waves is also dependent on the formation of scale/oxide on the surface of the steel(l9,34). If the scale is very well adhered onto the surface, the ultrasonic signals can increase in amplitude when the magnetite scale (Fe304) is below its Curie point at approximately 550°C. Any loose, flaky scale needs to be removed, as the ultrasound cannot be detected efficiently due to the poor coupling between the steel and the scale. This problem could potentially be overcome by using wire brushes, compressed air or an electromagnet, which could be used to remove loose scale prior to the steel passing the EMA T sensors in a production plant. Scale was not problematic during the hot trials conducted as part of this project(6).
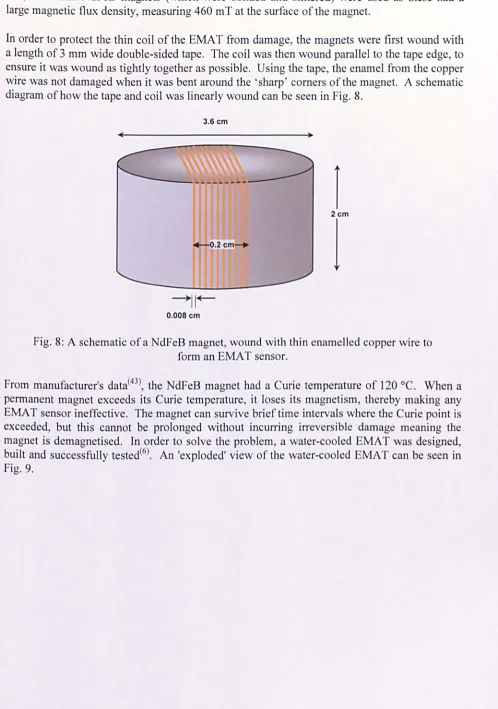
this, rare earth NdFeB magnets (which were bonded and sintered) were used as these had a
large magnetic flux density, measuring 460 mT at the surface of the magnet.
In order to protect the thin coil of the EMAT from damage, the magnets were first wound with
a length of 3 mm wide double-sided tape. The coil was then wound parallel to the tape edge, to
ensure it was wound as tightly together as possible. Using the tape, the enamel from the copper wire was not damaged when it was bent around the 'sharp' comers of the magnet. A schematic diagram of how the tape and coil was linearly wound can be seen in Fig. 8.
3.6 em
'"
~---l
2em
1
----+II~
0.008 em
Fig. 8: A schematic of a NdFeB magnet, wound with thin enamelled copper wire to form an EMA T sensor.
From manufacturer's data(43), the NdFeB magnet had a Curie temperature of 120°C. When a
permanent magnet exceeds its Curie temperature, it loses its magnetism, thereby making any
EMA T sensor ineffective. The magnet can survive brief time intervals where the Curie point is
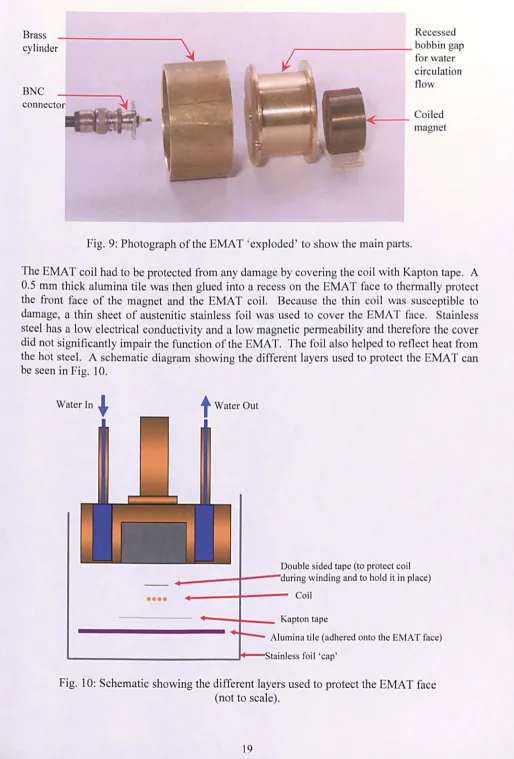
exceeded, but this cannot be prolonged without incurring irreversible damage meaning the magnet is demagnetised. In order to solve the problem, a water-cooled EMA T was designed,
built and successfully tested(6). An 'exploded' view of the water-cooled EMAT can be seen in
[image:23.532.23.521.57.766.2]Brass cylinder
BNC
connector
Recessed
,--_ _ _ _ _ _ _ _ bobbin gap
for water circulation flow
Coiled 4
-magnet
Fig. 9: Photograph of the EMAT 'exploded' to show the main parts.
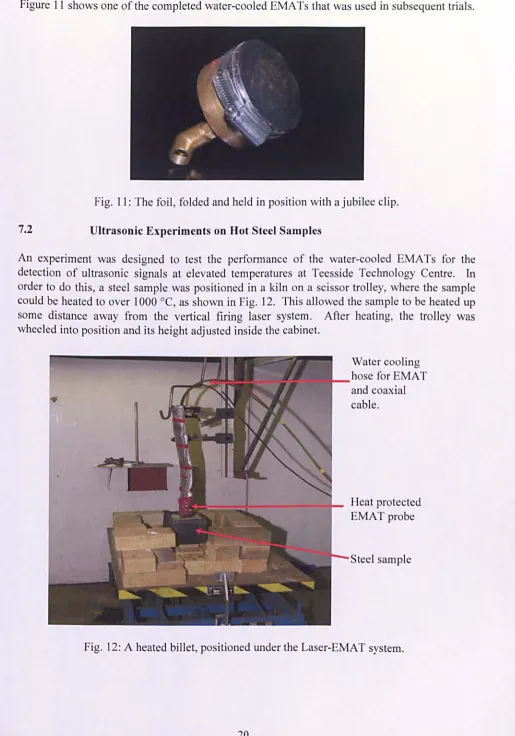
The EMAT coil had to be protected from any damage by covering the coil with Kapton tape. A
0.5 mm thick alumina tile was then glued into a recess on the EMA T face to thermally protect the front face of the magnet and the EMAT coil. Because the thin coil was susceptible to
damage, a thin sheet of austenitic stainless foil was used to cover the EMA T face. Stainless steel has a low electrical conductivity and a low magnetic permeability and therefore the cover
did not significantly impair the function of the EMA T. The foil also helped to reflect heat from the hot steel. A schematic diagram showing the different layers used to protect the EMA T can be seen in Fig. 10.
Water In
~
••••
t
Water OutDouble sided tape (to protect coil _ - - --1- - -,during winding and to hold it in place)
Coil
~-~I-__ Kapton tape
- - - - Alumina tile (adhered onto the EMAT face)
Stainless foil 'cap'
[image:24.532.6.520.28.787.2]Figure 11 shows one of the completed water-cooled EMA Ts that was used in subsequent trials.
Fig. 11: The foil, folded and held in position with ajubilee clip.
7
.
2
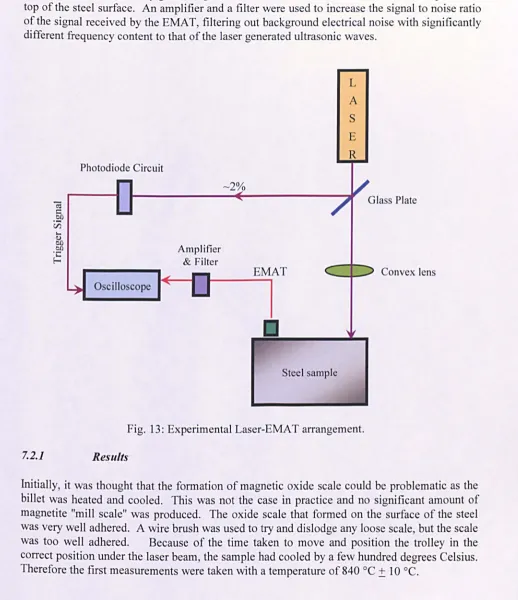
Ultrasonic Experiments on Hot Steel SamplesAn experiment was designed to test the performance of the water-cooled EMA Ts for the detection of ultrasonic signals at elevated temperatures at Teesside Technology Centre. In order to do this, a steel sample was positioned in a kiln on a scissor trolley, where the sample could be heated to over 1000 DC, as shown in Fig. 12. This allowed the sample to be heated up
some distance away from the vertical firing laser system. After heating, the trolley was
wheeled into position and its height adjusted inside the cabinet.
Water cooling hose for EMA T and coaxial cable.
Heat protected
EMAT probe
Steel sample
Figure 13 shows a schematic diagram of the apparatus that was used in the initial experiments.
Here, the laser beam was directed through a glass plate. Around 2% of the light is then reflected off this plate and onto a photodiode circuit wired up in reverse bias. When the photodiode receives the light from the pulsed laser beam, it produces a sharp positive voltage
signal, which can be used as a trigger for the oscilloscope data logger. The majority of the laser beam energy passes through the glass plate and is then focused through a lens onto the
surface of the steel, thereby generating the ultrasound. The water-cooled EMAT was placed on
top of the steel surface. An amplifier and a filter were used to increase the signal to noise ratio of the signal received by the EMA T, filtering out background electrical noise with significantly
different frequency content to that of the laser generated ultrasonic waves.
Photodiode Circuit
Amplifier
& Filter
Oscilloscope
EMAT
Steel sample
L
A
S
E
Fig. 13: Experimental Laser-EMA T arrangement.
7.2.1 Results
Convex lens
Initially, it was thought that the formation of magnetic oxide scale could be problematic as the billet was heated and cooled. This was not the case in practice and no significant amount of magnetite "mill scale" was produced. The oxide scale that formed on the surface of the steel was very well adhered. A wire brush was used to try and dislodge any loose scale, but the scale
was too well adhered. Because of the time taken to move and position the trolley in the correct position under the laser beam, the sample had cooled by a few hundred degrees Celsius.
[image:26.532.5.523.137.737.2]A thermocouple was used to measure the temperature of the sample surface and another
thermocouple was inserted into a drilled hole in the centre of the sample to measure the internal temperature. The ultrasonic results from the hot billet over a range of temperatures can be seen
in Fig. 14, showing that the ultrasonic signals' amplitudes are reduced significantly at higher
temperatures. It can be seen from the graphs that as temperature rises, the velocity of the
ultrasonic waves decrease leading to the observed increase in the arrival times in the various waveforms.
(i) 50
~
c
::l
~
n:s
~
a
.0
'-<3:
--
CI)C)
.5 -50
o
>
R-wave
- 694°C (Centre) & 655°C (Surface)
"I"-....,..,_~""'""~
-
707°C (Centre) & 669°C (Surface)- 727°C (Centre) & 690°C (Surface)
'-""""""----""""'1
-
736°C (Centre) & 701°C (Surface)/I/V1""""',..,..,. ... _ - -_ _ _ _ "'"'"'-____
---
I
__
758°C (Centre) & 721°C (Surface)I W - . / \ I V - - - -_____ - - - -... I- -783°C (Centre) & 739°C (Surface)
- 824°C (Centre) & 772°C (Surface)
- 838°C (Centre) & 785°C (Surface)
a
20 40 60 80Time I (~s)
Fig. 14: Averaged ultrasonic signals taken at a variety of different temperatures.
The RMS (Root means squared) of the signal and noise was found before calculating the signal-to-noise (SIN) ratio for each of the A-Scans. The RMS was calculated by:
RMS
=)~
L
Y
/
(Equation 7.1)Where n is the number of points and 1'iis the relative amplitude of the signal.
The standard deviation, (STDEV) is calculated by:
STDEV= (Equation 7.2)
The following equation was used to find the SIN ratio:
RMS
SIN R (. - 20 I SIgnal
a 10 - . oglo
RMSNOIse
(Equation 7.3)
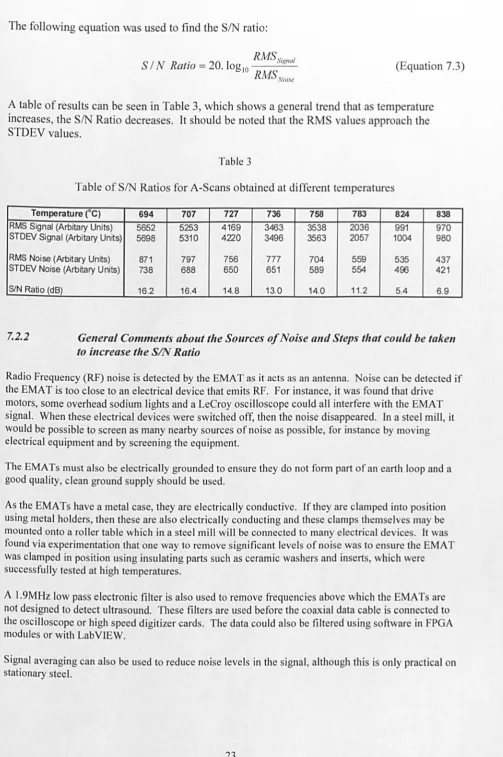
A table of results can be seen in Table 3, which shows a general trend that as temperature increases, the SIN Ratio decreases. It should be noted that the RMS values approach the STDEV values.
Table 3
Table of SIN Ratios for A-Scans obtained at different temperatures
Temperature (oe) 694 707 727 736 758 783 824
RMS Signal (Arbitary Units) 5652 5253 4169 3463 3538 2036 991
STDEV Signal (Arbitary Units) 5698 5310 4220 3496 3563 2057 1004
RMS Noise (Arbitary Units) 871 797 756 777 704 559 535
STDEV Noise (Arbitary Units) 738 688 650 651 589 554 496
SIN Ratio (dB) 16.2 16.4 14.8 13.0 14.0 11.2 5.4
838 970 980
437 421
6.9
7.2.2 General Comments about the Sources of Noise and Steps that could be taken
to increase tlte SIN Ratio
Radio Frequency (RF) noise is detected by the EMA T as it acts as an antenna. Noise can be detected if the EMA T is too close to an electrical device that emits RF. For instance, it was found that drive motors, some overhead sodium lights and a LeCroy oscilloscope could all interfere with the EMAT signal. When these electrical devices were switched off, then the noise disappeared. [n a steel mill, it would be possible to screen as many nearby sources of noise as possible, for instance by moving electrical equipment and by screening the equipment.
The EMA Ts must also be electrically grounded to ensure they do not form part of an earth loop and a good quality, clean ground supply should be used.
As the EMA Ts have a metal case, they are electrically conductive. ff they are clamped into position using metal holders, then these are also electrically conducting and these clamps themselves may be mounted onto a roller table which in a steel mill will be connected to many electrical devices. Jt was found via experimentation that one way to remove significant levels of noise was to ensure the EMA T was clamped in position using insulating parts such as ceramic washers and inserts, which were successfully tested at high temperatures.
A 1.9MHz low pass electronic filter is also used to remove frequencies above which the EMATs are not designed to detect ultrasound. These filters are used before the coaxial data cable is connected to the oscilloscope or high speed digitizer cards. The data could also be filtered using software in FPGA modules or with LabVIEW.
[image:28.543.29.533.26.784.2]7.2.3 Steps Taken to Improve the Quality of Ultrasonic Signals at High Temperature
Initial trials showed a significant decrease in the detected R-wave amplitude (Fig. 14) above the Curie point for the steel. A variety of different techniques were therefore used to enhance
the received signals and solve the problem, which included:
•
•
•
7.
3
A new EMA T pre-amplifier was constructed for subsequent trials. The amplifier had an increased gain and a better signal to noise ratio.
A thinner gauge wire (0.08 mm) was used in the EMA T detection coil. Initial tests used a wire with a diameter of 0.12 mm. This resulted in the EMAT coil having more turns, but the same width as in previous designs, which increased the sensitivity of the EMAT due to the larger coil inductance.
A plano-convex lens was used to focus and decrease the laser beam diameter which increased the power density from 2.0 TWm2to 18.2 TWm2 (21,34).
Additional Tests and Results Conducted at High Temperature
After these enhancements were implemented, more trials were performed on hot samples at
Teesside Technology Centre. Results were obtained from 730°C to room temperature and Fig.
15 shows some of these results plotted along the same axes.
U) ::: c:: :> ~ CO :::
.c
...
~
-
CI) C) CO...
'0 >I
,.
R-Wave1
11'
""
V'-I~,~
--'\i'
I
2.0
IJIL.. ,A
lr"
v1.S -
~
4J'A... .A
~:
v
-J\
1.0
"
V
It. .J\
~.a
0.5
-lAA. 1 \ "
0.0
~
A
V
- jl,A
~
J\AV
,
a so
~
..
...
--
... --..,
100 Time I (us)'v
'V
~
'73Soe Single Shot' '716°e Single Shot' - '69Soe Single Shot' - '679°e Single Shot'
1< '640oe Single Shot'
- '616°e Single Shot'
- 'S97°e Single Shot' - 'S66°e Single Shot'
- 'S2Soe Single Shot'
- 'S10oe Single Shot'
- '490oe Single Shot' '472°e Single Shot'
. h .A. '443°e Single Shot'
.11. ,...
,
,150 200
[image:29.532.0.518.34.756.2]Table 4 shows higher SIR Ratios than those taken in previous trials, at a variety of different
temperatures. It should be noted that this data is 'single shot' and therefore shot-to-shot
variations when the laser beam hits the surface will affect the measurements. Table 5 shows
the results that were recorded when the data was averaged, meaning that single shot variation is averaged out and that random noise is not being saved. This is reflected in the data presented
in Tables 4 and 5 which show a higher SIN for averaged data.
Table 4
Table of SIN Ratios for A-Scans obtained at different temperatures for single shot data
Temperature (OC) 735 716 695 679 640 616 597 566 528 510 490 472 443
RMS Signal (Arbitary Units) 2278 1968 2357 2018 2523 2545 2723 2657 2303 2571 2807 2938 2671
STDEV Signal (Arbitary Units 2280 1969 2360 2690 2524 2521 2719 2630 2303 2570 2808 2936 2672
RMS NOise (Arbitary Units) 253 240 208 284 285 271 297 228 225 296 252 283 282 STDEV Noise (Arbitary Units) 253 240 208 284 285 270 296 226 218 293 247 286 278
SIN Ratio (dB) 19.1 18.3 21.1 17.0 18.9 19.5 19.3 21.3 20.2 18.8 20.9 20.3 19.5
Table 5
Table of SIN Ratios for A-Scans obtained at different temperatures when the data is averaged
Temperature rC) 679 640 616 597 566 528 510 490 472 443 RMS Signal (Arbitary Units) 2234 2335 2400 2527 2698 2377 2492 2531 2803 2799
STDEV Signal (Arbitary Units) 2472 2339 2381 2497 2532 2378 2493 2533 2802 2798
RMS Noise (Arbitary Units) 96 87 62 59 66 59 53 69 64 68
STDEV Noise (Arbitary Units) 95 86 55 48 59 49 43 59 55 58
SIN Ratio (dB) 27.4 28.6 31.7 32.7 32.3 32.2 33.4 31.3 32.8 32.3
Figure 16 compares two single shot A-Scans (from Fig. 15), one taken at 735
°e
and the other- '73SoC Single Shot'
- '443°C Single Shot'
0.00
~
GI -0.05
en
!! "0
>
-0.10
o 20 40 60 80 100
Time I (loiS)
Fig. 16: Comparison between two single shot A-Scans, taken at different temperatures.
Figure 17 shows a graph comparing a single shot A-Scan with an A-Scan that was averaged
100 times at a temperature of 679°C (the highest temperature where the data was averaged).
Here, it can be seen that the comparison in terms of clarity between single shot and averaged
data is very good and that both the P-wave and R-wave are easily distinguishable, For an
on-line system, good quality single shot data would be needed as the steel is moving. The
difference in arrival time between the single shot data and the averaged data can be attributed
to the time taken to average the data and save it onto floppy disk using the oscilloscope.
During this time, the billet was cooling and therefore the ultrasonic velocity was increasing during the measurements.
~
-
CI) Cl C1I-'0
>
- '679·C Averaged'
0.15 - '679·C Single Shot'
R-wave
0.10
0.05
P-wave
0.00
-0.05
o 20 40 60 80 100
Time I (IJS)
Fig. 17: Comparison between single shot and averaged data,
[image:31.532.13.526.11.785.2]Figure 18 shows a graph of Rayleigh wave velocity plotted against temperature. The velocity (v) was calculated by dividing the separation distance between EMAT (d) and laser by the arrival time (t) of the first maxima peak of the Rayleigh wave. Here, the velocities have been calculated from both the single shot and averaged A-Scan data. It should be noted that at the start of the experiment, no averaged data was recorded as the steel was cooling rapidly, hence the number of data points for the single shot data is not the same as those for the averaged data. For both sets of data, the ~ value has been calculated by plotting a least squares fit line through the data using Microsoft Excel. Here, r2 is calculated by dividing the variance from regression (SSR) by the variance from data (SST), as denoted by the equation below:
(Equation 7.4)
The error bars are calculated by considering the error in the temperature and velocity measurements. The error in the temperature measurement is very low, as Type K thermocouples exhibit an error level of around 0.75%(44). However, the largest error when measuring the temperature is the length of time taken to look at the reading and save the waveform data to disk, which can be up to 15 seconds when data is being averaged. Therefore the error in temperature measurements was taken to be ± 10
°e.
The error in the velocity value is dependent upon the errors in measuring the distance between laser beam and EMA T coil and the arrival time (I) of the R-wave. The distance between the centre of the laser beam and centre of the coil has an error, (Ad) to within ± 2 mm. The steel will also be contracting slightly as it is cooling which may affect the absolute distance between laser beam and EMAT receiver. The error in the arrival time (At) is dependent upon how the arrival time is measured. In this case, every arrival time from each A-Scan for all the different temperatures was taken from the same point, i.e. the first maximum on the R-wave sampled data. This maximum point is dependent upon the number of points in the R-wave peak and can therefore have a time error(At) of ± 20 ns. Therefore the error in the velocity (Av) can be calculated by:
800 750
E
700e
650.3 600
I!!
~ 550
E
~ 500
450
• Averaged Data
• Single Shot Data
- linear (Averaged Data) R2
=
0.9249- linear (Single Shot Data) R2
=
0.9799400 +---~----_.----~,_----~----~----_.----~,_----._----~
2440 2490 2540 2590 2640 2690 2740 2790 2840
Velocity (m/s)
Fig. 18: Graph of temperature against Rayleigh wave velocity,
for both the averaged and single shot A-Scan data.
2890
Figure 19 shows the graph ofP-wave velocity plotted against temperature, where the time data were extracted from the averaged A-Scan data (for some of the single shot data, the P-wave
was indistinguishable from background noise). The errors were calculated as for the R-wave calculations.
Because the velocity of the ultrasonic waves varies with temperature, it will be necessary for an
on-line system to be able to use the appropriate calibration velocity in any calculations to determine the expected arrival times of the waves. This would be relatively straightforward for
predicting the arrival time of the P-wave and R-wave. Should waveforms not arise when
expected, then this could mean that a defect is present and is blocking the ultrasonic path. It is more complex to predict bulk wave arrival times in hot steel as there is a steep temperature
gradient in the steel product. Experiments conducted for this project showed that thermal imaging temperature measurements of the steel surface correlate well with surface
temperatures of as-cast semis predicted using Finite Element Models (FEMi6). These same
models also predict what the internal temperature gradient is and therefore there is some confidence that the arrival times of bulk waves can be correctly predicted. Through
experiment, it should be possible for an on-line system to determine the approximate
750
700
[image:34.532.6.520.25.784.2]E
650...
I!! 600
:l
-
~ 550CII Q. E 500
CII
I-450
400 4850
7.4
• Averaged Data
- Linear (Averaged Data) R2 = 0.9828
4950 5050 5150
Velocity (m/s)
5250
Fig. 19: Graph of temperature against P-wave velocity, for both the averaged and single shot A-Scan data.
Summary
5350
The water-cooled EMA T and experimental arrangement allowed good quality, single shot data
8
.
8.1
DEVELOPMENT OF AN AUTOMATED
INSPECTION
SYSTEM
Construction of a Mechanical EMAT Holder to Accommodate Variability
in Product Thickness
An EMAT holder was designed and built to accommodate the Laser-EMA T system inspecting
steel with different thicknesses. Additionally, the holder was designed to solve the problem
whereby the product thickness can vary by a few millimetres during the continuous casting
process, when the dimensions of the steel can change due to the conditions in the casting
mould and forces exerted on the strand from the withdrawal rollers. Additionally, this
mechanical EMA T holder was designed to ensure a near constant stand-off above moving
steel. Another problem, whereby steel semis move up and down when passing over rolls also
needed to be solved. Therefore, because the stand-off between the EMA T and the billet could change rapidly, a solution involving a pantograph design was validated through
experimentation to ensure a near constant stand-off.
This comprised of a skid in which the EMA T could be held as can be seen in the schematics of Figs. 20a and 20b.
Laser path
t
Threaded height adjuster- - - Billet
1 4 - - - --I!--+-- EMA T
1 4 - - - ---ilr--ii - - Billet
Fig. 20b: Front/exit view of the EMA T pantograph.
A photograph of the pantograph being used in the Pilot Rolling Mill can be seen in Fig. 21.
Here, the skidlEMAT was successfully kept parallel to the steel surface. This was confirmed
by looking at video footage of the trial. Because the steel would be travelling backwards and
forwards in the Pilot Rolling Mill, a method to ensure the EMATs could be automatically
positioned on top of any hot steel semi was achieved by using a skid that was angled at both
ends. When the semi was moving and hit the skid, it was knocked upwards and then dropped
down onto the top face of the steel. Because the skid is angled at both ends, the steel can be
fed through the pantograph from both directions. This meant that for rolling mill trials, billets
could be passed backwards and forwards underneath the EMA T holder. The skid was made
from hard wearing carbon steel and was designed to be robust and long standing.
Propane
burners
Kiln
Fig. 21: Billet being inspected at room temperature,
[image:36.532.14.523.72.792.2]8.2
Constructing a New, Dedicated Data-logging PCSignificant amounts of data were required to be saved rapidly to a PC's hard disk during trials as part of this project. To solve this problem, a data-logging PC was designed and built. This PC had a motherboard with 5 PCI slots, 3 of which were occupied with 2-channel National Instruments high-speed digitiser cards, to simultaneously acquire data from up to six EMATs. This motherboard also contained SAT A interfaces allowing RAID-O hard disks to be used. At the time, these disks were the fastest way to save data. Additional fan cooling to keep the system operational was also installed.
Because each A-Scan is 80 kb in file size, when the laser operates at 20 Hz, 1.6 Mb of data needs to be written to disk every second for each EMAT. Therefore if the maximum array size of6 EMATs is used, 9.6 Mb of data needs to be written to disk every second. New LabVIEW software was written to save the data in National Instrument's proprietary TDMS and TDM format, which was found to be the fastest method of successfully writing large quantities of data (that is compressed) to disk.
It should be noted that the 80 kb file size is recorded using the highest possible sampling rate that the digitiser cards can acquire so that good quality signals can be achieved. For a plant based system, this file size would be significantly smaller. For example, 40,000 points of data are recorded in every A-Scan and this number could be significantly reduced. Similarly, data arriving from before the P-wave could be ignored. Having smaller file sizes would mean saving disk space and increase the speed of subsequent analysis. Typical computer screen resolution is 1280 x 800 pixels and therefore B-Scans should be optimised for this type of display output. However, for this project, as the capacity to save and analyse data was feasible, the highest possible sampling rates were used.