INCREASING THE RELIABILITY OF
SCORES OF CLASSROOM
OBSERVATION INSTRUMENTS FOR
PRE-SERVICE TEACHERS?
A.M. Broos
S1380117
EDUCATIONAL SCIENCE AND TECHNOLOGY UNIVERSITY OF TWENTE
SUPERVISOR M. Dobbelaer
K. Schildkamp
EXTERNAL ORGANISATION Christelijke Hogeschool Ede (CHE) EXTERNAL SUPERVISOR
A. van Tilburg
TABLE OF CONTENT
Acknowledgement 3
Abstract 4
1. Introduction 5
1.1 Problem Statement 5
1.2 Theoretical Conceptual Framework 7
1.2.1 Student Assessment in Authentic Practice 7
1.2.2 Classroom Observation 8
1.2.3 Rubrics as Observational Instrument 11
1.2.4 Reliability and Validity 14
1.2.5 Theoretical Validity Framework 15
1.3 Research Question and Model 17
2. Research Design and Methods 18
2.1 Research Design 18
2.2 Participants 19
2.3 Instrumentation 21
2.4 Procedure 23
2.5 Data Analysis 24
3. Results 26
3.1 Focus Group 1 – CHE Teachers 26
3.2 Focus Group 2 – ICOs and Mentors 26
3.3 Argument based approach to the Validity of the Original- and Experimental Rubrics 28
3.4 Experiment 30
4. Conclusion and Discussion 36
4.1 Discussion 36
4.2 Limitations and Recommendations 37
4.3 Conclusion 38
Reference List 40
Appendix A: Rubric VM1.2 Extern 43
Appendix B: Informed Consent Form 45
Appendix C: Form Descriptive Characteristics Participants Focus Group 46
Appendix D: Script regarding the Focus Groups 47
Appendix E: Forms with Rubric Elements for the Focus-Group with the CHE- Teachers 48
Appendix F: Questions for the Focus Groups with ICOs 52
Appendix G: Data Focus Group 1, with the CHE-Teachers 53
Appendix H: Adjusted Rubric for the Second Focus Group of Phase 1 56
Appendix I: Script Regarding the Experiment 57
Appendix J: Original Rubric for VM1.2, Fragment 1 59
Appendix K: Original Rubric for VM1.2, Fragment 2 60
Appendix L: Experimental Rubric for VM1.2 Fragment 1 61
Appendix M: Experimental Rubric for VM1.2 Fragment 2 62
Appendix N: Form Descriptive Characteristics Participants Experiment 63
ACKNOWLEDGEMENT
First of all I would like to thank the different supervisors that have helped me along the process of this research. As there are:
M. van Geel – my first supervisor who helped me with my first draft with regard to holistic- and analytic assessment
M. Dobbelaer – who kept patience when I was under pressure because of data-gathering deadlines and gave feedback on the report
K. Schildkamp – who supervised me, encouraged me and also gave feedback on the report A. van Tilburg – who was my first point of contact for this study’s institution. She made this
study possible by making time for this study on the ICOs training day. In addition I would like to thank:
My girlfriend and fiancé, A. van den Brink – who always has my back and believed in me. She was understanding when I had to spend more time on this study than I had
anticipated on.
My parents – for encouraging me to always challenge myself
All the CHE-teachers, ICOs and mentors - who gave input during the focus groups or participated in the experiment
ABSTRACT
One of the challenges teacher educators face today is to assess preservice teachers in a reliable and valid manner. Since teacher quality influences student results (Hattie, 1996), reliable and valid assessment is important to ensure and maintain teacher quality. More and more evidence emerges suggesting that assessment by observation is more suitable than using traditional measures such as knowledge tests or portfolio’s. However, assessment by observation comes with several issues, such as the lack of suitable standards, dealing with difference in interpretation of the observation
instruments or grades, or different assessment focus of assessors resulting in unreliable results. This study researches rubrics as observation instruments for the assessment of preservice teachers. This results in the following research question: How can the construct validity of a rubric be improved, and
to what degree can this improvement increase the inter-rater reliability of the rubric’s scores? In this
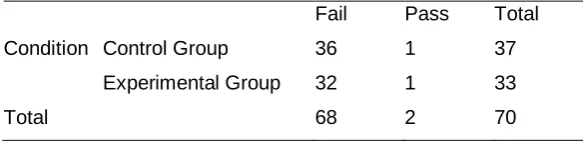
mixed method research, it is attempted to improve the construct validity of the rubric by organizing two focus groups (Phase 1), resulting in an experimental rubric. In the quantitative part (Phase 2), the Interrater Reliability (IRR) of the original rubric is investigated and compared to the IRR of the experimental rubric. Therefore, two lessons are being assessed by 70 participants in the control- and experimental group. The results show that, by use of the theoretical validity framework of Kane (2006), the construct validity of the experimental rubric has increased relative to the original rubric. However, the results also show that more adjustments could have been made in order to increase the construct validity. With regard to the IRR, calculations of the ICC, Fleiss’ Kappa and an analyzation of
dichotomous data with Fisher’s Exact test show no increase of the IRR of the experimental rubric relative to the original rubric. Moreover, this study indicates that the IRR for the rubric is poor. Several recommendations are being made with regard to the assessment instrument, for example to compose an assessment manual with general scoring guidelines. Moreover, it is suggested to implement a reliability threshold in order to warrant reliability of preservice teacher assessment.
Keywords
1. INTRODUCTION
This first chapter of this research report firstly contains the problem statement, where the problem is introduced and the goal and focus of the study is explained. Secondly, in the theoretical and
conceptual framework the main concepts of this study are discussed, that is “assessment of
pre-service teachers in authentic practice”, “Observation Instruments”, “rubrics as observational instrument”, “reliability and validity” and finally the “Theoretical validity framework” of Kane (2006). Thirdly, the research question is stated.
In this report, pre-service teachers are referred to as students, children attending the primary school are referred to as pupils, graduated primary school teachers are simply referred to as teachers
and teachers of educational programs are referred to as teacher educators.
1.1 Problem Statement
One of the common challenges teacher educators face today is to assess students in a reliable and valid manner. More and more evidence emerges suggesting that observationof students is more suitable to assess teaching, instead of traditional, less authentic measures (Pecheone & Chung, 2006, p. 23) such as knowledge test, portfolio-assessment or pupil results. Ideally, scores are exact
representatives of the assessed knowledge, skill, attitude and/or behaviour of the student,
independent of assessment and assessor. However, observations comes with subjectivity, since the assessor needs to interpret what he sees. The challenge arises to keep assessment trough
observations reliable and valid.
Reliable and valid student assessment is not only challenging, it is also important in order to measure educational quality (Creemers, Kyriakides & Antoniou, 2012). In short, reliability represents the degree to which input repeatedly gives the same output, validity represent the degree to which a measurement measures what it is intended to measure (Vos, 2009). There is a numerous amount of convincing evidence that teacher quality influences student results, as is concluded in the literature study of Hatty (1996) therefore reliable student assessment is needed to ensure their quality.
Moreover, student assessment serves a substantial gatekeeping function to determine which teachers are capable to start teaching. Finally, reliable assessment of students is needed for the accreditation of teacher educational programs, which is currently an international issue (Bryant, Maarouf, Burcham, & Greer, 2016).
Nevertheless, assessment trough observation brings several validity and reliability issues. With regard to validity, first correct standards are needed to assess students (Darling-Hammond, 2006, p.124). However, there are many different views on what those correct standards should comprehend in order to assess whether a student is a good teacher (Crebbin, 1997) and the same goes for the definition of “good” teaching (Sato, 2014). The search for this definition started decades ago but its outcome is still evolving (Margolis & Doring, 2013). Therefore, different classroom
between pupil and teacher determines the development of the child and therefore the quality of education (Stuhlman, Hamre, Downer, & Pianta, 2010). Not only different indicators can be used, assessors can also have a different definition or standards on what is “good” (Erdosy, 2003). At the moment there is no consensus on the correct standards for a “good” teacher. Secondly, these
standards, or criteria, can be interpreted differently by the assessor, “resulting in different meanings for the same scores“(Jeong 2015, p. 2). Therefore, one observation can lead to divergent scores from different assessors. Thirdly, teachers can have a different expectation regarding the same grade (Jeong, 2015). One teacher may have higher expectations of an “A” than another. Fourthly, issues immerge on how to correctly observe teachers’ influence on students’ behavior and results. According to Darling-Hammond (2006, p.121) it is difficult to uncover if changes in the student’s attitude or performance can be attributed to the student’s behaviour or are due to other circumstances. And finally, even if specific criteria are given, the assessor’s focus can be different, resulting in different scores (Jeong 2015).
With regard to reliability, four causes for a low measurement reliability can be named. With regard to observation sampling, organizational factors often limit the amount of observations that can be done by the assessor. However, one observation from one assessor is as half as reliable as three lessons that are observed by three assessors (Hill, 2012). Secondly, regarding the observation length, the assessor must have the time to observe long enough to assess reliably. For instance, with an observation length of 30 minutes, more student lessons need to be observed in order to maintain the same level of reliability as when the whole lesson is observed (Hill, 2012). Thirdly, a between-occasion
error can occur when circumstances unfairly influence the assessment outcomes, therefore
decreasing reliability (Vos, 2009). To illustrate, when the assessor feels good during the first observation but is ill during the second, circumstances can decrease a score unfairly therefore
decreasing the reliability. At last, between-rater errors can cause a decrease in reliability of the scores, for instance when different characteristics of assessors result in different outcomes (Vos, 2009).
This study attempts to gain insight in the reliability and validity of assessment of students through classroom observation in order to ensure minimum quality standards for primary school teachers. The primary schools rely on reliable and valid assessment to guarantee that recently graduated teachers possess the basic skills and knowledge to start working in the classroom. This study especially focusses on the influence of construct validity and the Inter-Rater Reliability (IRR). The influence of improving the construct validity of an observational instrument is investigated as a way to increase the IRR of the scores of such an instrument. This study therefore investigates to what extent an experimental rubric with an increased construct validity can lead to an increase of the IRR for that rubric.
This study therefore can contribute in the search on how to increase the reliability by investigating the scoring inference process of transferring the sample of observations into the
1.2 Theoretical Conceptual Framework
In the theoretical and conceptual framework the main concepts of this study are discussed. First of all, an introduction on assessment is given. Secondly, classroom observation is introduced as a way to assess students. Thirdly, rubrics are discussed as an instrument to observe students in authentic practice. Fourthly, reliability and validity are explained in order to address the reliability and validity of scores that originate from rubrics. Finally, the theoretical validity framework of Kane (2006) is
introduced in order to build an argumentation around a rubrics validity.
1.2.1 Student Assessment in Authentic Practice
Assessment can be defined as “a broad term for the evaluation of ‘something’ for some purpose” (Halpern, 2013, p. 361). Specified to the educational context assessment starts with gathering and using data, drawing conclusions and finally improving educational outcomes based on these conclusions (Halpern, 2013, p. 361). Specified to teachers, teacher performance assessment “specifies what teachers ought to know and be able to do in real teaching contexts” (Caughlan & Jiang, 2014, p. 378).
Assessment can serve different purposes. First of all, formativeassessment is focused on intermediate learning (Dixson, 2016) and therefore an important tool to teach students how to teach (Caughlan & Jiang, 2014, p. 378). In this case the assessment results can for instance be used halfway through the learning process to give feedback on the process or to further clarify learning goals and teacher’s expectations (American Educational Research Association, American Psychological Association, & the National Council on Measurement in Education [AERA, APA, & NCME], 1999). This is also referred to as low-stakes assessment. Secondly, summative assessment
is focused on measuring progress in a learning sequence (Dixson, 2016). This is also referred to as
high-stakes assessment since the assessment can be used to determine if an assessed learner is
capable to continue a learning process or to practice a profession. Thirdly, assessment also has purpose to improve teaching itself, according to Bryant et al. (2016). This is also a form of formative assessment but now the teacher can learn by analyzing the assessment scores. For instance, analyzing a learners’ weaknesses can give new insights for subsequent lessons or parts of the curriculum. Finally, summative assessment of the teacher or educational program can occur when accrediting an educational programs (Pecheone & Chung, 2006, p.25).
The many factors that influence teacher and classroom behavior make the assessment of students a complex endeavor, as stated in the problem statement. Due to this complexity, teacher performance assessment is bound to include a certain subjectivity, which can be at the expense of the reliability of the assessment. Or the assessment ignores the complexity, increasing reliability but decreasing validity. In other words, an observation instrument can never fully comprehend the complexity of the educational context, but still needs to be specific and directive for high-stakes assessment in order to decrease subjectivity and increase reliability.
percentage of all lessons, therefore their lessons often have insufficient impact on pupil results. Moreover, student results can also be influenced by factors that are not related to their teacher, such as maturation or homeschooling. Secondly, knowledge tests can be used to assess a student’s content knowledge or pedagogical content knowledge. Thirdly, portfolios can be used such as the Performance Assessment for California Teachers (PACT) (Darling-Hammond, 2006, p.130). Fourthly,
pupil surveys on teacher quality can contribute to assess student’s teaching quality (Pavlina, Zorica,
Pongrac, 2011), however it is questionable whether high ratings from the students can be attributed to student’s teaching qualities (Leventhal, Perry and Abrami, 1977). Finally, observing authentic practice
of teaching is increasingly considered as a more valid measure than traditional assessment methods that are focused on knowledge (Darling-Hammond, 2006, p. 121). And since this assessment method is currently rather common, this study focusses on observation and its instruments.
1.2.2 Classroom Observation
Observation occurs by almost everyone on every moment of the day. Young children learn by observing and imitating adult behavior (Schmidt, Butler, Heinz, & Tomasello, 2016). Nevertheless, human observations are subjective and therefore can be misleading (Connor-Greene, 2007). The need for validation of observation presents itself. Therefore, there are different types of observational instruments, each with their own content and protocol. To illustrate, several current teacher
observation instruments are discussed, selected by convenience sampling (Vos, 2009). Afterwards, recommendations are being summarized with regard to observation instruments.
Types of Observational Instruments for Teachers
There are many different observational instruments for different contexts, with different content and purposes. Observation takes place in multiple sciences, such as biology, sociology, medicine, marketing, psychology and education (Girard & Cohn, 2016). For instance with regard to education, observations can serve to predict student outcomes, assess teacher quality, improve student learning or give feedback (Praetorius & Charalambous, 2018). However, observations regarding other sciences can have different purposes, such as estimating patience health, group dynamics and responses or consumer behavior.
These different context require different types of observational instruments. Girard and Cohn (2016) distinguish categorical and dimensional measurements. Instruments with categorical
measurement restrict the assessor to a limited amount of possible answers (e.g. slow, medium or
fast), whereas dimensional measurements restrict the assessor to numerical values, or ratings (e.g. a scale of 1-10). Observations can also be temporally categorized in event-based or interval-based observations (Girard & Cohn, 2016). For event-based observation, a predetermined event is observed for the duration of that whole event. Interval-based observations contain a predetermined duration in which multiple different events might occur. Finally, different types of instruments may require different
types of assessors, as there are pre-trained assessors, peers, experts or simply unrelated assessors
With regard to teacher assessment, the observation instruments are used to ‘measure observable behaviors of teaching practice that are demonstrated in the classroom, such as student engagement, use of questioning techniques, classroom management, and accuracy of presentation of content’ (Joe, Tocci, Holtzman & Williams, 2013). There are many different types of observation instruments. This can be as simple as an instrument to measure the frequency of certain behavior by
tallying its occurrence. Other instruments are more complex, like CLASS which contains different
dimensions that are divided in indicators and behavioral markers for different levels of teacher skills (Pianta, Hamre and Mintz, 2012). Class can be categorized as a rubric, which give a description of each possible score for each scoring item, of which an example can be seen in Appendix A. This type of observation instrument will be discussed later on. Moreover, alternations of these rubrics are being made, for instance a continua model is developed by Grainger and Weir (2016). This instrument also gives indicators for different standards for each scoring item. A pass standard is given as well as a credit standard, a distinction standard and a high distinction standard. The assessor first estimates which standard is reached, but since this is a continua model the assessor can then indicate how far the student is in their process of reaching the next standard. This gives a more nuanced score and more room for the assessor to implicate the complexity of the assessment practice.
Current Observational Instruments for Teachers
With regard to teacher assessment, several observational instruments that have already been developed are now discussed. To begin with the CLASS, the UTEACH Observation Protocol (UTOP) for Math and Science, the Mathematical Quality of Instruction (MQI) and the Protocol for Language Arts Teaching Observation (PLATO). Finally, the FFT is discussed, which not an observation instrument but a broadly used definition of good teaching in the United States.
First of all, CLASS is developed by Pianta, Hamre and Mintz (2012) and contains three domains (emotional support, classroom organization and instructional support). Each domain is subcategorized in respectively three, three and five dimensions. Student engagement is not part of the domains but it is observed as a detached section. An observation cycle takes 15 minutes in which all three domains are simultaneously observed, which is later transformed to a score. In general, at least 4 cycles are recommended during one year for one teacher; however, this can differ with regard to the purpose of the observation. Indicators, examples and elaborate descriptions are given for each possible score of each dimension.
scored on all five MQI-elements. The overall lesson is also scored on the five elements. To give a final score for a teacher, three lessons are assessed as described before, by two assessors. Finally, the
Protocol for Language Arts Teaching Observation (PLATO) is developed for English language arts and
consists of 13 elements, such as purpose, intellectual challenge, modeling and guided practice (K-12 Educational Team, 2010b). The observation process consists of cycles of each 15 minutes in which all 13 elements are scored. Not all 13 elements have to be present, but multiple different non-consecutive observations are needed to obtain a reliable and complete picture of the teacher’s instruction and lesson content.
The research based Framework for Teaching (FFT) by Danielson (2013) framework is built on four domains, namely planning and preparation, the classroom environment, instruction and
professional responsibilities. Each domain contains five or six components, which each contain two to five elements, leading to a total of 76 elements. For instance, one elements is “response to student misbehavior” as an element of “Managing student Behavior”, which is a component of the domain “The Classroom Environment”. Each element can be scored in four levels, namely “unsatisfactory”, “basic”, “proficient” and “distinguished”, and each level is illustrated by critical attributes and examples. Further guidelines on how to observe and score teachers are not implemented in the framework. Training is recommended in order to use the framework.
Recommendations regarding Teacher Observation
The different observation instruments provide several recommendations regarding observing teachers. According to the CLASS, reliability increases with the number of observations, since more
observations leads to a higher reliability of the measurement (Pianta et al., 2012). Therefore it is recommended to determine a minimum number of observations in order to guarantee reliable
assessment. The UTOP on the other hand, is designed only to observe one lesson. Scoring only takes place after each observation, with help of video takes or field notes (UTeach Natural Sciences, 2014).
Secondly, the assessors needs to remain objective, score new cycles independent from scores of previous cycles, giving single incidents not too much weight with regard to the general score, score a dimension independently from the scores of other dimensions and finally, high scores do not mean perfection (Pianta et al., 2012).
With regard to the FFT, consensus on teaching quality and especially consensus on its corresponding language are essential with regard to developing teaching quality (Danielson, 2013). This consensus can for instance be obtained by rater training or repeated use of the rubrics as discussed later on.
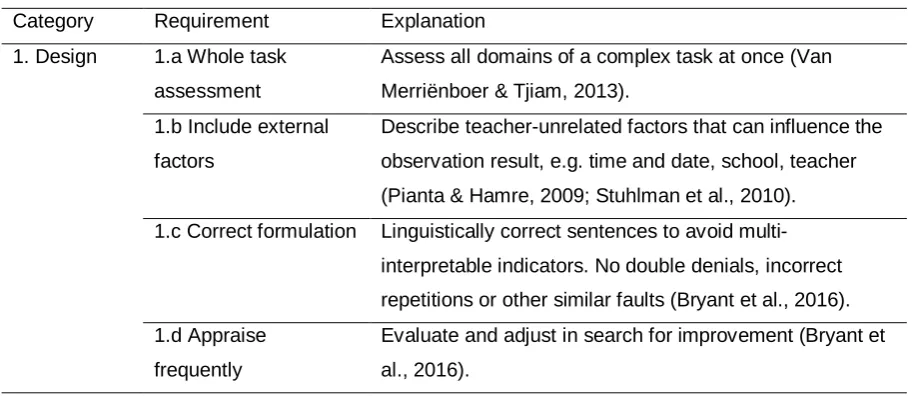
Moreover, the assessors needs to have enough time to assess all different items (Joe et al., 2013). And it needs to be clear what differentiates the scoring options in order to obtain interrater agreement (Womack, 2011). But also the external factors that can influence an observation’s outcome need to be described on the instrument, such as the school, class, time, date or teacher (Pianta & Hamre, 2009; Stuhlman et al., 2010). Finally, it is recommended that an assessment manual is developed in which protocols are described (Evers, Lucassen, Meijer, & Sijtsma, 2010), such as what sample of lessons to needs to be observed (Grossman, Cohen, & Brown, 2014), the observation period, when to score the instrument and how to act during observation. An overview of these recommendations is given in Table 1. Since this study focusses on rubrics as observational instrument, also recommendations will be given regarding rubric design and the use of rubrics. However, first definitions, advantages and disadvantages of rubrics as observational instruments are discussed.
1.2.3 Rubrics as Observational Instrument
A commonly used definition comes from Andrade (2000; Reddy & Andrade 2010), describing a rubric as “a document that articulates the expectations for an assignment by listing the criteria or what counts, and describing levels of quality from excellent to poor”. Jeong (2015, p. 1) adds to this definition that a rubric is also a representation of the teacher’s assessment construct, it clarifies teachers’ expectations.
The use of rubrics offers several advantages. Rubrics can increase reliability of assessments (Jonsson and Svingby, 2007), since rubrics give standards for each possible score. When those scoring criteria are formulated specifically and clearly, the rubric gives a more directive input to the assessor compared to more general assessment instruments with less specified scoring criteria. Moreover, Reynolds (2010) claims that teachers increasingly view rubrics as more accurate and
efficient assessment tools. Rubrics also provide feedback to the assessed persons (Bryant p. 81) and
facilitate transparent assessment (Bryant p. 81; Jonsson, 2014). The assessed persons are given insight to which specific level is reached on a certain criterion, and what progress is still needed to reach the next level. The use of rubric consequently can contribute to self-assessment (i.e. measuring personal learning progress), self-regulation (i.e. regulating personal learning process) and motivation
for learning (Bryant, p. 81).
On the other hand, disadvantages can also be named with regard to rubrics as observation instrument. Garcia-Ros (2011) observes teachers’ resistance to use rubrics for assessment and Bryant et al. (2016, p. 82) admit that the use of rubrics is not without flaws. First of all, ambiguous
goals or different views on teacher quality can still hinder the effectiveness of rubrics (Jeong, 2015,
p11; Bryant et al., 2016, p. 82). Secondly, students that are assessed with rubrics can be too
assessment-oriented, only focusing on how to get a high score on the rubric (Zeichner, 2010), which
can make students too submissive and therefore hinder self-regulation of their learning-process and professional development. Thirdly, it is hard to capture all of the criteria in a rubric (Jeong, 2015, p11). Finally, issues also arise with regard to validity and reliability, as several studies suggest that
Gordon, 2000). Studies regarding rubrics often focus on reliability and fail to address validity (Jeong, 2015). While reliability is a condition for validity (Vos, 2009), it cannot be stated that a reliable rubric is a valuable observation instrument, since a reliable rubric must still be validated before statements can be made regarding its value or quality.
The rubric design and its use are determinative for its effectiveness, its ability to provide useful information for its purpose (e.g. formative- or summative feedback, low- or high stakes assessment). First of all effective rubrics are formulated correctly (Bryant et al., 2016, p. 80; Jeong, 2015, p. 3). Sentences are linguistically correct and do not include double denials, incorrect repetitions or other similar faults. Precise and correct formulation is required to avoid multi-interpretable scoring indicators. Secondly, effective rubrics are appraised frequently (Bryant et al., 2016). In other words, the rubric is not used as a static instrument but it is evaluated and adjusted regularly in search of improvement, leading to a higher effectiveness. Thirdly, attributes must be consequently used across levels (Jeong, 2015). Within one criterion, each description of a scoring indicator must use the same concepts and formulations. To illustrate, when scoring a teacher’s use of voice, it is confusing if the first scoring level contains the concept ‘dynamic’, the second ‘energetic’ and the third speaks of ‘powerful’. Since these concepts subtly differ in meaning, it can unnecessarily complicates the scoring process.
Regarding the use of rubrics, repeated use is needed to gain consensus and develop a shared meaning (Darling-Hammond, 2006). Moreover, training for the assessors is required, that is training on how to assess students on their teaching quality. Multiple studies show that training assessors can increase the reliability of the assessor’s scores (Eppich et al., 2015; Feldman et al., 2012; Lovorn & Rezaei, 2011). Finally, rubrics must contain specific descriptions of the criterion, complemented with
examples, since this can increase reliability, according to Thaler, Kazemi and Huscher (2009).
Recommendations regarding rubrics as observational instrument
[image:13.595.70.528.574.772.2]An overview the recommendations from the discussed observation instruments and the recommendations regarding the rubric’s design and use is given in Table 1.
Table 1
Recommendations regarding rubrics as observational instrument
Category Requirement Explanation
1. Design 1.a Whole task assessment
Assess all domains of a complex task at once (Van Merriënboer & Tjiam, 2013).
1.b Include external factors
Describe teacher-unrelated factors that can influence the observation result, e.g. time and date, school, teacher (Pianta & Hamre, 2009; Stuhlman et al., 2010). 1.c Correct formulation Linguistically correct sentences to avoid
multi-interpretable indicators. No double denials, incorrect repetitions or other similar faults (Bryant et al., 2016). 1.d Appraise
frequently
1.e Use attributes consequently across levels
Use the same concepts and formulation within the indicators of one criterion (Jeong, 2015).
1.f Specific descriptions
Describe specific observable behavior: “the student gives a differentiated arithmetic lesson with use of materials that…” (Thaler, Kazemi & Huscher, 2009).
1.g Add examples For instance, with regard to the student-pupil relation: “the student says things like: ‘I do like your clothes’ or ‘Good to see you today’” (Thaler, Kazemi & Huscher, 2009). 1.h Differentiate in
scoring options
Make sure the distinction between the different scoring descriptions is clear (Womack, 2011).
2.
Observation protocol
2.a Develop an assessment manual
Protocols can be described in this manual, e.g. timing and duration of observations, the sample of lessons that need to be observed (Evers, Lucassen, Meijer, & Sijtsma, 2010) 2.b Determine a
minimal number of observations
More observations will increase the reliability of the final score, but also depends on the assessment goal (Pianta et al., 2012).
2.c Choose type of rater suitable for assessment objective
Pre-trained assessors, peers, experts or simply unrelated assessors (Girard & Cohn, 2016).
3. Use of the instrument
3.a Remain objective Score independent from previous observations (Pianta et al., 2012).
Give incidents not too much weight with regard to the general score (Pianta et al., 2012).
Score dimensions independent from other dimensions (Pianta et al., 2012).
High scores do not mean perfection (Pianta et al., 2012). 3.b Gain consensus on
teaching quality
Develop a similar concept of teaching quality in order to interpret the instrument similarly (Danielson, 2013) 4. Assessor 4.a Use repeatedly Repeated use in different situations to develop a shared
meaning (Darling-Hammond, 2006, p. 10). 4.b Training on how to
use the instrument
To discuss observation protocols, the instrument, or collectively assessing students’ lessons (Eppich et al., 2015; Feldman et al., 2012; Lovorn & Rezaei, 2011). 5. Feasibility 5.a Determine whether
interval- or event based observation is desirable
To observe the entire lesson, event based observation is desirable. However, in practice it might be more feasible to pre-determine observation-length (Girard & Cohn, 2016).
5.b Organize time to observe all items
1.2.4 Reliability and Validity
Test scores can yield a certain level of reliability and validity, which are investigated in this study. Therefore the definitions and different types of both reliability and validity are given. First of all, validity
is defined by the American Psychological Association (as cited in Vos, 2009, p. 76) as “’the appropriateness, meaningfulness, and usefulness of the specific inferences’ made from the
measures”. Kane (2006, p. 8) also emphasizes that usefulness by stating that ‘validity has to do with the proposed interpretations and uses of test scores’. According to him, validation of test scores has a direct link to the consequences that they have, where especially unintended negative consequences are most contentious. The need arises to examine a test validity before it is used. For instance, reliable but invalid measures cause an increase of data that the researcher attempted to measure but did not intended to measure, i.e. the measurements are reliable but the wrong content is being measured. Therefore the wrong consequences might be applied.
Validity can be specified into several components. First, there is the distinction between external- and internal validity, where the external validity refers to the extent results can be
generalized to other contexts. Internal validity indicates whether “the program, service, or whatever was studied, in fact, produced the observed outcome” (Hernon & Schwartz, 2009, p. 73). Furthermore, there are different types of test validity, of which three are discussed. Firstly, content validity, that is to what degree the items that are used for a construct represents the intended construct (Hernon & Schwartz, 2009). For instance, if an arithmetic test only includes items on vocabulary, the test has a low content validity. Secondly, to investigate the criterion validity multiple test on the same construct are compared to see if the intended construct is covered (Hernon & Schwartz, 2009). Thirdly, whether the items that are used cover all components of the construct refers to construct validity (Vos, 2009). To illustrate, an arithmetic test on operations should not only cover addition, but also subtraction, fractions, etcetera.
With regard to reliability, a definition is given by the American Psychological Association (as cited in Vos, 2009, p.76), namely “the degree to which observed scores are ‘free from errors of
measurement’”. Unreliable scores cause an increase of incorrect data (e.g. random results) so that the measurement results deviate from what the researcher attempted to measure. Because of this
incorrect data, unreliable measurements are consequently invalid.
Reliability can also be measured in different ways. First of all by the internal consistency, i.e.
the correlation between items on the same construct (Hernon & Schwartz, 2009) or within-test consistency (Vos, 2009). Secondly, by measuring the test-retest reliability, for instance by measuring the correlation between the results of multiple similar test (Vos, 2009). Thirdly, by the parallel test
reliability, where the results of similar but different items are compared (Vos, 2009). Finally, by
As described in the problem statement, this study focusses on construct validity and the IRR. Since multiple students of this study’s educational program indicate that the different scoring items and its constructs are interpreted differently among assessors, the construct validity is further examined in order to clarify constructs used in the rubric. This indication of different interpretation is also a motive for an investigation of the IRR, along with the fact that multiple students state that rubrics are used differently among assessors. For instance, some use halve points where others do not. But also that some assessors use the rubric strict and analytic where others use it more holistic, more as a guideline that can also be ignored, leading to a divergent score. Therefore, a lack of inter-rater agreement is expected. It is investigated whether an increase in construct validity also leads to an increase in IRR. To increase the construct validity, clarifications and examples of constructs are added, along with general guidelines in order to clarify how the rubrics are intended to be used. To argue whether this leads to an increased validity, the theoretical validity framework of Kane (2006) is used.
1.2.5 Theoretical Validity Framework
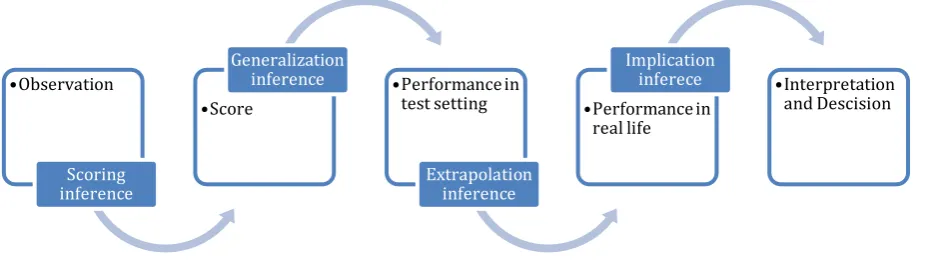
Kane (as cited by Cook et al., 2015) developed a theoretical framework for validating an observation instrument’s scores, as can be seen in Figure 1. This framework helps to validate the decisions that are made based on observations. An interpretative argument is constructed to justify the conclusions and decisions that are made based on the observed performances. This interpretive argument consists of four inferences. Firstly, the observation instrument transfers the sample of observations into a score. This scoring inference is for instance dependent on the scoring procedure and its standardization, e.g. training assessors on the use of the observation instrument and its protocols. Secondly, the generalizability inference is to which extent the observed lessons can be generalized to the target domain, which can for instance be all lessons given by the teacher in that year. The observed scores can only be partly generalized to the overall target domain and the teacher’s performance. This can for instance depend on number of samples or the characteristics of the samples. Thirdly, the extrapolation inference concerns the question whether the sample of
[image:16.595.72.536.614.745.2]observations represent the real-world performance. To what degree do the observation results predict the performance in real-life? Finally, the implication inference discusses what consequences suit the observations and whether these consequences are useful for the stakeholders, such as the assessor, the learner, or the society.
Figure 1. Overview of Kane’s Validity Argument (Cook et al. 2015)
•Observation
Scoring inference
•Score
Generalization
inference •Performance in
test setting
Extrapolation inference
•Performance in real life
Implication
inferece •Interpretation
The approach of the interpretive argument depends on the stage that the test is in (Kane, 2006). When the test is in the development stage, the interpretive argument can be outlined before the test is developed. Possible sources of variance can be pre-determined and pilots can be done in order to be more consistent with the interpretive argument. Even the assumptions and inferences that underline the pre-determined interpretive argument can be adjusted when necessary. When the test is
in appraisal stage, questionable assumptions are investigated, but also assumptions that can be
checked easily in order to increase the confidence in the argument’s claims. Also, hidden assumptions are searched in order to make them explicit since only then those assumptions can be evaluated. “An interpretive argument that has survived all reasonable challenges to its coherence and plausibility can be provisionally accepted, with the understanding that new evidence may undermine its credibility in the future.” (Kane, 2006, p 26) Finally the interpretive argument can also be reviewed in hind-sight, during the evaluationstage. Insights that result from this evaluation can be used for the development of new test, when a different interpretative argument needs to be established.
The thoroughness of the evaluation of the interpretive argument depends on the different stakes that can be in play. For high-stakes assessment more extensive evidence is required with regard to the scoring inference than for low-stakes assessment (Kane, 2006). When an assessment instrument is simply used to give feedback on a student’s learning curve, it is more likely that the teacher’s implications based on the scores are harmless (Kane, 2006). When ambitious statements are being made based on the assessment (e.g. when a student fails this assessment, he or she is not fit to become a teacher), a robust and complete scoring argument is called for.
Scoring Inference
This study focusses on the scoring inference, the process of transferring observations into scores, based on a scoring rule as warrant for the scoring inference (Kane, 2006). No earlier research with regard to validity and reliability has been done with regard to the rubric used that are currently used at the institution of this study. Therefore this research started with the scoring inference as the first step for the validity argument. This scoring inference “relies mainly on expert judgement about the
appropriateness of the scoring rule and the thoroughness of quality control procedures.” (Kane, 2006,
p. 25) The inference is must be made plausible by providing evidence and arguments, and then it stands until is proven otherwise.
As described before, ‘the warrant for the scoring inference is the scoring rule’ (Kane, 2006, p.28). The scoring rule consists of the required guidelines in order to assign a score to the observed behavior. The backing of this warrant can consist of the outcomes of earlier studies, judgement of experts or empirical evidence. The warrant can for instance be the substantiationof the scoring rules,
to assure that the scoring rule is administered as it is specifically intended to. This requires a clear distinction between scoring levels and clear rules on how to compute the final score. Another part of the warrant can be to make sure that the scoring rule is applied accurately and consistently.
can be calculated as backing for this warrant (Kane, 2006). Accuracy and consistency can be warranted by using a reliability threshold to set conditions for assessors before they can use the instrument. Finally, it is also important to addresspossible bias in order to prevent systematic error that unintentionally influences the scores regardless of assessor or of the assessed student. For example, this may occur when an assessor only assesses one student for a longer period.
1.3 Research Question and Model
Based on the problem statement and the theoretical framework, it can be concluded that there is a need for reliable and valid assessment of students in educational programs. This study attempts to investigate how to improve the construct validity of rubrics as observation instrument. Secondly, it is studied whether this improvement in construct validity can lead to rubric scores with an increased IRR.
How can the construct validity of a rubric be improved, and to what degree can this
improvement increase the inter-rater reliability of the rubric’s scores?
2. RESEARCH DESIGN AND METHODS
2.1 Research Design
In this mixed method research, the construct validity of several constructs from an observational instrument was qualitatively investigated and improved (Phase 1). The instrument of this study was a rubric that was already in use in the educational program to assess lessons of pre-service teachers, see Appendix A. The increase of the construct validity was done by specifying and clarifying
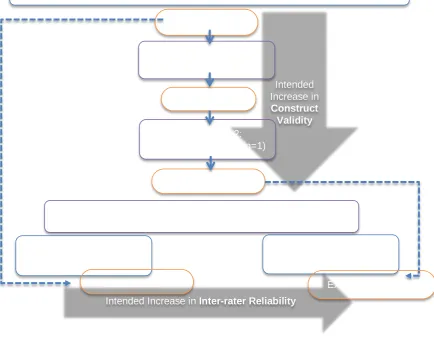
[image:19.595.73.508.407.747.2]constructs based on the input of two focus groups, which was processed into a newly designed experimental instrument. To determine whether the construct validity has increased, the assumptions and evaluation criteria of the argument based approach of Kane (2006) are used, which are also described in the theoretical framework. In the quantitative part (Phase 2), the IRR of the original observation instrument was investigated and compared to the IRR of the experimental instrument. A posttest-only control group true experimental design was used as described by Vos (2009), where both groups assessed the same two students’ lessons. However, the control group used the original rubric and the experimental group used the experimental rubric. The aim of this study was firstly to quantify the IRR of the rubric that is currently used, and secondly to uncover whether a rubric with a higher construct validity leads to a higher IRR. A model of this study’s research design is presented in Figure 2.
Intended Increase in Inter-rater Reliability Intended Increase in Construct
Validity Focus Group 1:
CHE-Teachers (n=6) Original Rubric
Adjusted Rubric
Focus Group 2: ICO’s (n=4) mentors (n=1)
Experiment: ICO’s assess 2 lessons of pre-service students (n=70) Experimental Rubric
Reliability of Classroom Observation Instruments to Assess Pre-Service Teachers
Control Group (n=37) Experimental Group (n=33)
Original Rubric Experimental Rubric
The institution for this research is a higher vocational education-institution providing several educations, e.g. communication, theology, journalism and education for primary school teacher. The institution is searching for ways to increase the validity and reliability of observational assessment of students. Currently rubrics are used to assess students in authentic practice. These rubrics are designed by teacher educators, and based on predefined outcomes, which are again based on the learning outcomes formulated by the Dutch government for teacher education for primary schools. In each quartile of each year a different rubric is used, with different scoring items. Each rubric has around 8 scoring items and for each criterion a 5 point scale from 0 to 4 is used that specifies for each score what is expected of the students to obtain that score (see Appendix A). Each scoring item again contains several constructs that are used to describe the criteria for each score. For instance for the scoring item “Prevalence” a construct can be “Act Suitable”, measuring whether a student acts suitable with regard to unwanted behavior of the pupils. The scores of each item are summed up and
converted into grades. For instance, when each scoring item is scored a 4, this results in a 10, the highest grade in the Dutch educational system. For these rubrics, the students need to receive a 6 or higher for the grade to be sufficient. The rubric of this study contains 4 scoring items, and at least 11 points need to be acquired in order to obtain a 6 as grade. This score can be obtained by any
combination of the scoring items, for instance by scoring 4 points twice, 3 points once, and 0 points on the last scoring item.
The students are assessed three times, by at least two different assessors, both employed by the primary school of the student’s internship. The first assessor supervises all the students of that primary school, the so called ICO. The second assessor is the teacher of the class where the student has his or her internship, the so called mentor. The average of those three grades must be sufficient or else the student must retake the course in the next quartile. Nevertheless, second time failure is almost always used to bar or delay a student. Hence, the rubrics for this research are used for summative, high-stakes assessment, but also formative, to give feedback to students on their performance. Since every scoring item is described in the rubric, the student can afterwards analyze the rubric to see which items are insufficient and what needs to be improved to gain higher scores. On top of that, the scores from the rubric can afterwards be further explained or elucidated by the ICO, however this is not obligatory or stimulated by the educational program. The student can always consult the mentor, who is also familiar with the rubric.
2.2 Participants
2.2.1 Participants of Phase 1
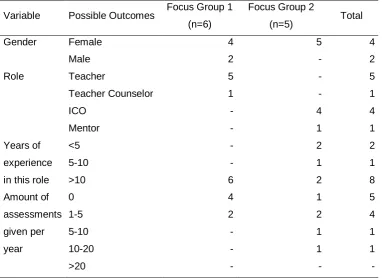
For the second focus-group in phase 1, all ICOs and mentors were approached that are in contact with this study’s institution, and who work in Voorthuizen, Nijkerk, Nijkerkerveen, Barneveld and Kootwijkerbroek. These cities were selected for practical reasons, since this second focus-group took place in Voorthuizen. 7 ICO’s and 1 mentors are willing to participate. However, 2 ICOs cancelled one day before the meeting and 1 ICO forgot the meeting, resulting in a group of 4 ICO’s and 1 mentor. All 5 participants were female. Furthermore, two participants had less than 5 years of experience, one indicates 5-10 years and 2 indicate more than 10 years of experience. Finally, 1 participant did not assess students at the moment, 2 participants assessed 0 to 5 times per year, 1 participant assessed 5 to 10 times per year and 1 participant assessed 10 to 20 times a year. Table 2 gives an overview of these descriptive statistics for both the first and second focus-group.
2.2.2 Participants of Phase 2
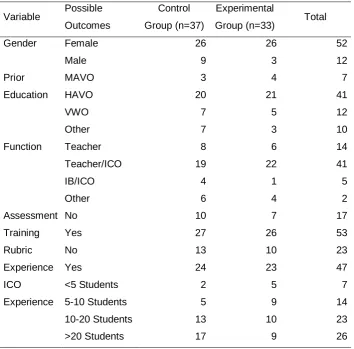
[image:21.595.71.454.476.754.2]The participants of the experiment in phase 2 were all ICOs that were present on an ICO-training on June 4, 2018. For this training, 181 ICOs were invited of which 77 were present. Assessors were randomly divided in both conditions by receiving a red or blue colored strip on entering the room, which was handed out alternately. Because of missing values, the results of 7 participants were inadmissible, therefore ignored in this study. This resulted in 37 participants in the control group and 33 participants in the experimental group. The sample consisted of 12 men (17%) and 52 women (74%). 6 participants did not fill in their gender (9%). Regarding to prior education, most participants had completed HAVO (N=41, 59%) and most participants were primary school teachers (N=41, 59%).
Table 2
Descriptive Statistics of the participants of the Focus Groups
Variable Possible Outcomes Focus Group 1 (n=6)
Focus Group 2
(n=5) Total
Gender Female 4 5 4
Male 2 - 2
Role Teacher 5 - 5
Teacher Counselor 1 - 1
ICO - 4 4
Mentor - 1 1
Years of experience in this role
<5 - 2 2
5-10 - 1 1
>10 6 2 8
Amount of assessments given per year
0 4 1 5
1-5 2 2 4
5-10 - 1 1
10-20 - 1 1
Most participants have had any form of assessment training on rubric use (N=53, 76%) and most of them have had experience with this particular rubric (N=47, 67%). Finally with regard to their
experience as an ICO, most participants indicated that they have trained more than 10 students. Table 3 gives an overview of these descriptive statistics for both the control- and experimental group.
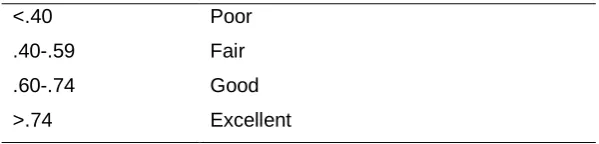
Based on independent samples T-Tests with a significance level of α=.05, there was no significant difference between the experimental- and the control group on the variables Gender (p=.109), Assessment Training (p=.578) and Rubric Experience (p=.673). Based on the Freeman-Halton extension of the Fisher exact probability test, there was also no significant difference between both groups on Prior Education (p=0.614), Function (p=.522) and ICO Experience (p=.167). It was concluded that both groups did not differ significantly on the measured characteristics as a result of randomly assigning participants to the control- or experimental group.
2.3 Instrumentation
[image:22.595.71.426.121.470.2]For this study, a rubric was selected with the lowest grade average (7.3262) to avoid the ceiling effect (Vos, 2009). Moreover, multiple teacher educators already claimed that ICOs were having trouble interpreting this specific rubric. Since there was no evident difference in variance of assessors’ scores
Table 3
Descriptive Statistics of the participants of the Experiment
Variable Possible Outcomes
Control Group (n=37)
Experimental
Group (n=33) Total
Gender Female 26 26 52
Male 9 3 12
Prior Education
MAVO 3 4 7
HAVO 20 21 41
VWO 7 5 12
Other 7 3 10
Function Teacher 8 6 14
Teacher/ICO 19 22 41
IB/ICO 4 1 5
Other 6 4 2
Assessment Training
No 10 7 17
Yes 27 26 53
Rubric Experience
No 13 10 23
Yes 24 23 47
ICO Experience
<5 Students 2 5 7
5-10 Students 5 9 14
10-20 Students 13 10 23
between rubrics, this had no influence in the selection process of the rubric. This rubric focusses on students’ relation with the pupils, the way students stimulate the pupils feeling competent, how the students stimulate autonomy and finally the prevalence of the students in the classroom. Each of these four constructs has a 0-4 scale, therefore resulting in a total score between 0 and 16 points. These points are converted into grades, where 11 points is a 6, which is the minimal grade for the assessment to be sufficient.
2.3.1 Instrumentation of Phase 1
In phase two an experimental rubric is develop in an attempt to increase its construct validity. Two focus groups are organized, where the participants are asked to identify unclear constructs from the descriptions of the scoring items. The participants are also asked how these unclear descriptions can be clarified or specified, possibly by adding examples, as was recommended in the theoretical
framework and Table 1. These clarifications can serve as backing for the warrant of the scoring rule of this study’s rubric (Kane, 2006). For the first focus group in phase 1, the original rubric was used (see Appendix A). The participants were asked to sign a consent form (see Appendix B), and to fill in a short questionnaire on gender, function, role with regard to the CHE, role experience, student assessment experience (see Appendix C). This information was later on used to describe the participants. For both focus-groups a script was used, based on the script of Eliot and Associates (2005), as described in Appendix D. In this script, the participants were stimulated to share their honest, possibly deviant opinion, change opinion, and give new input. The participants were asked to clarify and/or exemplify constructs by writing comments on forms as can be seen in Appendix E. To illustrate, a constructs that is discussed is “Undesired Behavior”. Post-its were used to enable each participant to individually react on the comments of the other participants.
For the second focus group in phase 1, the adjusted rubric was used based on the outcomes of the first focus group (see Appendix H). Nine pre-determined questions were used based on five categories that describe the progressiveness of focus-group questioning (Krueger, 1994). The script that is being used (see Appendix D) can be complemented with the interview scheme resulting from these nine questions (see Appendix F). The first category is “Opening questions”, such as “What are your experiences on assessing students?” Secondly, “Introductory questions”, in this case “For which courses did you use rubrics to assess students?” Thirdly, “Transitional questions” as there is “What are the advantages of rubrics for assessing students in authentic practice?” These first three questions mainly used to introduce the subject at hand, and to activate the participants’ prior knowledge.
Fourthly the “Main questions”, such as “What parts or concepts are still unclear to you?” These questions are used to uncover which parts of the rubric are unclear and which parts cause
disagreement. Hereafter the participants are asked how these parts of the rubric can be reformulated in order to increase the construct validity. And finally “Ending questions”, in this case “Is there
2.3.2 Instrumentation of Phase 2
For the experiment, all participants received the same instruction to avoid intersession contamination (Vos, 2009). Therefore a script was read to minimalize the influence of experimenter expectancy (Vos, 2009) (see Appendix H). In this script, the faithful subject method of Vos (2009) was applied and it was stressed that data is processed anonymously to avoid evaluation apprehension (Vos, 2009). The participants were asked to sign a consent form (see Appendix B), and to fill in a short questionnaire on gender, prior education, function, assessment training, rubric experience and ICO experience (see Appendix N).
For the control group of the experiment in phase 2, the original rubric was used as described in the introduction (see Appendix J, K). For the experimental group in phase 2, an experimental rubric was developed based on the input from the focus-groups (see Appendix L, M). It was intended that this adjusted experimental rubric has a higher construct validity and a higher IRR, as discussed in the results section. The development of this rubric is further described in the procedure.
2.4 Procedure
2.4.1 Procedure of Phase 1
For the first 20 minutes of the first focus-groups in phase 1, the teachers were paired. Each group receives two forms with each one element of a rubric’s indicator (for instance, “makes contact with the
children”). Each pair was asked to clarify and specify the selected indicator, as also explained on the
forms in Appendix E. With six participants, three pairs were made, therefore the two remaining indicators were discussed by the two pairs that were done early. In the second 20 minutes, the participants were asked to review each other’s forms individually by making comments on post-it’s to indicate whether they agree or disagree and also explain their line of reasoning.
For the second focus group, the ICOs were questioned on the revised rubric from the previous focus group (see Appendix H), based on the pre-determined questions as can be seen in Appendix F). An assistant was instructed to record the meeting, take notes when speech was unclear and to refrain from the conversation. Both the researcher and assistant welcomed the participants.
2.4.2 Procedure of Phase 2
For the experiment in phase 2, the participants have alternately received a red or blue colored stripe on entering the room, indicating if they can take place in the left or right side of the room. The control group took place on the left side and the experimental group on the right side, with some rows of vacant tables in between.
group with the experimental rubric. Finally, the questionnaire was filled in for descriptive information (see Appendix N).
2.5 Data Analysis
2.5.1 Data Analysis of Phase 1
The data of the first focus group of phase 1 (see Appendix G) was used as input in an attempt to develop a clearer and specific rubric, thereby increasing the construct validity as discussed in the theoretical framework. The input from the forms was compared with the input from the post-its. If the new formulation was (nearly) undisputed, it was added to, or integrated in the rubric. If the new formulation was disputed in the post-its, the researcher considers if the new formulation was again adapted based on the input from the post-its. Finally, these changes were added to, or integrated in the rubric. This resulted in a revised, and expectedly clearer rubric.
The data of the second focus group of phase 1 was analyzed as recommended by Eliot and Associates (2005). The recordings were transcribed and analyzed by open- and axial coding in ATLAS.ti. Before the data was coded, additional notes from the assistant were added to the transcription and insignificant words were removed. Every sentence was labeled with a number corresponding to the participant. The coded date was analyzed to determine if further adjustments on the experimental rubric could be made in order to increase the construct validity. Examples of codes were “Undesirable behavior” that contains all fragments were the participants discussed how
undesirable behavior of pupils can be clarified, or “Unforeseen circumstances” where the participants signaled that it was unclear how to assess students if no unforeseen circumstances occur.
2.5.2 Data Analysis of Phase 2
The data from the experiment of phase 2 first consisted of filled in assessment forms, which were transferred into SPSS. The data was checked for missing values or outliers (Bryant et al., 2016). Based on these results, the IRR is calculated as backing for the warrant of the scoring rule as discussed in the theoretical framework (Kane, 2006). Bresciani et al. (2009) state that the Intraclass Correlation Coefficient (ICC) can be used to calculate the IRR when multiple assessors score on an ordered scale. Hallgren (2012) adds that the ICC can also be computed when assessing with an interval or ratio scale. Therefore, to compare the IRR of both the control- and experimental group, the ICC was calculated for both groups.
𝐾𝐾𝑓𝑓𝑓𝑓𝑓𝑓𝑓𝑓𝑓𝑓𝑓𝑓=𝑃𝑃� − 𝑃𝑃�𝑒𝑒1− 𝑃𝑃�𝑒𝑒
𝑃𝑃� is calculated by:
𝑃𝑃�=𝑟𝑟 −11�𝑛𝑛𝑟𝑟1 � 𝑟𝑟𝑓𝑓𝑖𝑖2 𝑓𝑓,𝑖𝑖
−1�
In this formula n is the number of subjects, r the number of assessors per subject and 𝑟𝑟𝑖𝑖𝑖𝑖 is the number of raters for the 𝑖𝑖th subject and the 𝑖𝑖th category.
𝑃𝑃�𝑒𝑒 is calculated by:
𝑃𝑃�𝑒𝑒=� 𝑝𝑝𝑖𝑖2 𝑞𝑞
𝑖𝑖=1
In this formula q is the number of categories and 𝑝𝑝𝑖𝑖 is calculated by:
𝑝𝑝𝑖𝑖=𝑁𝑁𝑛𝑛1 �𝑛𝑛𝑖𝑖𝑖𝑖 𝑁𝑁
𝑁𝑁𝑛𝑛
3. RESULTS
3.1 Focus Group 1 – CHE-Teachers
The first focus group in phase 1 is focussed on clarifying or exemplifying certain constructs of the rubric in order to increase its construct validity. Eight constructs are selected, such as “acts
appropriate” or “unwanted behaviour”. The data from this focus group is processed into the first draft of an experimental rubric (see Appendix H).
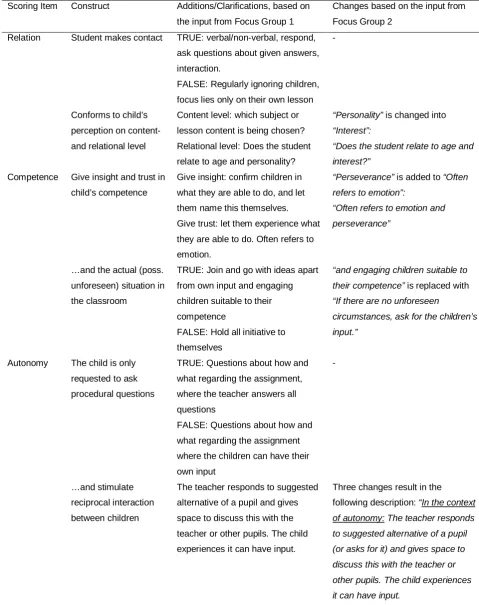
On the basis of the comments on the eight chosen construct and the reactions on those comments (see Appendix G), clarifications or examples are formulated and added to the original rubric. No changes are made in the formulation of the scoring criteria of the rubric itself, only
clarifications or examples are added. For instance, most participants agreed that unwanted behaviour was behaviour that was inconvenient with regard to the situation in the classroom. Moreover, each participant’s reaction included an addition, such as “unwanted behaviour is behaviour that can be hurtful to others”. Since all reactions included different reactions, the researcher choose a clarification of “Unwanted Behaviour” that covered most of the reactions, namely “Behaviour that does not suit the actual situation in the classroom. Behaviour that disrupts the class. Behaviour that is not agreed upon. EXAMPLE: talking when silence is required.” The clarifications or examples were added to the original rubric, as can be seen in Table 4, resulting in the first draft of the experimental rubric (Appendix H).
3.2 Focus Group 2 – ICOs and Mentors
The second focus group in phase 1 is focussed on receiving feedback on the first draft of the experimental rubric by ICOs or Mentors, that is the assessors of this rubric. The data from this focus group is used to adjust the experimental rubric to increase its construct validity further.
On the basis of the transcription and its coding (see Appendix O, the experimental rubric is adjusted. For each code, all corresponding quotations are reviewed. For instance, for the code “Unforeseen Circumstances” and its corresponding quotations (see Appendix O, nr. 197, 198, 199, 200) it is decided that a clarification is needed on what to do when there are no unforeseen circumstances. Therefore, the phrase “If there are no unforeseen circumstances, ask for the input of the children” is added. This is done for every code with its corresponding quotations.
Table 4
Results of the First- and Second Focus Group Regarding the Development of the Experimental Rubric
Scoring Item Construct Additions/Clarifications, based on
the input from Focus Group 1
Changes based on the input from
Focus Group 2
Relation Student makes contact TRUE: verbal/non-verbal, respond,
ask questions about given answers,
interaction.
FALSE: Regularly ignoring children,
focus lies only on their own lesson -
Conforms to child’s
perception on content-
and relational level
Content level: which subject or
lesson content is being chosen?
Relational level: Does the student
relate to age and personality?
“Personality” is changed into
“Interest”:
“Does the student relate to age and
interest?”
Competence Give insight and trust in
child’s competence
Give insight: confirm children in
what they are able to do, and let
them name this themselves.
Give trust: let them experience what
they are able to do. Often refers to
emotion.
“Perseverance” is added to “Often
refers to emotion”:
“Often refers to emotion and
perseverance”
…and the actual (poss.
unforeseen) situation in
the classroom
TRUE: Join and go with ideas apart
from own input and engaging
children suitable to their
competence
FALSE: Hold all initiative to
themselves
“and engaging children suitable to
their competence” is replaced with
“If there are no unforeseen
circumstances, ask for the children’s
input.”
Autonomy The child is only
requested to ask
procedural questions
TRUE: Questions about how and
what regarding the assignment,
where the teacher answers all
questions
FALSE: Questions about how and
what regarding the assignment
where the children can have their
own input
-
…and stimulate
reciprocal interaction
between children
The teacher responds to suggested
alternative of a pupil and gives
space to discuss this with the
teacher or other pupils. The child
experiences it can have input.
Three changes result in the
following description: “In the context
of autonomy: The teacher responds
to suggested alternative of a pupil
(or asks for it) and gives space to
discuss this with the teacher or
other pupils. The child experiences
it can have input.
NOT: Allowing the children to
3.3 Argument based approach to the Validity of the Original- and Experimental Rubrics
This argument based approach to validation takes place during the appraisal stage (Kane, 2006). For this study, the test was already developed without explicitly formulating the interpretive argument of Kane (2006). The rubrics are both used for low- and high stakes applications. The rubrics are intended to give formative feedback, but are also used to bar students when multiple lessons are graded insufficiently. Therefore extensive appraisal of the interpretive argument is necessary (Kane, 2006). Based on the validity framework of Kane (2006) the backings for the warrant of the scoring rule are now discussed for both the original- and the experimental rubric, as discussed in the theoretical framework.
3.3.1 Warrant of the Scoring Rule of the Original Rubric
First of all it is discussed how the scoring rules are substantiated for the original rubric. The distinction of scales of each scoring item are indicated clearly. Differences between scales are emphasized by making the fonts bold. However, as a result of both focus groups it can be concluded that not all constructs used in the scoring items are clear to all of the participants. Sometimes participants have different concepts of constructs, or have trouble translating the construct to observable behavior in the classroom. In short, the distinctions may be clearly visible but it is questionable whether these
distinctions are all understandable to the assessors. It is therefore also questionable whether all scoring items are appropriate for classroom interactions, since assessors have trouble translating constructs to observable classroom behavior. For the assessors it is clear how to compute the observed score for one lesson, and how to compute the final score from scores of multiple lessons since the latter is simply the average.
Secondly, the original rubric lacks measures to score accurate and consistent. Currently there is no reliability threshold for the ICOs with regard to this rubrics. Some ICOs are experienced while others just started assessing students. In all likelihood, this endangers the consistency among assessors. There is some obligatory training to assess students, although this consists of only a few moments per year. For instance during this training it is discussed how to use the observation instrument and how to interpret its content. It is questionable whether this is enough to achieve accuracy and consistency for the different rubrics, since every quartile another rubric is being used.
Prevalence Unwanted behaviour Behaviour that does not suit the
actual situation in the classroom.
Behaviour that disrupts the class.
Behavior that is not agreed upon.
EXAMPLE: talking when silence is
required.
-
Acts suitable If necessary, first ask for a
clarification. Then clearly naming
the problem of the behaviour. Not
regarding the person, but the
behaviour.