Supervisors: J. Karreman, R. S. Jacobs Jitske Botma, S1452576
Master thesis. 24 October 2018
Faculty of Behavioural, Management and Social Sciences
1
Abstract
The possibilities of appropriation of modern technologies are endless. Users are able to adapt technology in such a way that it fits in their personal routine and supports their own goals. During this process, users can adapt technologies in an ineffective or inefficient way, by neglecting certain features of the device or application, also labelled feature underuse. This study aims to investigate feature underuse of Microsoft Office Word (2013) amongst the digital generation. To reach this goal, 30 members of the target group were observed during application use to evaluate the causes of feature underuse. Participants were presented with several tasks to perform with the application. Subsequently, they were interviewed at several moments during the session to gain deeper understanding of their behaviour and reasons for feature underuse.
The results of this study show that feature underuse is a common behaviour amongst the digital generation, with a variety of causes. It is argued that, through continuous evaluation of the feature’s ability to support personal needs and preferenes, users appropriate application features similar to technologies as a whole. Feature use is therefore strongly dependent on the needs of the user. This study suggests that competency and knowledge are most crucial in predicting feature use. This helps users with making assumptions regarding feature workings. Similarly, recognition of features allows the use of existing mental models with interpretation of the application and enhances feature use. Lastly, the perceived usefulness of a feature’s ability to support behaviour can largely determine actual use of the feature. Based on the determinants of feature underuse, design optimisations have been formulated to better support actual user behaviour.
2
Table of Contents
1.
Introduction... 3
2.
Theoretical framework ... 5
2.1 Theories of technology use ... 5
2.2 Feature underuse ... 9
2.3 Determinants of technology appropriation ... 10
3.
Research objectives ... 16
3.1 Research questions ... 16
4.
Methods ... 18
4.1 Microsoft Office Word (2013) ... 18
4.2 Research design ... 18
4.3 Procedure ... 18
4.4 Materials ... 19
4.5 Participants ... 20
4.6 Measurements ... 21
5.
Results ... 23
5.1 General results ... 23
5.2 Appropriation of the application ... 25
5.3 Paradox of the active user ... 26
5.4 Feature underuse ... 27
5.5 Determinants of non-use ... 28
6.
Discussion ... 35
6.1 Theoretical implications ... 35
6.2 Practical implications ... 37
6.3 Limitations and future research ... 39
7.
Conclusion ... 40
References ... 41
Appendices ... 46
Appendix A: Pre-test script ... 46
Appendix B: Transcript pre-test ... 48
Appendix C: Results pre-test ... 60
Appendix D: Main research script ... 62
Appendix E: Codebook ... 65
3
1.
Introduction
In today’s information society, technology has taken in a prominent place in everyday life. It has become nearly impossible to separate technology from daily life. Technology allows users to meet their needs through a wide variety of use possibilities. These needs are specific for the independent user and their personal preferences and goals. Therefore, technology use can no longer be explained through mere acceptance and adoption. Rather, it should be understood through the process of appropriation in which users make sense of and adapt technology to fit their personal needs and goals. This model focuses on users’ efforts to make sense of technology. Better understanding of appropriation is central to understanding modern information technology (Salovaara, Helfenstein & Oulasvirta, 2011).
Through the process of appropriation users decide which technologies, but also which features are relevant for their specific goals. Users have the possibility to neglect certain features from use. Limited use of features has been labelled feature underuse. Reasons for limited feature use should be studied in more depth to gain a more complete understanding of the entire appropriation process. Understanding feature underuse can help to gain insights into actual use behaviour, and identify needs and preferences of the users. Ultimately, this should contribute to development of applications that support users more completely in reaching their goals.
This study focuses on feature underuse of Microsoft Office Word (2013) by students. The aim is to gain insight in why certain features of the application are underused by this particular group. Previous research has concluded that neither good design of the software nor the user experience with the application can ensure effective and efficient use (e.g. Bhavnani & John, 1997). Therefore, reasons for feature underuse must be explored in more depth. The following research questions has been formulated to reach this goal: What causes feature underuse amongst the digital generation with the widely known application Microsoft Office Word (2013)? More specifically, this study attempts to relate determinants of feature underuse to identify feature characteristics.
This study focuses on underuse amongst students. This group can be classified as “digital natives” who are constantly engaged with digital media and technology (Park, 2014) and have developed a reliance on technology across all contexts of their lives (Corrin, Lockyer & Bennett, 2010). Technology use has become inherent to their lives as this group has explored technology starting at a young age. This implies that students seem to perceive a low barrier towards technology use and are generally more experienced in technology use (Corrin et al., 2010). However, the fact that students easily adapt new technologies does not necessarily guarantee effective and efficient use. As Park (2014) states, there is a gap between those who use digital technologies effectively and those who do not. Similar to other user groups, digital natives also rely on cognitive processes to make sense of technology, such as appropriation, the active user paradox and mental models. However, these processes do not guarantee correct sense-making of technologies and can hinder efficient use (Corrin et al., 2010).
4 than limited feature use. To fully understand the use and appropriation of technology, determinants of feature underuse should be included. A more thorough understanding of why certain features are underused and what causes this contributes to a complete picture of the technology appropriation process.
5
2.
Theoretical framework
This chapter discusses the theoretical insights related to technology non-use and feature underuse in specific. It discusses various cognitive processes through which users come to adopt and adapt technology and provides an overview of the determinants of technology non-use.
2.1 Theories of technology use
Determinants that explain the causes of feature underuse can be derived from theories that explain technology use. It is clear that the adoption of technologies nowadays is understood as more than merely to accomplish goals, as they also shape the activities and needs of their users (Salovaara et al., 2011). It should be understood as a process in which users actively adapt or repurpose technologies to fit their personal needs. Such adaption of technology for personal needs and goals is typically seen as a result of the acceptance of technology into user’s lives (Dix, 2007; Pang et al., 2015): Technology is not adapted to personal routines if it is not fully accepted.
2.1.1 Technology acceptance models
Technology Acceptance Models (TAMs) describe the process in which people come to accept or not accept technologies. These models are extensions of the Theory of Planned Behaviour developed by Ajzen (1991) and aim to predict and explain the attitudes, beliefs and intentions of potential adopters when adopting IT systems (Korpelainen & Kira, 2011). TAM studies usually focus on the influencing factors on the use of technology and the adoption or rejection of these devices (Dogruel, Joeckel & Bowman, 2015).
One of the most influential technology acceptance models was developed by Davis (1989), which aims to predict user adoption of new technology. The model recognises two determinants of acceptance: Perceived ease of use and perceived usefulness. Perceived ease of use can be referred to as “the degree to which a person believes that using a particular system would be free of effort”, whereas perceived usefulness refers to “the degree to which a person believes that using a particular system would enhance his or her job performance” (Davis, 1989, p. 320). These two constructs determine the behavioural intention to use the technology (Pan & Jordan-Marsh, 2010). According to this model, they are fundamental to technology acceptance and thus predict the likelihood of technology use.
6 These determinants provide a simple explanation for technology acceptance, but cannot fully explain technology adaption to personal needs. Technology Acceptance Models have more limitations when it comes to the diversity of users and what technologies represent for individual users, where the effects of technology on personal lives is left out of scope. These models typically predict intentions of users to explore new technologies rather than actual and continued use over time (e.g. Davis, 1989; Truman & Gallivan, 2008). TAMs are therefore neither able to successfully explain why certain devices are adopted into daily life while others are not, nor how technologies are used over time.
2.1.2 Appropriation of technology
To explain technology use more completely, users should not be viewed as passive recipients of technology. Rather, users adapt technology in order to fit the user’s purposes and goals, resulting in various unique usage behaviours (Waycott, 2005). Therefore, technology use should be understood as a consequence of the process of appropriation. Appropriation is more suitable for such explanations than TAMs, as it recognises users as active agents who are able to adapt technologies to serve personal goals (Salovaara & Tamminen, 2009) and emphasises users’ actual practice with technology (Herodotou, Winters & Kambouri, 2012). Appropriation is the process of adoption and adaption of technologies into daily routines (e. g. Bar, Weber & Pisani, 2015; Dourish, 2003; Salovaara & Tamminen, 2009). Carroll and colleagues (2001, p. 3) define the process of appropriation as: “The way in which technology is explored, evaluated and adopted or rejected by users”.
Appropriation is focused on the use of technology in a meaningful context (Pang et al., 2015). This context can provide users with the freedom to voluntarily choose to use an application or device, but can also require users to make use of it. Mandatory use can for example be for work – or education related activities that instruct the use of specific technologies. In either case, it is an individual process in which the user decides to either follow the designers’ suggestions or chooses to follow personal use preferences (Herodotou et al., 2012). Usage behaviour is determined by the desire to work effectively and efficiently to meet the user’s job demands (Lindgaard & Narasimhan, 2008). It is therefore relevant to understand how technologies are used and how they fit into a user’s routine (Waycott, Jones & Scanlon, 2005).
Appropriation can be understood through two streams: the process and the nature of appropriation (Herodotou et al., 2012). The process is concerned with adopting, adapting and integrating technology in everyday life, including the factors supporting the process. The nature of appropriation focuses on the actual uses of the technology. Thus, the process is concerned with the way of appropriating technology, while the nature of appropriation can be understood as the result.
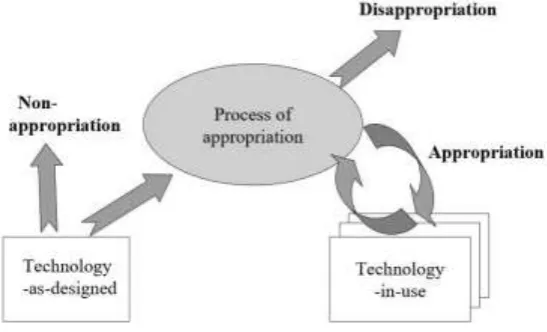
7 Understanding this process provides insight into actual technology use. Figure 1 portrays the Technology Appropriation Model as developed by Carroll and colleagues (2001). In this model, Carroll et al. (2001) distinguish two artefact types: Technology-as-designed and technology-in-use. The former is technology as provided by the designer, whereas the latter refers to embedding technology into the lives of users. These two artefact types are significantly different. It is not guaranteed that all features included in the technology-as-designed are actually used in a day to day context.
Figure 1 Technology Appropriation Model (Carroll et al., 2001)
Users appropriate technology by assigning a certain meaning to that technology in their context of use (Selwyn, 2003). Making sense of technology is therefore a crucial element of the appropriation process. Individuals are continuously placing technology into their lives according to a range of personal and institutional factors (Selwyn, 2003) to fit personal routines within everyday activities and practices (Selwyn, 2011). Waycott, Jones and Scanlon (2005) also note the importance of ‘technology fit’ into a user’s life and established ways of working: higher fit enhances technology use.
Appropriation is not merely using the technology as developers intended, but also the creative uses of people for the technology to fit their personal needs. When users engage in activities with technology, they progress from simple activities to creative activity as usage expands (Livingstone & Helsper, 2007). For instance, digital cameras are also used as mirror (Salovaara et al., 2011), or PowerPoint as reporting format (Farkas, 2009). Salovaara and colleagues (2011) also found that users who have appropriated actively and use the technology in a variety of contexts and purposes, understand the technology more accurately. Consequently, they are more likely to recognize use possibilities in unknown situations. Similarly, Fróes and Tosca (2018) report on creative, playful tablet use by children in a different way than was intended, where the rules of the game were ignored to reach own personal goals. Therefore, as long as technology fits the personal needs of its user, it will keep adding value to his or her life and use will be continued (Carroll et al., 2002).
8 technologies in the setting (Jones & Issroff, 2007). Technology is thus not neutral or merely used as object, but shaped by the interests, values and assumptions of the user (Orlikowski & Iacono, 2001). The evaluation of a technology should, according to this view, focus on how well the tool is able to support the user’s activities (Waycott, 2005).
2.1.3 Paradox of the active user
During the process of appropriation, technological artefacts are given a meaningful place in the users’ routines through the attachment of emotional value to the device. This emotional value acts as motivation to immediately use the artefact, without taking the time to learn special features properly. Skipping the learning period can result in inefficient use. Fu and Gray (2004) have summarized this process in the paradox of the active user: “The persistent use of inefficient procedures by experienced or even expert users when demonstrably more efficient procedures exist” (p. 928). The active user relies on prior knowledge and familiar methods to accomplish goals, even if these methods are inefficient, rather than learning a new system from scratch (Carroll & Rosson, 1987). Two types of cognitive bias are identified with regards to the active user paradox: the production bias and the assimilation bias (Carroll & Rosson, 1987; Fu & Gray, 2004).
The production bias refers to the observation that users are often not discovering and using functions that could have been more efficient (Carroll & Rosson, 1987; Fu & Gray, 2004). According to this bias, users are motivated to use an application to accomplish their goals. Instead of investing time to learn an application properly, users simply start using new applications for personal purposes (Carroll & Rosson, 1987). Users rather learn a system by trial-and-error than by learning all functionalities before actually using the system (Carroll & Rosson, 1987). This process, however, can lead to users learning and adopting inefficient routines. Many users decide between whether it is worth spending time learning the system which facilitates greater throughput in the future, or generate throughput directly by using possibly inefficient methods. Available instructions are often only used when the user is confused about what to do (Eiriksdottir & Catrambone, 2011), as result of a skipped learning period.
The assimilation bias is related to the influence of prior knowledge on learning a new system. The bias states that, in order to use new technology, users tend to tap into prior knowledge of similar technologies to reach their goals (Carroll & Rosson, 1987; Eiriksdottir & Catrambone, 2011; Fu & Gary, 2011). This can mislead and blind users to the available functionalities (Carroll & Rosson, 1987), as users make inferences about the application based on what they have already learned about similar applications. Since these conclusions are based on prior knowledge, they do not have to be correct for the new system, hindering users from recognizing possibilities of the new system.
By following this logic, Fu and Gray (2004) argue that expert users tend to lack deep structural knowledge of systems. This structural knowledge of a system is called a mental model and helps users interpret the internal workings of a device. According to Kieras and Bovair (1984, p. 255), a mental model is “some kind of understanding of how the device works in terms of its internal structure and processes”. This understanding of internal workings allows the user to make sense of the artefact in use by linking own behaviours with the device to the reactions of the system. A mental model thus can help enhance such meaning as it makes specific inferences about what the operating procedures must be (Kieras & Bovair, 1984).
9 mental model can negatively influence feature awareness and prevent users from correctly using the device. Prior knowledge about similar technology is then used to fill in possible uncertainties in such a way that the system then makes sense to him or her.
The active user paradox has two major implications regarding the formation of a mental model of a new device. To begin with, usage behaviours are often driven by this superficial system knowledge and tends to be limited to surface characteristics of the display (Fu & Gray, 2004). Carter, Clements, Tatcher and George (2011) also report that as individuals reach a certain level of expertise, well-learned routines may hinder paying attention to alternative uses of technology. Therefore, when prior knowledge of (similar) technologies is used, motivation to invest time in learning a new device is lower as the user is under the impression that they are aware of the possibilities. Exploring new technologies in order to reach personal goals is limited due to this previous knowledge, as it is used to interpret the new device, which does not necessarily match the internal workings of that new device. Second, by skipping the learning period of the new device users are more prone to make wrong inferences with regards to system reactions, as it is more likely that users develop an incorrect mental model.
2.2 Feature underuse
Appropriating technologies does not per definition imply that limited use of the device’s features is prohibited. During the adaption process, it is possible that only a selection of the devices’ functionalities are included into everyday use. Park (2014) observed this behaviour among infrequent internet users, who focused only on a small number of applications and did not explore all possibilities of use. This mismatch between features provided and features used has been labelled underuse (Lindgaard & Narasimhan, 2008). Van Loggem (2007, p. 23) defines underuse as follows: “Underuse is when only part of the software’s functionality is applied to the task at hand, and this is not the result of a conscious decision”. According to Selwyn (2006), sense making of and acting upon the meaning of technology in everyday life seems to be at the core of not making (optimal) use of technology.
As this definition suggests, feature underuse has an unconscious cause. Users perform a task using the familiar features, unaware of possible other opportunities of use. Underuse can be related to the non-appropriation of technology. Non-appropriation is defined as “Choosing not to discover the capabilities of the technology or failing to explore and evaluate the technology” (Carroll et al., 2002, p. 1778). This thus occurs when technology or separate features of a device are not seriously considered for exploration and integration into everyday life. Technology design could play a role in this process. For example, design can prevent users from finding features because they might be hidden or due to lack of understanding of the design’s way of working.
10 Conscious underuse can be linked to disappropriation of technology, which is the result of a change in device evaluation which negative results in usage (Carroll et al., 2002). This can happen at any stage of the appropriation process. For example, when users change their evaluation of the technology-in-use they decide to stop using it. This could be because certain features might be hard to use and the user does not want to invest time to learn them properly or a feature does not support personal goals as expected. This implies that underuse is in some cases actually desirable for users (Baumer, Burrell, Ames, Brubaker & Dourish, 2015).
Technology is thus repurposed to needs and goals of users that results in limited feature use. This is a choice with many dimensions and motivations (Kahma & Matschoss, 2017). Non-use is therefore not per definition negative technology use, but rather a result of the fit between the devices’ features and the users’ routines (Selwyn, 2003; Selwyn, 2006). Users create an overall personal evaluation of a device, which determines whether and how users choose to adapt it (Stein, Newell, Wagner & Galliers, 2012). Users constantly (re)consider these evaluations to determine their technology use (Kahma & Matschoss, 2017).
The way users learn to use new devices is influenced by the cognitive processes described in the previous sections. An accurate mental model could reduce feature underuse, as it improves learning and retaining the operating procedures of a device (Kieras & Bovair, 1984). Limited technology appropriation can be a result of inadequate understanding of the technology working (Salovaara et al., 2011). Knowledge the user has about the internal workings of a technological device can influence the way it is used.
The reason for purchasing or using systems or products is usually the potential for improved performance (Eiriksdottir & Catrambone, 2011). This motivates users to use technology to reach personal objectives. Performance improvement can, however, be sacrificed when the product is not used properly. Ineffective and inefficient use are therefore closely related to feature underuse, because neglected features could help the user to carry out the task more effectively.
Mendoza, Miller, Pedell and Sterling (2013) found that underuse or non-use is related to negative emotions that the user experiences, such as low perceived ease of use or not user-friendly interfaces. Problems in using the system can result in confusion and uncertainty among the users (Mendoza et al., 2013). They conclude that “when users do not see benefits from using a system, they question their decisions and tend to resent or stress about using it. This resentment and stress can cause limited use or even rejection of the system” (p. 8). In a similar manner, Leng & Wee (2017) note that the use of technology is dependent on the perceived benefits of the technology. This can be extended to feature use as well. When users do not perceive a feature to add value or contribute to task performance, it is more likely that the feature will not be used.
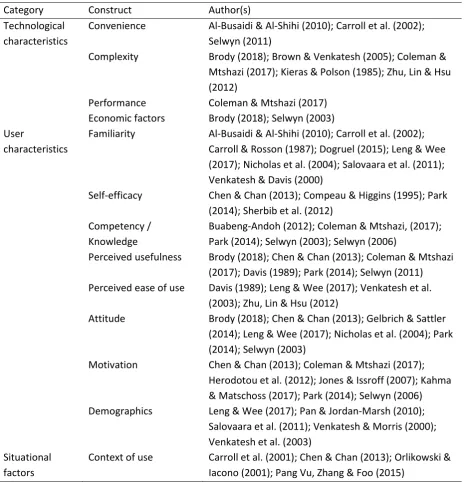
2.3 Determinants of technology appropriation
11 Table 1 Determinants of usage behaviour
Category Construct Author(s)
Technological characteristics
Convenience Al-Busaidi & Al-Shihi (2010); Carroll et al. (2002); Selwyn (2011)
Complexity Brody (2018); Brown & Venkatesh (2005); Coleman & Mtshazi (2017); Kieras & Polson (1985); Zhu, Lin & Hsu (2012)
Performance Coleman & Mtshazi (2017) Economic factors Brody (2018); Selwyn (2003) User
characteristics
Familiarity Al-Busaidi & Al-Shihi (2010); Carroll et al. (2002); Carroll & Rosson (1987); Dogruel (2015); Leng & Wee (2017); Nicholas et al. (2004); Salovaara et al. (2011); Venkatesh & Davis (2000)
Self-efficacy Chen & Chan (2013); Compeau & Higgins (1995); Park (2014); Sherbib et al. (2012)
Competency / Knowledge
Buabeng-Andoh (2012); Coleman & Mtshazi, (2017); Park (2014); Selwyn (2003); Selwyn (2006)
Perceived usefulness Brody (2018); Chen & Chan (2013); Coleman & Mtshazi (2017); Davis (1989); Park (2014); Selwyn (2011) Perceived ease of use Davis (1989); Leng & Wee (2017); Venkatesh et al.
(2003); Zhu, Lin & Hsu (2012)
Attitude Brody (2018); Chen & Chan (2013); Gelbrich & Sattler (2014); Leng & Wee (2017); Nicholas et al. (2004); Park (2014); Selwyn (2003)
Motivation Chen & Chan (2013); Coleman & Mtshazi (2017); Herodotou et al. (2012); Jones & Issroff (2007); Kahma & Matschoss (2017); Park (2014); Selwyn (2006) Demographics Leng & Wee (2017); Pan & Jordan-Marsh (2010);
Salovaara et al. (2011); Venkatesh & Morris (2000); Venkatesh et al. (2003)
Situational factors
Context of use Carroll et al. (2001); Chen & Chan (2013); Orlikowski & Iacono (2001); Pang Vu, Zhang & Foo (2015)
2.3.1 Technological characteristics
The first category of determinants are the technological characteristics. Research has identified several technology-specific aspects as predictors of use. These determinants are related to the working of technology that affect usage behaviour: Convenience (Carroll et al., 2002; Selwyn, 2011), complexity (Brody, 2018; Lindgaard & Narasimhan, 2008; Coleman & Mtshazi, 2017), performance (Coleman & Mtshazi, 2017), and economic factors (Brody, 2018; Selwyn, 2003).
Convenience
12 routines. Al-Busaidi and Al-Shihi (2010) suggest accessibility as element that enhances convenience for its users. For example, mobile technology is very convenient to use, as users are able to use such technologies everywhere. These devices support users in their daily routines, which strengthens the desire to use them.
Complexity
The complexity of a device or feature can significantly influence the way it is used. Learning to use complex devices or features is time consuming, which acts as barrier for users to fully incorporate it into usage behaviours (Brown & Venkatesh, 2005; Coleman & Mtshazi, 2017). Similarly, easy to use devices with high usability prevent users from having to spend much time learning it. The device (or parts of it) are then more likely to be used (Brody, 2018).
According to Kieras and Polson (1985), the complexity of a device is dependent on the amount, content and structure of the knowledge needed to operate a device successfully. Zhu, Lin and Hsu (2012) suggest that the complexity of a system is dependent on its system quality and information quality. Therefore, applications and features that require a lot of mental effort to learn and use are less likely to be adapted. Brown and Venkatesh (2005) also suggest that more complex technologies have lower adoption rates.
Performance
The adoption and adaption of technology is according to Colemand and Mtshazi (2017) dependent on whether its use is reliable. Frequently occurring technical problems or errors during use result in barriers towards using the technology. This can also be projected on specific features. A device that works properly in general use, yet results in problems or technical errors during operation of more complex or less frequently used features is more likely to be abandoned for future use.
Economic factors
Authors have also identified economic factors as key elements that influence adoption and adaption of technology (Brody, 2018; Selwyn, 2003). For example, people can decide not to adapt a device into their daily lives because the costs are too high compared to the perceived added value to their lives.
2.3.2 User characteristics
The second category of determinants are the user characteristics. These characteristics are internal factors that influence behaviour of users. Previous research has identified eight internal constructs that influence technology use, summarized below.
Familiarity
13 On the other hand, the assimilation bias states that users can also apply knowledge of other applications to interpret new situations which can blind users to what they are actually seeing and doing (Carroll & Rosson, 1987). Prior knowledge can thus prevent users from correctly or completely interpret new situations and hinder efficient use.
Self-efficacy
One of the barriers in technology use is self-efficacy (Chen & Chan, 2013). It is an important construct in the acceptance of information systems (Al-Busaidi & Al-Shihi, 2010). Self-efficacy can be defined as “The belief that one has the capability to perform a particular behaviour” (Compeau & Higgins, 1995, p. 189). This concept is therefore concerned with people’s judgement of their own capabilities to perform an action to reach their goal. Disbelief of one’s capability can lead to lack of confidence in own behaviour. This can be extended to technology use and thus prevent users from integrating technology into their lives as a result (Park, 2014; Sherbib Asiri, Mahmud, Abu Bakar & Ayub, 2012). On the other hand, higher self-efficacy can increase confidence that the user is able to reach a goal successfully and may enhance trial-and-error strategies to explore new possibilities of a technology.
Competency and knowledge
Contrary to self-efficacy, competency is an individual’s actual ability to use technology, rather than one’s self-evaluation of skill. Buabeng-Andoh (2012) defines computer competency as: “The extent to which an individual is able to use a computer to perform a variety of applications to accomplish different tasks”. These factors include actual skills and knowledge to use technology, as well as experience with technology (Selwyn, 2003). Technology competency and knowledge influence usage behaviour. Having competency or knowledge about a device or feature helps users understand how to operate it correctly. On the other hand, lack of knowledge can act as barrier towards technology use (Coleman & Mtshazi, 2017; Park, 2014; Selwyn, 2006). Park (2014) suggests that infrequent or occasional users might not have the proper skills to use a device or feature, but also that such infrequent use prevents them from the opportunity to develop new skills as well.
Perceived usefulness
Studies based on technology acceptance/appropriation models have found perceived usefulness as determinant of technology use (Davis, 1989; Chen & Chan, 2013; Coleman & Mtshazi, 2017). Perceived usefulness refers to “The degree to which a person believes that using a particular system would enhance his or her job performance” (Davis, 1989, p. 320). Research into human-computer interaction has consistently shown that perceived usefulness is of significant importance in a users’ decision to use a technology (Selwyn, Marriott & Marriott, 2000). Lack of (potential) added value in the perspective of users of a technology, device or feature increases the likelihood they abstain from using it (Brody, 2018). Little perceived benefits of the technology can cause limited use. Similarly, Park (2014) states that the most cited reason for non-use was that the technology was not useful. Selwyn (2011) found that both engagement and non-engagement was justified by utility and usefulness.
Perceived ease of use
14 is perceived as easy to use (Leng & Wee, 2017). In their study about online gaming, Zhu and colleagues (2012) conclude that when users who perceive a product is easy to use, preference to continue using the game is higher. This can also be expanded to general technology use, where devices and applications perceived as easy to use are preferred over those that are perceived as complex.
Attitude
From the early studies about technology acceptance onward, attitude towards the technology was identified as determinant of (intention for) use. Even though attitude is a broad concept, in this study it is understood as an emotional response towards a technology technology (Eagly & Chaiken, 1993). The attitude towards a technology or feature can influence the motivation and/or willingness to use it (Chen & Chan, 2013; Nicholas et al. (2004); Selwyn, 2003). A more negative attitude is more likely to cause non-use or underuse than a positive attitude. For example, fear of using technology negatively influences their actual usage behaviour (Selwyn, 2003). Such technology anxiety causes an emotional reaction to mentally reject using it (Gelbrich & Sattler, 2014), but can be reduced by high self-efficacy (Leng & Wee, 2017). Brody (2018) suggests that an individual’s attitude towards a technology mediates the relationship between personality traits and use.
Motivation
The motivational aspect is the first step towards technology use and appropriation (Herodotou et al., 2012; Park, 2014). Users must be willing to invest time into learning a system or feature properly. Motivation has been defined as: “The drive to perform a behaviour to achieve specific goals” (Deci & Ryan, 1987). Chen and Chan (2013) found that users were motivated to use technology when it reduced effort required to reach a goal and enhanced effectiveness in performing daily activities. Jones and Issroff (2007) suggest that control over own goals motivates users to adapt technology. Such control allows users freedom to define the tasks and activities they wish to engage in, resulting in more willingness to learn the device.
Motivation is also closely related to interest in technology, which is a driver for use (Coleman & Mtshazi, 2017), while disinterest is understood as a form of non-use (Kahma & Matschoss, 2017). Interest in technology is closely related to attitude towards technology (see previous paragraph). Park (2014) reports on a study which found that one of the most common reasons for non-use was no interest. When users have no interest or fail to see the need to use a technological device, motivation to adapt it will be lower (Selwyn, 2006). Lack of interest can result in little desire to explore all devices’ features or possibilities of use.
Demographics
15
2.3.3 Situational factors
16
3.
Research objectives
The research described focuses on closing the literature gap between non-use of technologies as a whole and underuse of a part of (more complex) technologies. This chapter describes the research objectives in more detail.
To date there is still little understanding about feature underuse, as opposed to non-use of entire devices. As explained in the previous sections, feature underuse can be related to the process of appropriation since it is a result of human-computer interaction processes. Usage behaviour is approached in terms of adaption into daily life, or non-adaption in which entire devices are not used. This model can be expanded by including feature underuse, in which only a selection of the device’s features is included in the usage behaviour as a result of meaningful adaption. The objectives of this study are threefold:
Identify possible reasons for feature underuse; By identifying the factors that influence feature underuse, the appropriation process can be expanded to depict a more complete view. Possible factors that influence usage behaviour are determined and used as foundation to determine reasons for feature underuse. The aim is to find possible relationships between determinants of feature underuse and determinants of other forms of non-use.
Assess the actual level of feature underuse; By assessing whether feature underuse is rare or common practice among the target group, possible relationships between reasons for feature underuse and application specific feature characteristics can be identified. Understanding actual usage behaviours and preferences of the target group can result in insights into problematic aspects of the application architecture.
Gain insight into optimal design solutions; By identifying factors that influence application use, the design of that and similar applications can be optimized. For example, if certain features are underused because they are hard to find (users are unable to navigate to the feature) or too complex (requires a lot of mental effort), this should be improved in the design. Understanding feature underuse can result in practical design optimisations.
3.1 Research questions
Since there is still little knowledge regarding the causes of feature underuse, identifying these should be a priority. Therefore, to achieve the described study objectives, the following research question is formulated:
RQ: What causes feature underuse amongst the digital generation with the widely known application Microsoft Office Word (2013)?
Two sub questions have been formulated to specify the answer to the main research question. Sub question 1 is related to actual feature use of the application (Microsoft Office Word, 2013). This should lead to a thorough understanding of the features that are mostly underused amongst the digital generation. Results can contribute to design improvements for Microsoft Office Word (2013) specifically, as well as general recommendations to optimise design.
17 Understanding which features are most underused offers little insights into its causes. Identification of a possible relationship between feature underuse determinants and feature characteristics is therefore relevant. Sub question 2 attempts to identify such relationships, through assessment of feature characteristics in combination with non-use determinants. This question thus aims to identify possible differences between, for instance, the determinants of feature underuse for a feature that is hard to find and determinants of a feature that is complex to use.
18
4.
Methods
This chapter explains the methods used to answer the formulated research questions. It explains the main study as well as the method used to develop relevant study materials. It also describes the participants and measurements used for analysis of the study.
4.1 Microsoft Office Word (2013)
Feature underuse of Microsoft Office Word (2013) was studied in this research. This application is widely used among students of all backgrounds for a variety of reasons. It is a rather complex application which includes a large variety of features to support users in reaching their goals. Even though the target group makes regular use of the application, limited feature use is a possibility. Causes of feature underuse might vary greatly, from unawareness of a feature’s existence to complexity of use. This research should provide insights into the reasons for their non-use.
4.2 Research design
This research is exploratory in nature since there is currently little knowledge about the topic feature underuse. To explore the topic in more depth, an observation technique was used to test the widely used application Microsoft Office Word (2013) in combination with interviews. This allows for behaviour evaluation of participants while working with the application and assessment of features (not) used.
4.3 Procedure
The study was conducted in a laboratory setting. It was divided in three parts: Pre-test interview, observation in combination with post-task questions, and a post-test interview. The purpose of the study was explained to participants at the beginning of each session. Participants were then briefed on the general study set-up and were told the entire study would be recorded (audio, video and screen recordings) for data analysis with their consent. They were then asked to read and sign the consent form after which the recordings were turned on. The individual sessions lasted 48:10 minutes on average. The observation part of the study lasted the longest, on average 39:28 minutes. The pre-test and post-test interviews lasted on average 2:19 and 6:53 minutes respectively. All sessions were completed on a Windows computer.
4.3.1 Pre-test interview
19
4.3.2 Observation
After the pre-test interview the participants were introduced to the second part of the study (observation of task performance) in a short briefing. The following aspects were stressed in the briefing:
Please imagine you are in the situation described in the scenario Please perform the tasks as you normally would
Think aloud so I can understand what you are doing / what you are looking for This is an evaluation of the application, not you
Participants were then provided with a set of 6 scenarios, each ending with a task that the participant was asked to perform (see chapter 4.4), using a test document developed specifically for this study that consisted of both textual and visual elements. By providing a scenario, the participant is offered insight into why the task is meaningful and should motivate them to complete the task. Participants were also offered an example document in which all scenarios have been completed, to support them with possible uncertainty regarding a task.
While participants performed the tasks, their behaviour was observed. This observation focused on the way participants navigated through the application, the ease with which tasks were performed, and encountered problems to reach the goal. The researcher asked short questions (e.g. “What is the problem” or “What are you looking for”) during observation to gain extra insights into these behaviours and keep the participants thinking out loud.
When participants indicated that they had finished the task, post-task questions were asked regarding the evaluation of that specific feature. This interview also allowed examination of whether the participant fully understood the feature and its possible collaboration with other features. The features chosen for the test were relatively large features that can be altered to personalise a document as desired.Therefore, the main feature was included as a task, which led to a discussion of the more complex workings behind the feature in the post-task interview.
4.3.3 Post-test interview
Subsequently to the observations, the participants were interviewed about the application as a whole. These interviews were intended to gain a deeper understanding of the particular behaviour the participant showed and the causes of these problems. They provided a summary of issues regarding the features discussed and the causes for underuse, as well as an evaluation of the application as a whole.
4.4 Materials
4.4.1 Scenarios
20 years (SD=2.8). All participants were currently enrolled at different educational institutions, however they were all higher educated (applied university or university). Participants were mixed with regards to their study program and progress. These characteristics roughly matched the sample of the main study. The interview questions and results can be found in appendix A and C respectively.
Based on these interviews, 6 scenarios have been formulated. Each scenario provided the participant with background information in which the context of the scenario was described. Each scenario ended with a task to be performed. An example of such a scenario is:
Background
You still need to check your references and put them in the correct format (APA). You want to spend as little time as possible on the references, because you are running out of time.
Task
Create a reference list. Make sure it is standard APA format.
During the first few sessions it was observed that most participants were familiar with the features described in the scenarios. To effectively measure feature underuse, several features related to the described scenario were included in the later sessions than initially intended. The added features were more obscure and were mainly meant to customise document elements described in the scenario to personal preferences. As a result, not every feature was discussed by all 30 participants, as they were gradually included in the discussions.
4.4.2 Interviews
The study was built up of three types of interviews: Pre-test interview, task interview, and post-test interview. The interviews consisted of mostly open-ended questions to explore participants’ motivations for usage behaviour. The interviews were structured in the sense that the questions asked were predefined by the researcher. The order in which the questions were asked varied per participant, depending on the course of discussion and the observed behaviours. Additionally, questions or topics were added when more explanation was necessary. All study materials can be found in appendix D.
4.5 Participants
30 Members of target group participated in this study. Of these 30 participants, 16 were male and 14 were female. The average age of the participants was 22 years (SD=2.4). Participants of this study were students attending either university or applied university. Most participants were enrolled in different study programsand were in different stages of their study. Most participants were further progressed in their study, either master students (12 of 30) or third year bachelor (7 of 30).
21
4.6 Measurements
4.6.1 Data collection
To collect complete data, the participants were asked to think aloud. This allowed the researcher to gain better understanding of the thought processes of the participant. Additionally, screen recordings were made to study the participant’s behaviour with the application as well. Possible problems, ineffective, and inefficient use could then be analysed in more detail.
Lookback was used to record the individual sessions. This application allows recording of screen movement, video and audio, which have been recorded to collect data as complete as possible. For example, a confused expression on the participants’ face indicates something difficult or confusing happening on the screen. Similarly, expressions like “oh” or “huh” indicate difficulties with using or understanding the application.
4.6.2 Data analysis
This study aimed to find a relationship between feature underuse determinants and specific feature characteristics. These feature characteristics have been identified based on the interviews that could be related to a variety of non-use determinants. These characteristics are: Complexity of a feature, location of a feature and the terminology of a feature. The first involves determinants of features that are (perceived as) complex to use, the second aims to identify determinants for hidden features, and the last focuses on determinants of features that have problematic terminology.
The collected data (notes and recordings) were transcribed and bundled. A code book was developed to analyse the data for similarities and common outcomes. To ensure reliable data analysis, the codebook has been validated by a second coder. Three rounds of coding were conducted to develop a codebook that was acceptably reliable to use for further analysis. Each round of coding concluded with a discussion of the codes, based on the disagreement found for each code. Discussed points were then included in the codebook, and used for the next coding session. After the third session, several changes were made to the codebook and communicated with the second coder for approval. These changes included merging and specification of a set of codes that were difficult to distinguish in the collected data. The final codebook can be found in appendix E.
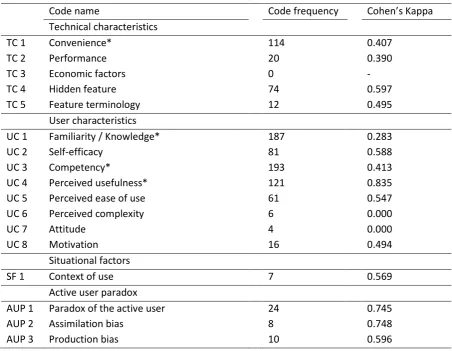
22 Table 2 Code frequencies and Cohen's Kappa
Code name Code frequency Cohen’s Kappa
Technical characteristics
TC 1 Convenience* 114 0.407
TC 2 Performance 20 0.390
TC 3 Economic factors 0 -
TC 4 Hidden feature 74 0.597
TC 5 Feature terminology 12 0.495
User characteristics
UC 1 Familiarity / Knowledge* 187 0.283
UC 2 Self-efficacy 81 0.588
UC 3 Competency* 193 0.413
UC 4 Perceived usefulness* 121 0.835
UC 5 Perceived ease of use 61 0.547
UC 6 Perceived complexity 6 0.000
UC 7 Attitude 4 0.000
UC 8 Motivation 16 0.494
Situational factors
SF 1 Context of use 7 0.569
Active user paradox
AUP 1 Paradox of the active user 24 0.745
AUP 2 Assimilation bias 8 0.748
AUP 3 Production bias 10 0.596
* Codes altered after calculation of Cohen’s Kappa
As depicted in table 2Error! Reference source not found., several frequently assigned codes did not match the expected reliability standard (0.6). For this reason, changes were made to the codebook after calculation of interrater agreement. A total of four codes were changed to increase reliability: convenience (TC 1), perceived usefulness (UC 4), familiarity/knowledge (UC 1), and competency (UC3).
To begin with, convenience was often used in combination with perceived usefulness. In addition, one coder often assigned this code while the other assigned perceived usefulness to the same text element. This implies that these codes were difficult to distinguish in actual data. As a consequence, these two codes were merged, to the extent that convenience included general comments regarding the application supporting the behaviour of users, such as comments related to elements that would improve features discussed. Perceived usefulness was assigned to all other comments regarding the usefulness of a feature or the application as a whole.
23
5.
Results
This chapter describes the results of the study, categorised by the cognitive processes and determinants of non-use described in the theoretical framework. First, the general evaluation of the application and scenarios are described. Then, more detailed analysis is done to make sense of the causes of feature underuse amongst the digital generation.
5.1 General results
The application allows users to reach their goals without too much trouble. These goals mainly include developing reports, essays and other study-related documents, the application is rarely used to reach personal goals. All participants indicated regular use of the application (at least once a week). In general, the application was rated as positive and useful, as is illustrated by the following comment: [1] “It is very easy to use. You can make a document look neat very quickly, without too much work” (Participant 25)1.
In general, the application includes all the features necessary to support users in reaching their goals. Many participants suggested that there are no features missing from the application, which indicates that it is an all-round application. However, participants noted that, even though the application includes many features, it could improve in user experience. Participant 19 describes this as follows:
[2] “It offers a lot, but it is not always user friendly. That’s it. I sometimes feel that you are looking for something longer than should be necessary.”
The application was often perceived as more complex than necessary, due to an overload of features that are often not used. Many participants feel that the application includes a lot of features that they are not aware of and, therefore, do not use. This is emphasised by the following comment: [3] “As far as I’m concerned, there are far too many functions included, perhaps. There is a lot included that I do not use” (Participant 22).
5.1.1 Feature awareness and feature use
In general, it was observed that using a specific feature in the application requires users to scan several frequently used tabs to locate that feature. This suggests that most users are not directly aware of a feature’s location, yet have knowledge of its existence which causes them to search for the feature in familiar places. It was often observed that participants start at the “Home” and “Insert” tab to locate a feature, and continue to click around the application if it cannot be found there. It was also frequently mentioned that the following tabs are rarely ever used: mailings, view, design and page lay-out. Overall, many participants had trouble using automatic chapter numbering and issues were also described with regards to equation creation and image managing.
The frequency that determinants of non-use were mentioned by participants was analysed as first impression of the data. According to these frequencies, competency and knowledge (frequency: 1026) and perceived usefulness (frequency: 696) are most relevant in explaining feature use. Participants generally were knowledgeable about computers and the application as a whole. It was observed how participants used general computer knowledge to reach a goal. Additionally, this study
24 suggests perceived usefulness as an important predictor of feature underuse. Potential benefits of a feature therefore seem to play an important role in a users’ decision to adapt a feature into daily life.
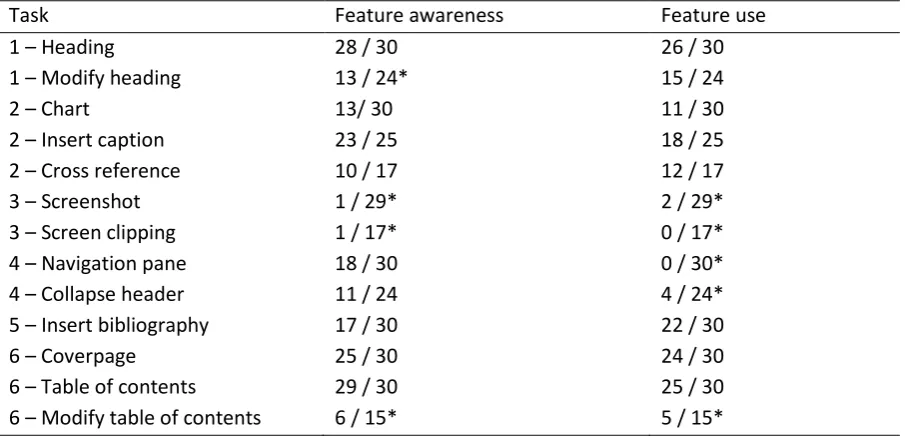
[image:25.595.73.526.198.416.2]To measure feature awareness, participants were asked to indicate whether they knew of a feature’s existence. This rate was then compared to the frequency that a specific feature was used to complete a task during the study, and thus appropriated into personal routines. Table 3 depicts feature awareness and completion rate per scenario.
Table 3 Feature awareness and feature use
Task Feature awareness Feature use
1 – Heading 28 / 30 26 / 30
1 – Modify heading 13 / 24* 15 / 24
2 – Chart 13/ 30 11 / 30
2 – Insert caption 23 / 25 18 / 25
2 – Cross reference 10 / 17 12 / 17
3 – Screenshot 1 / 29* 2 / 29*
3 – Screen clipping 1 / 17* 0 / 17*
4 – Navigation pane 18 / 30 0 / 30*
4 – Collapse header 11 / 24 4 / 24*
5 – Insert bibliography 17 / 30 22 / 30
6 – Coverpage 25 / 30 24 / 30
6 – Table of contents 29 / 30 25 / 30
6 – Modify table of contents 6 / 15* 5 / 15*
* Participants portrayed a striking difference in behaviour with regards feature awareness and feature use. Either participants discussed their awareness of a feature yet did not actively used the feature to complete the task, or did not indicate feature awareness but were able to use the feature to reach their goal.
This table indicates that feature awareness does not necessarily imply feature use. This observation is especially evident with the navigation pane and collapse header feature. Most participants were aware of the feature’s existence, yet chose to complete the task using another method instead. This suggests that these features did not support the behaviour of the participants well enough that it would enhance their feature use, or that participants were set in their own personal routine and did not consider using features included in the application.
25 Last, two features were almost entirely unknown: The screenshot and screen clipping features. Most participants already had a routine in place that helped them reach their goal which caused them not to consider possibilities in the application itself. In general, this routine included using a different application (the Windows snipping tool included in every Windows version since Windows Vista) to select the image necessary for the document.
As table 3 suggests, even though many participants were unaware of features, they were able to use them. During the study, participants were asked several questions that would prompt them to consider the possibility of certain features to be included in the application. These were questions like: “If you would want to reference to this graph, how would you do that?” or “You want the table of contents to only show x headings, how would you do that?” Often times, these questions motivated participants to search for these features, as it arose suspicion of a feature’s existence.
Participants mentioned several reasons not to use specific features. First, it was often the case that participants were unaware of a feature. Second, many participants already had a personal routine in place which involved completing a task with an alternative application. This could have caused them not to consider the possibility that a similar feature would be included in Word. Furthermore, the perceived benefits of using a feature was indicated as a consideration for feature use. Lastly, the data suggests that personal preferences are a significant predictor for feature use, as features that do not satisfy these preferences are less likely to be used.
5.2 Appropriation of the application
The data suggests that students have appropriated Microsoft Office Word into their own lives in a variety of ways. To begin with, the application seems to serve more purposes than merely text editing. For example, several participants stated they used the application also to check their spelling of important e-mails or do a quick word count. Through these actions, the application is able to support the user in reaching their goal, even though it is not its main purpose. Moreover, Microsoft Office Word is frequently used as extension of other applications or solutions. For example, participants mentioned that project work in groups is often done in Google Drive as it is possible to edit the document simultaneously. However, making the final lay-out of the document is often done in Word, as it supports more extensive lay-out features.
Appropriation also becomes evident on feature level, where features are used in a different manner than they were intended for. The table feature is for example used to number equations in the document, since this is not supported by the equation feature. Such feature shortcomings encourage users to figure out alternative solutions to reach their goal and make creative use of the existing functionalities.
Moreover, disappropriation of the application was common practice amongst the participants, mostly through the use of other applications to reach personal goals. Disappropriation can be related to the negative evaluation of the entire application which caused users to switch to alternative text editing applications. Especially technical students actively chose to abandon Microsoft Office Word, by switching to applications such as LaTeX. Participant 1 explained his application preference as follows:
26 The study also indicates elements of non-appropriation of the application, where users actively chose not to discover certain features. This was mostly related to the personal routines which resulted in use of other applications, despite feature awareness. The applications that most frequently caused participants not to discover features were: Excel, Windows Snipping tool and EndNote. Non-appropriation seems to be closely related to the paradox of the active user (see chapter 5.3 for these results).
5.3 Paradox of the active user
The paradox of the active user is in this study indicated as important predictor of feature use. Users stick to the procedures they are familiar with, rather than experimenting with new features to accomplish their goals. This study suggests that feature awareness only plays a small role in users discovering these features. As table 3 indicates, many participants were aware of a feature’s existence, yet had not actively appropriated them into daily life, also illustrated by the following statement: [5] “I knew that it [navigation pane] was there, but I have never used it” (Participant 11).
The active user paradox was often observed through the routine behaviours of participants. Many users already have a certain routine or behaviour in place to reach their goal, which prevents them from discovering and using more efficient features. It was observed that many participants did not want to deviate from known patterns, although more efficient features were known. This process was explained by several participants, for example:
[6] “The only thing is, it can probably all be improved, but you have to know it exists. And I think, these aren’t things you are going to look up. In fact, you usually already have your own solution for these things.” (Participant 6)
[7] “In the end you already have a routine, and after you have done something you realise: ‘Of course, there was also an easier way to do this’. I think this is inevitable.” (Participant 21)
This study suggests that the production bias is more prominently related to non-use than the assimilation bias. Users are often aware of existing features, yet choose to use alternative procedures to reach their goals. This observation can be related to two major explanations. First, participants often anticipated the frequency of using that specific feature. Participants were much less motivated to discover a feature that they would use rarely in the future, as illustrated by this statement:
[8] “Usually when I think: “This can be done differently”, it is about something that I rarely use. So if I cannot find it within a certain time frame, I do not see the point of looking for it. That’s because I then think: I’ll use it once, and that’s it.” (Participant 22)
27 The assimilation bias was less evident from the collected data. Knowledge and experience with other applications rarely prevented participants from discovering features in Word. Rather, experience with other applications actually helped participants find the features asked for in the scenarios. However, participants did make inferences about the purpose of several applications, Microsoft Office Word included, which prevented them from completing certain tasks within Word itself. Many features not directly related to text editing that are included in Microsoft Office Word were often completed with alternative applications. This preference was either because users were not aware of the possibility to complete a task in Microsoft Office Word or because another application better supported the user in their behaviour. In both cases, the alternative application chosen was specifically designed to help the user reach that specific goal. For example, participants preferred to use Microsoft Office Excel to convert a table into a graph, or preferred the Windows snipping tool to cut out images. This could have caused some participants to not consider the possibility of such features to be included in Microsoft Office Word and unawareness of the features as a consequence. Participant 10 described this clearly: [10] “Excel is developed for this kind of thing and Word is not. It is therefore easier in Excel.”
5.4 Feature underuse
Feature underuse was most commonly observed with features that were used to personalise the document. The larger features tested, such as apply headings and create a table of contents were generally known, whereas less awareness was observed with regards to changing these elements to fit personal preferences.
Secondly, a striking observation was that only part of efficient procedures were known and used where a combination of features could be used to experience their full potential. For example, assigning captions to tables and figures was commonly known and rated as very useful. However, referencing to these elements in the text was often done manually while this could also be done automatically using the cross-reference feature. This was, for instance, described by participant 18: [11] “This [cross-reference] is useful, I did not know this. I will use that.” Another example of this observation were the references, where participants were able to manage their sources and create a bibliography, yet did not use the insert citation feature to reference to their sources in the text.
Lastly, conscious underuse seems to be a common practice. It was observed how several participants actively chose not to use features included in the application. For example, several participants explained that they rather create their own coverpage or download one from the internet than use the automatic coverpage feature. This was either because the included coverpages were not aesthetically pleasing, or because the participant liked to create their own coverpage in alternative applications, such as InDesign or Photoshop. This suggests that this particular feature is unable to support the behaviour of its users, which causes them to use alternative solutions that are better able to match personal routines.
28 Conscious underuse can be related to the paradox of the active user. Users are often aware that features exist, yet choose not to use them in everyday use. This is unrelated to whether the user has tried to use the feature or not. Often, users are not willing to invest time in discovering feature workings, consider the time needed to learn the feature and the frequency of using that feature. In addition, conscious underuse can also be related to the perceived usefulness of a feature. Features that can enhance efficient use, yet are perceived to have little added value are more likey to be excluded from everyday use, as illustrated by this statement:
[13] “I think it works okay as is, but I think it is a bit redundant to open a separate Excel sheet, while you can also open Excel.” (Participant 10)
5.4.1 Most underused features
Sub question 1 focused on specific features that are frequently underused by the target group. The results suggest that the features most prone to underuse have similar characteristics related to a selection of usability antecedents: simplicity, consistency and intuitiveness. Features that lacked these characteristics were more often underused. The study indicates that feature underuse is a result of the information architecture of the application. The location and structure of information presented to the user influences the likelihood of information processing and feature use. Understanding where to find a feature and the information required to use it are key in its use. Application architecture that supports intuitive use of a feature is allows use with little cognitive effort, enhancing feature use. In addition, inconsistencies in feature location prevents users from discovering the full potential of a feature and can lead to incorrect conclusions with regards to the inclusion and use of features. Users indicate that information required to use the feature was not always accessible which negatively influenced its use. Having knowledge of feature working is relevant when users desire to use a feature. Feature simplicity is thus relevant in predicting its use, to minimize knowledge required for use.
5.5 Determinants of non-use
This chapter attempts to narrow down the determinants of non-use to determinants of feature underuse. The goal is to link these determinants to the identified feature characteristics: complexity, location and terminology.
5.5.1 Technological characteristics
Previous research has identified four types of technological characteristics that could predict the likelihood of feature underuse. Two of these determinants have been identified as most evident in the data: Convenience and performance. Convenience can be related to specific feature characteristics, whereas performance is better in explaining general application use.