Creating a tool to test the effects of
visual feedback on rhythm learning in a
school environment.
Student: Calvin Kie Ming Kho No. s1601288
BsC Creative Technology Faculty EWI University of Twente Supervisor: Dennis Reidsma Critical Observer: Robby van Delden
Abstract
Abstract 1
1.Introduction 5
2.State of the Art 6
2.1 Music 6
2.1.1 Music and People 6
2.1.2 Music and Education 6
2.2 Technology in Education 7
2.2.1 Technology in the classroom 7
2.2.2 Technology in Music Education 8
2.3 Visual Feedback 9
2.4 Analysis 9
3. Specifications 11
3.1 Client Specifications 11
3.2 Other Stakeholder Specifications 11
4. Conceptualisation 13
4.1 back end concept 13
4.2 front end concept 14
4.3 Restrictions 14
5. Design 16
5.1 Back end design 16
5.2 Front end design 17
5.3 Design compromises 18
6. User Testing 19
6.1 Goal and approach 19
6.2 Hypotheses 20
6.3 Measurements 20
6.3.1 Visual feedback data 20
6.3.2 System Usability 21
6.4 Setup 21
7. Results 23
7.1 User test Demographics 23
7.2 Observational Results 24
7.3.1 Raw Data 24
7.3.2 Paired samples T-test 25
7.4 Survey Analysis 27
7.5 External user test 27
8. Discussion 29
8.1 Outcomes 29
8.2 Changes and the future of the system 29
8.2.1 Front end changes 29
8.2.2 Back end changes 30
8.2.3 The future of the system 31
References 32
Appendix 34
User Test Instructions 34
Raw Data Charts 35
120 BPM No Visual Feedback 35
120 BPM Visual Feedback 37
80 BPM No Visual Feedback 39
80 BPM Visual Feedback 41
200 BPM No Visual Feedback 43
200 BPM Visual Feedback 45
Raw Data Histograms 47
120 BPM 47
80 BPM 48
200 BPM 49
Absolute Beat Averages Per user and Difference Charts 50
120 BPM 50
80 BPM 51
200 BPM 52
Absolute Beat Averages Per user Histograms 53
120 BPM 53
80 BPM 54
200 BPM 55
Survey 56
Survey Results 57
Overall Results 57
1.Introduction
The use of technology in the classroom has take more of an active role in teaching for the last decade. Modern teachers have been incorporating many new forms of technology to improve teaching overall by either making the lives easier for the teachers or students or by making the teaching it self more effective. According the a trend report on ‘How technological trends enable customised education’ published by SURFnet [1], there are three ways that technology can facilitate people to provide a better education: Technologies that enrich teaching and learning, Technologies that help incorporate the flexibility in education, and adaptive learning technologies. The report looks at many of these technologies including but not limited to, virtual reality, learning analytics, and gamification. However, the use of technology in music education is not as common.
The main underlying goal of the project reported in this paper is to change the teaching of music to children during their primary and secondary school education through a creative use of technology. Specifically, a co-operative rhythm teaching system, based on the work of B.Spieker [2], that can simultaneously assist in the teaching of rhythm to the entire class and provide feedback to the teacher on the progress of individual students. It should be possible to eventually expand the system to teach other aspects of music education such as tones and scales. Since there are very little uses of technology in music classes, a system like this could potentially change the way how people teach music today and improve music teaching overall. In order to ensure that the product becomes a success, a research is carried out to find out how technology can affect the learning of a child specifically in music education. Various different forms of technology have been explored such as robotics and virtual reality, though the focus was to look at the different forms of visual feedback and how effective they are.
In order to understand how technology can affect music education, a look at music education separate from technology should first be taken. Separately, we should also look at available technologies. Once both areas are discerned, a solution can be found.
Since the focus of the project revolves around the learning of rhythm, past research on rhythm analysis software and BPM (Beats Per Minute) detection is necessary, as seen in articles like the one by Alonso, David, and Richard [3]. A way to provide input data is also required. This could be accomplished using an musical instrument, an input device such as an electronic drum, or simply a through smart device like a tablet. Once a suitable way to both provide and analyse the data is found, an investigation will take place to find the most effective way to process it into visual feedback for the students. To help with this, the following research question is constructed:
- How can the use of visual feedback through technology assist in the learning of rhythm in music?
2.State of the Art
In order to answer the research question sufficiently, a background research is required to deepen the understanding on the proposed research areas. Firstly, the existing research on the effects of music, followed by the effects of the education of music on people will be looked at. Next, some different technologies used to interact with humans and their uses will be explored. Finally, ‘rhythm analysis’ and ‘visual feedback’ research will be discussed in more detail. Once a satisfactory amount of background information is gathered, a rationale for our own research on a system for rhythm education will be put together and if necessary, potential adaptations to the research question will be made.
2.1 Music
2.1.1 Music and People
Music has been a part of humanity since the start of their existence. It has been used as a form of communication or expression in order to portray certain emotions. This means that people can feel the emotion within the music. When certain songs are heard (especially pieces that they desire), it triggers response in their brains. According to research done by Blood and Zatorre [4], when pleasant music is heard, blood rushes to the areas of the brain that provoke emotions, arousal, and reward/motivation. This area of the brain is also responsible for responses to stimuli like, food, sex, and other euphoria-inducing activities.
Cognitive psychology experts Peterson and Narmour [5]-[6] deconstructed music to see why people feel emotion. They discovered that composed pieces of music that are well put together and follow certain patterns elicit emotional responses. Their theory states that when music is heard, people have an expectation to what comes next. If the expectation is met, it triggers a feeling of satisfaction. However, the opposite will happen when an unexpected note appears where they would feel surprised or even disappointed. This also proves that people will not only feel positive emotions through music but also negative ones. The research of Blood and Zatorre [4] empirically tests their theory by actually observing the emotional reaction happening via brain scans.
Based on these findings, though it is not the main focus, emotions must be a factor to keep in mind when designing the product’s musical functionalities as it could encourage learning by provoking a positive feeling from it.
2.1.2 Music and Education
‘white matter’ in the brain which are responsible for functions linked to learning according to Bengtsson, Nagy et al.[9].
Emotion can also play a big part in education. An article written by Bower [10] investigates the influence emotion has on memory and thinking. Results show that depending on the mood the subject was in, they would recall different things. For example, if they were in a certain mood during an event, it would be easier to revisit the memory when they were in the associated emotion. This is not only true with the recollection of one’s memory but also during the storing of memories. When the material being presented agrees with the current emotion of the subject, they are more likely to memorise the materials. Finally, emotion can also influence the imagination of a person. Depending on their mood, their ideas generated matched accordingly.
Musical education can be a big part of a child’s development as it could improve many of their skills. This shows the importance of the final system in its role to possibly improve musical education as a whole. Since music can trigger the release of dopamine in the brain [4], Berridge and Robinson [11] discovered that the dopamine could encourage the student to want to learn as it is tied to rewards and learning incentives.
2.2 Technology in Education
As mentioned in the introduction, it is common to find technology in the classroom these days in many forms and for different uses.
2.2.1 Technology in the classroom
The use of technology for teaching is used in various areas of education and has been shown to have positive effects on the overall learning of the student. Tamim et al.[12] summarised 40 years of research data addressing whether technology has a positive impact in a student’s achievements in a classroom. The results show that the use of technology significantly improves performance of the student by a mean effect size of 0.35 larger than zero.
The positive effects can be seen when using immersive forms of technologies. Dede [13] show that being virtually immersed can enhance education in multiple ways that revolve around placing the user in the right context and providing them with multiple perspectives. This claim is further reinforced by Freeman, Eddy, McDonough et al. [14] where they looked at the benefits of active learning over classical lecture learning even raising questions whether to use active learning instead of regular learning specifically in the areas of science, engineering, and mathematics. This could refer back to the research done by Hyde [8] where musical skills relate to mathematical skills as well.
and educational. It can also be used to provide helpful feedback and reduce overall errors during procedures.
However, the use of technology is not always positive in the case with children. Wu, Lee, Chang et al.[17] claim that the use of augmented reality (AR) can in fact overload the student with too much information which raise some learning issues and affect it negatively, though some possible solutions are provided to overcome these challenges.
A more child-friendly form of technology in education would be through Gamification which is the adoption of game design elements in a non-game context. Hamari [18] and Domínguez [19] studied the effects of gamification. They find that there are some positive effects when using gamification in the classroom especially in practical assignments. Students generally had higher motivation and were more engaged with the curriculum. However, when it came to written assignments, they performed poorly. Over time the motivation levels dropped lower than classes who were not gamified which is evident in a research done by Hanus [20]. They all suggest that the use of gamification in classrooms should be done with care and the results may vary depending on its context and on the students using it.
2.2.2 Technology in Music Education
Though the use of technology in musical education is rare, there has been research done in this area and some cases exist where technology is used when teaching music. Savage [21] states that the use of technology for music education can be widely beneficial however, some teachers can be slow to adapt the new forms of teaching. The article lists three ways how technology can improve music teaching:
1. Technology can act as another musical tool next to the existing instruments and teaching tools.
2. It can be used to elaborate traditional music education and things can be shown that are previously not possible with current methods.
3. The use of technology can make the different work types (individual or group) more manageable.
The paper concludes by saying that the technology can help pupils understand and manipulate music in new ways that were previously not possible. These claims are further reinforced by Wise, Greenwood and Davis [22] where they ask nine music teachers in New Zealand to incorporate digital technology into their music curriculum. Results show that the learning experiences of their students are enhanced dramatically and the teachers are enthusiastic to incorporate more and believe it as a step in the right direction regardless of their skills with ICT.
via an “Augmented Mirror” through the use of 3D motion capture. This system builds on the traditional functions of a real mirror. The concept of mirror feedback is further explored in a paper by Radell [25], where the effects of a mirror in a dance class is looked at. Though the mirror can provide direct visual feedback of themselves and of other dancers. On the contrary, the use of a mirror can make the dancer too self-conscious about themselves and can impact their dancing negatively.
Smith [26] looked at the effect of computer-assisted instruction (CAI) when learning rhythm sight-reading skills. There appeared to be no difference in improvement between students who attended classical rehearsals versus students who received CAI. This shows that the CAI can be used as a good change in routine when learning rhythm since it is able to contribute equally well when compared to the rehearsals.
2.3 Visual Feedback
By using technology the possibility of providing visual feedback can also be a benefit when teaching dancing as mentioned by Radell [25] which is also the case with other areas of music learning for example with singing. Howard [27] developed a system called ‘SINGAD’ (SINGing Assessment Development) which displays a series of notes which the child is require the sing. The system will then provide feedback by converting the singing into notes and comparing the two together. After several weeks of using the system, the child had significantly improved their note pitching compared to children who did not use the system. Howard [28] continued the research by applying the system to provide real-time feedback on singing studio displays. This also proved to be successful however the display could sometimes be a distraction to the student.
Eldridge, Saltzman, and Lahav [29] also looked at the effects of visual feedback on pitch recognition and they discovered that participants who had audio-visual feedback had significantly better results than participants who only had audio feedback even though pitch recognition would not rely on visuals. They demonstrated how redundant sensory feedback could increase learning. This is further proven by Burke, Prewett, Gray et al.[30]. They state that the use of visual-tactile and visual-auditory feedback improves overall performance more than just visual feedback alone when reducing reaction time. However, the feedback does not reduce the rate of errors being made and the results differ depending on the task being executed. Visual-tactile feedback is better when multiple tasks are being executed while Visual-Audio feedback is better when a single task is being performed.
2.4 Analysis
Based on the research, the use of technology in music education seems to be a step in the right direction. Not only can it provide many benefits to the teacher by providing them with more tools to work with and allowing them to engage the students in their teaching [21]-[22][26], it can also help with the learning of the student by making the learning more interactive and motivating them to learn [23]-[26]. Using technology to provide feedback for music learning has been shown to be effective already but only for areas like singing [27]-[29], dancing [24] and general instrument motor-skills [23]. Though there is a paper regarding the learning of expressive percussion performance using visual feedback by Brandmeyer, Timmers, Sadakata et al. [31], it focused more on the performative aspect of percussion and imitation of the teacher’s performance rather than the rhythmic aspect of percussion. Therefore the current research question still stands:
- How can the use of visual feedback through technology assist in the learning of rhythm in music?
And
3. Specifications
This project was carried out in collaboration with B. Spieker [2], a expert in music education at the Artez Conservatory in Enschede, The Netherlands. He created a system called ‘’In The Zone’ which he used in his research on the effects of visual feedback on the synchronicity between multiple drummers. Currently, the system is limited to four users and is expensive. The client wants the system to be expanded so that it could be used in a primary and secondary school environment. This means the system should follow certain guidelines to meet his goal.
3.1 Client Specifications
After a meeting with the client, a few specifications were given in order to improve his system and transform it in such a way that it would be more suitable for use to teach rhythm in an educational environment. The following points were given:
- The system is to be expanded so that it could accommodate an entire classroom of approximately 30 children.
- The system should be able to provide live feedback to the students.
- The system should be able to provide detailed rhythm data to the teacher for each individual student.
- New designs should be made for the visualisations of the feedback.
- The new system should be programmed in a more flexible programming language. The current system as it stands is built by B.Spieker[2]. It is restricted to only four players simultaneously and only provides one form of visual feedback. Though it generates detailed rhythm data while the participants play, it is not easily visible by a third party. Presently, the back end of the system is programmed with Max/Msp/Jitter which is a modular audio programming language and is quite restricted with its capabilities in terms of the expansion of the system.
3.2 Other Stakeholder Specifications
4. Conceptualisation
Taking the specifications by the client and the stakeholders into consideration, a brainstorm session was held with the client to think of various concepts for both the front end (User-Interface and Aesthetics) and the back end (Programming and hardware).
4.1 back end concept
The priority of the back end system is to make it flexible which the current programming language (Max/Msp/Jitter) does not fulfill. A programming language that fit this criteria like JavaScript would be a more suitable language to build the system on. Having the backend in JavaScript means that the system can be used on many different platforms since it is a widely used programming language. This also means that future researchers are more likely to have some base knowledge in this language allowing them to further expand the project.
Since the system is a rhythm teaching tool, an input was required to play a beat. There were several possibilities that were both tactile and durable. The more physical solutions would be products like drum-pads or drum-triggers which are usually quite high in price. The cheaper solution would be to use sensors such as microphones or piezoelectric sensors instead which would be connected to the system via an arduino. These sensors could be attached to other musical tools (for example ‘Boomwhackers’ or drumsticks) to create a more physical interaction with the system. However, the presence of wires was not suitable for a class environment and arduinos and sensors tend to have a large amount of wires attached to them. A less tactile solution was also possible. One such example would be the use of the space bar or a mouse click if the system was to be run on a computer. Another solution would be the use of a touchscreen on a tablet or smartphone if the system was an application. These are also platforms that many modern schools already own as seen in the ‘trend report’ [1] which would potentially eliminate the hardware costs completely.
4.2 front end concept
The main criterion for the front end concept is that it should be fun yet easy to use for both the teacher and the student. Gamification was one of the trends in the ‘trend report 2016’ [1] and is often used in order to make something more fun and engaging. Based on previous research, gamification can be very effective if used in caution since overuse will lead to the opposite effect of demotivating the subject and producing negative results. However, ‘Rhythm’ is only part of the musical education that children undergo in school therefore they will not be in constant contact with the system throughout their education and only briefly during the relevant part.
Many rhythm based games were looked at to find inspiration for the system. Popular products like ‘Guitar Hero’ or ‘Taiko: Drum Master’ provide basic indication whether or not the player is playing accurately which is accompanied by a scoring system. There is often a moving timeline with ‘beats’ that the players have to hit as it scrolls over an indicator. It would score according to how accurately they hit the beat on the indicators. This is the most common form of gamified rhythm but it is not designed for rhythm education since it is more about the accuracy on which the player hits the visual rhythm cues and the music is not the main focus. However, inspiration can still be taken from these games since it could be a familiar concept to the students. There are other products like ‘Touch Pianist’ who take a more artistic approach. It does not indicate whether or not the player is playing correctly or incorrectly. It lets the player decide how to play. This could be an effective way to teach students if the rhythm data is still being generated in the background. Not only will the students be playing on their own accord, the teachers will still be provided feedback based on the student's performance.
One thing to keep in mind is that the system should be designed to have 30 simultaneous players, so a choice must be made whether to provide a user interface and visual feedback to each individual student or to provide one to all 30 participants. Inspiration can be taken from ‘party’ games like ‘Mario Party’ where players complete simple tasks together using their own controller and receive a reward based on the group’s performance. In the case of rhythm education, their controller would be the rhythm input and the feedback would be their reward based on the average beat accuracy as they work towards a common goal. The feedback provided should not be condescending as it could affect the child’s motivation negatively which in turn reduces their learning capabilities. The more detailed feedback should be restricted to the teacher’s eyes only. This way they would know what areas a student might be struggling in and help them accordingly.
4.3 Restrictions
There are a few design restrictions before the main design is made:
- Secondly, only a basic input method was explored since the focus lies elsewhere. This meant that there was little design work done in how rhythm is being transferred from the user to the system.
5. Design
The final product consisted of three parts:
- The student interface, where the student plays the rhythm.
- The teacher interface, where the teacher can control the activities and see a more detailed overview on a student’s performance.
- And the Visualisation, which shows the overall performance of the class.
5.1 Back end design
The system is built as a web-app using JavaScript, HTML, and JQuery. This allows it to be a flexible system that can be used on multiple different platforms such as a computer or a tablet which are both available for use in modern schools.
Fig.1 Back end design diagram.
The system records input based on timestamps and then calculates the difference between each beat to determine beat accuracy. The players are tasked to play accurately to a beating metronome with an adjustable BPM (Beats Per Minute). After eight beats, visual feedback will be shown based on the player's performance. By using this base system, we will be able to test:
- The student user interface (Beat input)
- The teacher user interface (changing of beat speed and more detailed rhythm information printed on to the web browser console)
- And a visualisation based on beat accuracy.
The system would also make use of a ‘NodeJS’ server which would act as a temporary storage for rhythm data and allow each individual part to interact with each other.
be expanded. This new calculator also allowed the players to play off beat but still in rhythm and will not penalise them for it. The new design revolves around the ‘timestamp’ feature on JavaScript which ticks every millisecond but in order to calculate how well someone is performing a baseline value needs to be established to compare with. A simple calculation was done to determine how many milliseconds there are depending on BPM.
illiseconds between each beat BP M
1000 x 60 = m
Using 120 BPM as an example:
00ms
120 1000 x 60 = 5
Now to compare the beat of the user with the target beat, a time between each tap is needed. When the system is active, every time the user hits a beat followed by another beat, the difference between the two beats will be calculated and placed into array. The final result will be determined by subtracting the target (the BPM counter) from the user input. For example:
ime between player taps 82ms
T = 4
20 BP M 500ms
1 =
82 500 8ms
4 − = −1
As the result shows, the player is 18ms too early, compared to the timestamp of the previous beat, for 120 BPM.
5.2 Front end design
Regarding the front end design of the system, gamification was the main inspiration. Though long-term use gamification may not be effective, since rhythm is only a small part of musical education, it can be used effectively. Not only will it be familiar with the children due to the plethora of existing music/rhythm games on the market, it will also help with encouraging the students due to the playful nature of the product. A decision has been made to add an audible beat sound to the metronome by default for two main reasons:
- Rhythm in music is very hearing oriented.
- Based on the feed-back research by Burke [30], visual feedback was only effective in addition to audio, as compare to just visual feedback alone.
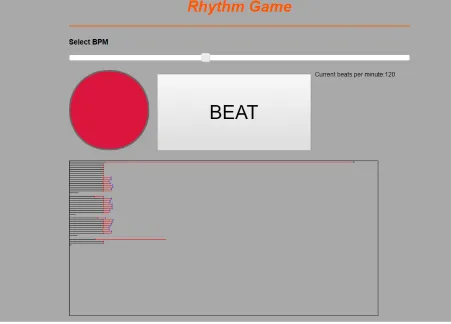
The beat sound was played whenever the metronome pulses. The metronome was placed to the left of a large beat button which is situated in the center of the screen which meant the subjects eyes are immediately drawn towards it as seen in figure 2. The design was made to imitate the looks of a generic button to encourage the pressing of it.
player is hitting the beats accurately. Every time a beat was played by the user, a colour was given depending on how closely the user plays along with the rhythm of the metronome. The colours will be indicated using eight small boxes placed beneath the button. Each box representing one of the eight beats being played.
5.3 Design compromises
Some compromises were made to reduce the scope of the project. Firstly, a focus was put on the creation of a flexible system that allows us to test both, the ability to display different forms of visual feedback for rhythm learning and to test the effects of visual feedback on rhythm learning. The system had to act as a platform for further research in the area of visual feedback in music education. This meant that some features like the full teacher and student interfaces were not fully realised and the front end design was not as polished as initially intended.
6. User Testing
The system described in the previous chapter has been tested with users to evaluate its usability and usefulness, as a tool to see the effects of visual feedback on a person’s performance in rhythm and, as a tool for future visual feedback research. Several steps were taken in order to get the best results.
6.1 Goal and approach
The user test has been designed to answer the following research questions:
- To what extent can the system be used to test visual feedback for a learning environment?
- To what extent can visual feedback improve rhythm in a learning environment?
In order to answer them, two variations of the system was made; one with visual feedback and one without the visual feedback. Half the participants used the system without visual feedback first followed by using the system with the visual feedback in place. The other half did the opposite (visual feedback first followed by no visual feedback). This will ensure that a player’s level of ‘practice’ will not affect the results of the visualisations. Both systems were designed to test all aspects of the final system (Student side and Teacher side). Answering these questions means the system will be ready to be applied in school environments and be ready for use in further testing for other features like additional visualizations, inputs or different areas of music.
Fig.2 test system without visual feedback Fig.3 test system with visual feedback
representation of the feedback that students will receive and will also be what will be used to test whether or not visual feedback can help with rhythm.
6.2 Hypotheses
To help answer the two questions, two accompanying hypotheses were established and statistical analysis was applied to prove or disprove them. The first hypothesis and its null hypothesis relate to the first question and is as follows:
- H 1 = The system can be used to test the effects of visual feedback on rhythm.
- H 0 = The system cannot be used to test the effects of visual feedback on rhythm. If results show that H 1 is true, then the system can be used as a tool in further research in the area of the effects of visual feedback on rhythm. If it turns out that it is not the case, then either changes must be made on the existing system or a revised version of the system must be built from the ground up that does fulfill the hypothesis. The new system will have to undergo the same testing and pass the test.
The second hypothesis related to the second question of whether or not visual feedback has a positive effect on rhythm learning:
- H 2 = Visual feedback improves the rhythm of people.
- H 0 = Visual feedback does not improve the rhythm of people.
If the hypothesis passes the statistical tests, then it proves that visual feedback indeed improves one’s rhythm, however if this is not the case, then visual feedback has no or even a negative effect on rhythm. Proving this hypothesis will also prove the first hypothesis. If results can be taken to prove the second hypothesis, it shows that the system is effective in testing the effects of visual feedback on rhythm.
6.3 Measurements
Two main factors were measured in order to prove the two hypotheses: - The effects of visual feedback on rhythm (milliseconds)
- Usability of the system
6.3.1 Visual feedback data
individual beats were graphed on a histogram to see whether or not there is an increase in lower values (closer to the target beat). Then the absolute averages of each participant were taken. One average for the results without visual feedback and an average take of the results with visual feedback. The absolute average indicated the average difference away from the target rhythm. These averages were compared using a paired t- test to determine whether or not there is an improvement in the user's rhythm performance between their trial on both systems. If the value is above zero, it means there is an improvement when using the system with feedback. However, if the values are below zero, the opposite has occurred.
6.3.2 System Usability
The second factor measured was the overall usability of the system. This was recorded using different methods. First, observations were made to see how the test subjects navigated through the system. If they were able to use the system without much hassle, then the system is easy enough to use. Next, the users were asked to fill in a survey asking them how easy it was for them to use the system. Finally, in order to test whether the system is able to be used as a tool for future research, the code was given to another user so that they could make their own visual feedback using the existing variable and codes provided in the existing system. If the user is able to create new tests, it will show that the system is ready for use in future research and is able to test different visual feedbacks in general.
6.4 Setup
To help gather the necessary measurements several tasks were executed by the testers. Each tester executed a total of three tasks, each with three variations for each of the two systems; one system without a visual feedback system in place, and one with a visual feedback system. The tasks are as follows:
- Adjust the metronome slider: Adjusting the metronome slider simulates one of the tasks a teacher would have to execute if it was implemented in a school. Having the testers use this feature would help test whether it is simple enough for a teacher to use. It also sets the benchmark for the next task.
- Reveal the results: This last task was only viable for the system with the visual feedback system in place. After the test subjects tried to match the rhythm for eight beats, a visual feedback based on their performance will be shown to them. They were to play eight more times based on the feedback. The feedback will change according to their new performance showing new results. They were to play the final eight times based on the second set of feedback making total of 24 beats played.
These tasks were first done at 120 BPM (Beats Per Minute) which is a fairly standard base rhythm and commonly used in music. The tasks were then repeated with 80 BPM (the average heart rate) and finally 200 BPM. Having the tester play at three different rhythms will show whether the speed of the rhythm will have any effect to the results. Half the users were given the system without visual feedback first followed by the system with visual feedback. The other half did the opposite (With visual feedback followed by the system without visual feedback). This was done so that the results are not affected by ‘system practice’ and to show that visual feedback will affect rhythm regardless of order. Finally, after all the tasks have been executed, the users were asked to fill in a basic survey stating their age, musical expertise, and how what they think about the general usability of the system. They were also asked whether they think they played better with or without visual feedback. This was done to help answer the first hypothesis of whether or not the system is a viable visual feedback research system.
7. Results
After undergoing user testing, different forms of data was collected.
- Observational data collected during the user test of the two systems looking at how they interacted with the system.
- Beat difference data of each participant while they use the systems with the three different BPMs (120, 80 and 120).
- Survey data from the surveys filled in by each participant which include age, gender and musical expertise among other things.
- Feedback data directly from testers and researchers based on the system performance and functionality.
The various data will be processed and presented followed by an in depth analysis using statistical tests to process the data and answer the hypotheses made in the previous section.
7.1 User test Demographics
Throughout the user testing phase, there were a total of 21 participants. 20 participants took part in testing the system and undergoing the rhythm tests and the final participant was given the codes of the system to create his own visual feedback by using the system as a base.
In the user test there were eleven male participants and nine female participants all ranging between the ages 17 - 29 with the majority being 21 years of age. In terms of musical experience, the results are fairly split. There is about a even split between users who are musically experienced and users who are not. Eight participants thought themselves to be musically inexperienced while seven thought they have musical expertise. The final five participants were neither musically experienced nor inexperienced and thought their musical expertise was about average.
[image:23.612.137.497.562.677.2]
The user tasked in using the system and creating his own visualisation is 26 years old with a background in programming allowing him to give detailed feedback on the code. Though he plays a musical instrument regularly, he believes himself to have low musical skill.
7.2 Observational Results
The visual feedback user test was executed without much problem. Most candidates were able to follow instructions without additional assistance however, some were occasionally confused. A few participants confuse the red metronome for a button. This could be tied to the construct and idea of a ‘Big red button’ that is referenced a lot in pop culture. There was also some confusion behind the ‘Results’ button. This button appears in the place of the ‘beat’ button after the user has played eight beats. Though some users have addressed that they found the addition of the button engaging, other thought it was confusing or unnecessary to show the results. In some cases, the results button was completely ignored when the user switched between the BPMs which resulted in some outliers in the result. Some participants also suggested the addition of a countdown since they were unsure when they should start tapping along with the beat. Finally, users generally found it harder to play at 80 BPM and tend to ignore the ‘results’ button at 200 BPM by continuously clicking.
7.3 User beat data
Throughout the rhythm feedback user test, beat data was recorded based on their rhythmic performance (calculations for this data is seen in section 5.1). The results were split into six categories:
- 120 BPM Without Visual feedback vs. 120 BPM With Visual Feedback - 80 BPM Without Visual feedback vs. 180 BPM With Visual Feedback - 200 BPM Without Visual feedback vs. 200 BPM With Visual Feedback
For each category, each user was asked to play a total of 24 beats (eight beats, three times) however, since there is no beat to compare with on the first beat, the first results are always zero and can be ignored. This means that there are 21 values of usable data per user for each category.
7.3.1 Raw Data
Graphing the values showed a general idea of what the results tell. For example, figure 5 is a graph that shows all individual values on the 120 BPM categories without the help of visual feedback. On the x-axis, the frequency of beats can be found. The y-axis indicates the time difference away from the target beat difference (in this case 500ms). Most values in all the graphs would trend towards the zero point since the testers were trying to match the beat. The closer the values are to zero, the more accurate the beat is to the intended beat. The rest of the histograms Fig.5 Histogram showing results of 120 BPM NVF
can be found in the appendix.
By looking at the data plainly, there were a few trends that were noticeable. Firstly, the increase and decrease of numbers around the zero point can be clearly seen on all graphs. For the 120 BPM categories, there is a fair amount more value around zero when there is visual feedback involved. This means that the frequency of which the participants played a single beat more precisely is higher. However, there is a decrease seen in the other two categories of 80 BPM and 200 BPM. When comparing their graphs with each other, though there were less extreme values and the numbers were grouped towards the center, the peak around zero is lower. Though the values were less precise between the tests with no visual feedback and the tests with the presence of visual feedback, the numbers were more accurate since they were more grouped around the center.
Another trend is that all the graphs featured a similar curve however; the frequency of which the beat differences were closer to zero was a lot higher in the 200 BPM category ranging between 200 - 250 instead of the usual 80 - 120 on the other two rhythms.
7.3.2 Paired samples T -test
average of each of the player’s trials were taken. To
calculate these values, the following was done:
) = Absolute Average bs(
A ΣAll values21
Beat Difference/ user
Now that the average distance from zero of every user per category was determined, another histogram was created for each of the tests to see if there were any different trends. As shown in the graph (fig.6) in the category of 80 BPM without visual feedback, there is one value per user making a total of 20 values. Most of the values would tend towards the
zero point however there are some Fig.6 Histogram showing avg. per user for 80BPM NVF outliers around 100ms. Similar to the
previous graph (fig.5), the x-axis represents the frequency of each value and the y-axis represents the user’s average distance away from zero. The rest of the graphs can be seen in the appendix.
A total of three tests were executed, one for each BPM category. The tests compared the values without the influence of visual feedback with the values gathered from the tests with influence of visual feedback. The following table was generated using SPSS:
Fig.7 Table showing the results of the Paired Samples T-test using the average beat difference.
By looking at the ‘mean’ and ‘t-score’, the average absolute beat differences were higher when visual feedback was used, resulting in a negative value in the categories of 120 BPM and 200 BPM which implies they performed worse when feedback was involved. However, the ‘mean’ and ‘t-score’ of 80 BPM show an average improvement among the participants showing positive value instead. When used against the hypothesis H 2 ( Visual feedback improves the rhythm of people), it is accepted if p ≤ 0.05 (confidence interval of 95%). None of the tests actually pass with 120 BPM barely missing the mark thus making the values statistically insignificant though by a small margin in the case of 120 BPM. However, if the confidence interval were to shift to 90%, the test can be executed again where H 2will be accepted if p ≤ 0.10. If this is the case, then the significance of 120 BPM is well within the margins and can be statistically significant but instead of being an improvement, there is a decrease in performance. The significance of 80 BPM barely misses the mark but the results show a decent improvement when visual feedback is used. Finally, when looking at 200 BPM, the score fails in both significance tests by a large margin therefore the data collected in this category is considered too random.
7.4 Survey Analysis
Next to doing the user test, the participants were also asked to fill in a survey based on their experience with the system alongside a few basic demographics questions previously discussed in section 7.1. When looking at the results of the surveys, the majority of the users said that the system was easy to use. 80% of the participants rated it a four or higher with only one participant rating it a two on a scale from one to five. 65% of testers thought it was easier to keep with the metronome while accompanied by the visual feedback system and the remaining 35% thought it was more difficult. Finally, 40% of the users felt that the visual feedback helped them with their rhythm while 25% thought the contrary and felt that it hindered their ability to keep with the rhythm. The final 35% were unsure whether or not the visualisations helped.
These results showed that the general reaction of the system was overall very positive which is a step in the right direction when trying to answer H 1 ( The system can be used to test the effects of visual feedback on rhythm) . It also showed that, though there was no actual improvement, they felt as if it was easier to play with the rhythm and that they were improving.
7.5 External user test
Fig. 8 Visual Feedback made by user tester.
The black horizontal lines were drawn based on the time between each beat of the metronome. The red lines were drawn representing the time between each beat of the user. At every tick of the metronome, the black line stops and leaves a small red mark and every time the user clicks, the red line stops and leaves a blue mark behind. By looking at how far the blue mark is away from the red mark, one can determine the time difference between the player and the target. The feedback is less forgiving but more detailed than the feedback used for the user test.
[image:28.612.80.531.78.402.2]8. Discussion
8.1 Outcomes
By doing the two user tests, both hypotheses could be answered. Firstly, though no statistical analysis was possible to help answer H 1 , based on the results from the survey and the feedback received by the external user tester, the system could be used to test the effects of visual feedback on rhythm though some changes would have to be made such as making the system easier to alter. The fact that results could be taken to help answer H 2 is proof that H 1 is true. Being able to collect data that could be analysed shows that the system can indeed be used to test visual feedbacks.
In the case of H 2 , results were mostly inconclusive though it does show that at 120 BPM, instead of improving a person’s rhythm, it makes the results worse. There were improvements shown as a trend at 80 BPM when visual feedback was involved but the test showed that the data was not statistically significant. The results may be insignificant because there might have not been enough participants taking part in the tests. With the addition of more participants in future tests, the results could become more significant and still follow the trend. There was also no correlation between the user's musical experience and the results implying that musical experience had no influence over the results during the experiment. Next, the results of 200 BPM might have been too random due to the rhythm being too fast. Based on the observations, at the higher speed, people tended to only tap rhythmically by following their subconscious and not pay attention to the feedback. On the other hand, when the speed is lower, they tend to pay more attention to the feedback and the metronome beats by following more consciously since it is a lot slower and more difficult to follow. Finally, since the user tests were done with university students of ages between 17 and 29, results could differ when used by primary and secondary school children instead so a future test with younger tester would be highly beneficial, especially since the system was designed with that user group in mind.
8.2 Changes and the future of the system
Several changes based off of the results and feedback must be applied to the system in order to optimise it for future research and use.
8.2.1 Front end changes
metronome is changed to a different shape and/or colour or the looks of the current metronome could be switched with the design of the current ‘beat’ button. This would encourage the users to press the correct button instead of the metronome.
Another design change would be the removal of the ‘results’ button. Though some have shown interests in this feature, it was mostly ignored or confusing to some of the participants. The initial idea was to have it in place so that users know when to expect the feedback. However this feature deemed to be redundant and the feedback could be shown after the 8th beat instead. This would avoid confusion and make the system easier to use.
Finally, more visualisations could be made to see whether or not a different form of visual feedback could have a different effect on the results. The current visualisation is very simplistic however a more complex visualisation could make it more appealing and encourage interaction. Also, the focus was mostly put on the back end of the system so the system could be made more aesthetically appealing by adding custom graphics and particles which would be especially popular among children.
8.2.2 Back end changes
The back end system would undergo the most change, especially if the system needs to be easier to use for future researchers. Based on the feedback provided by the external user test and client, other than the basic reordering the code to improve readability and finding web-host that does support the NodeJS server, the following changes were conceptualised.
- Since there was nothing signifying the events emitted whenever a user clicks or the metronome beats in the back end of the code. The addition of this would make it easier for the researcher to make use of these features.
- All the algorithms such as any of the metronome, or beat specific code could be pulled into a separate JavaScript file since these are features that will not be modified during the research and testing of other visual feedback.
- Make the system into a JavaScript library or API (Application Programming Interface) so that it would allow the researcher to basically plug in and use the features when they need it.
- Create another file which implements the existing UI (user interface) and visualisation as an example so that researches have something to base their designs on.
8.2.3 The future of the system
The system can already be used to test the effects of different visual feedback visualisations on rhythm, especially when the changes mentioned above are implemented. Researchers could collect data to figure out whether or not different forms of visual feedback could have different effects on a person’s rhythm. The data could then be easily processed in its current form by using statistical analysis and more hypotheses could be proven.
Though the results of the current hypotheses were inconclusive, with the right changes and implementations, the likelihood of the system being successful is there. Currently, the system could only test with basic rhythmic cues like the metronome. In the future, features could be implemented to test more complex rhythms like a drum beat or a custom beat created by the teacher for the students to play along with. Algorithms could also be written to generate beat patterns from existing songs as well to make the product more appealing for the general population. Rhythm could also not be the only limitation. The system could potentially be expanded to cover other areas in music such as pitch and volume.
References
[1] 2017. “Trend Report 2016”, SURFnet, [Online]. Available:
https://www.surf.nl/binaries/content/assets/surf/en/knowledgebase/2016/trend-report-2016.pdf . [2] B.Spieker. “###”,
[3] M.Alonso, B.David, G.Richard.() “Tempo and beat estimation of musical signals”, ENST-GET, Département TSI
[4] A. Blood and R. Zatorre, "Intensely pleasurable responses to music correlate with activity in brain regions implicated in reward and emotion", Proceedings of the National Academy of Sciences , vol. 98, no.
20, pp. 11818-11823, 2001.
[5] "Music and the Patterns of Mind and World", YouTube, 2017. [Online] https://www.youtube.com/watch?v=HeUjYzyh5v8.
[6] R. Lopez De Mantaras and J.L. Arcos, "AI and Music: From Composition to Expressive Performance”, Association for the Advancement of Artificial Intelligence , vol. 23, no. 3, pp. 43-57, 2002 http://www.iiia.csic.es/~mantaras/AIMag23-03-006.pdf.
[7] G. SCHLAUG, "Effects of Music Training on the Child's Brain and Cognitive Development",
Annals of the New York Academy of Sciences , vol. 1060, no. 1, pp. 219-230, 2005.
[8] K. Hyde, J. Lerch, A. Norton, M. Forgeard, E. Winner, A. Evans and G. Schlaug, "Musical Training Shapes Structural Brain Development", Journal of Neuroscience , vol. 29, no. 10, pp. 3019-3025,
2009.
[9] S. Bengtsson, Z. Nagy, S. Skare, L. Forsman, H. Forssberg and F. Ullén, "Extensive piano practicing has regionally specific effects on white matter development", Nature Neuroscience , vol. 8, no. 9, pp. 1148-1150, 2005.
[10] G. Bower, "Mood and memory.", American Psychologist , vol. 36, no. 2, pp. 129-148, 1981. [11] K. Berridge and T. Robinson, "What is the role of dopamine in reward: hedonic impact, reward learning, or incentive salience?", Brain Research Reviews , vol. 28, no. 3, pp. 309-369, 1998.
[12] R. Tamim, R. Bernard, E. Borokhovski, P. Abrami and R. Schmid, "What Forty Years of Research Says About the Impact of Technology on Learning: A Second-Order Meta-Analysis and Validation Study", American Educational Research Association, Review of Educational Research , vol. 81, no. 1, pp. 4-28, 2011.
[13] C. Dede, "Immersive Interfaces for Engagement and Learning", American Association for the Advancement of Science, Science , vol. 323, no. 5910, pp. 66-69, 2009.
[14] S. Freeman, S. Eddy, M. McDonough, M. Smith, N. Okoroafor, H. Jordt and M. Wenderoth, "Active learning increases student performance in science, engineering, and mathematics", Proceedings
of the National Academy of Sciences , vol. 111, no. 23, pp. 8410-8415, 2014.
[15] R.Haluck, "Computers and Virtual Reality for Surgical Education in the 21st Century", American
Medical Association, Archives of Surgery , vol. 135, no. 7, p. 786, 2000.
[16] M. Cox, D. Irby, R. Reznick and H. MacRae, "Teaching Surgical Skills — Changes in the Wind",
New England Journal of Medicine , vol. 355, no. 25, pp. 2664-2669, 2006.
[17] H. Wu, S. Lee, H. Chang and J. Liang, "Current status, opportunities and challenges of augmented reality in education", Elsevier BV, Computers & Education , vol. 62, pp. 41-49, 2013.
[18] J. Hamari, J. Koivisto and H. Sarsa “Does gamification work? - A literature review of empirical studies on gamification”, System Sciences (HICSS), 2014 47th Hawaii International Conference, pp. 3025-3034, 2014.
[19] A. Domínguez, J. Saenz-de-Navarrete, L. de-Marcos, L. Fernández-Sanz, C. Pagés and J. Martínez-Herráiz, "Gamifying learning experiences: Practical implications and outcomes", Elsevier BV,
[20] M. Hanus and J. Fox, "Assessing the effects of gamification in the classroom: A longitudinal study on intrinsic motivation, social comparison, satisfaction, effort, and academic performance", Elsevier BV,
Computers & Education , vol. 80, pp. 152-161, 2015.
[21] J. Savage, "Reconstructing Music Education through ICT", SAGE publications, Research in Education , vol. 78, no. 1, pp. 65-77, 2007.
[22] S. Wise, J. Greenwood and N. Davis, "Teachers' use of digital technology in secondary music education: illustrations of changing classrooms", Cambridge University Press, British Journal of Music Education , vol. 28, no. 02, pp. 117-134, 2011.
[23] P. Visentin, G. Shan and E. Wasiak, "Informing music teaching and learning using movement analysis technology", SAGE publications, International Journal of Music Education , vol. 26, no. 1, pp. 73-87, 2008.
[24] K. Ng, T. Weyde, O. Larkin, K. Neubarth, T. Koerselman and B. Ong, “3D augmented mirror: A multimodal interface for string instrument learning and teaching with gesture support”, Proceedings of the 9th International Conference on Multimodal Interfaces , pp. 339-345, 2007.
[25] S. Radell, “Mirrors in the Dance Class: Help or Hindrance?” , International Association for Dance
Medicine and Science (IADMS), 2013.
[26] K. Smith, "The effect of computer-assisted instruction and field independence on the development of rhythm sight-reading skills of middle school instrumental students", SAGE publications, International
Journal of Music Education , vol. 27, no. 1, pp. 59-68, 2009.
[27] D. Howard, “SINGAD: A visual feedback system for children's voice pitch development”, K TH,
Voice Research Center, Child Voice White, pp. 45-62, 2000.
[28] D. Howard, G. Welch, J. Brereton, E. Himonides, M. DeCosta, J. Williams and A. Howard,
"WinSingad: A real-time display for the singing studio", Informa UK Limited , Logopedics Phoniatrics
Vocology , vol. 29, no. 3, pp. 135-144, 2004.
[29] M. Eldridge, E. Saltzman and A. Lahav, "Seeing what you hear: Visual feedback improves pitch recognition", Informa UK Limited, European Journal of Cognitive Psychology , vol. 22, no. 7, pp. 1078-1091, 2010.
[30] J. Burkem, M. Prewett, A. Gray, L. Yang, F. Stilson, M. Coovert, L. Elliot and E. Redden, “ Comparing the effects of visual-auditory and visual-tactile feedback on user performance: A meta-analysis”, 8th International Conference on Multimodal Interfaces, pp 108-117, 2006.
[31] A. Brandmeyer, R. Timmers, M. Sadakata and P. Desain, "Learning expressive percussion
performance under different visual feedback conditions", Springer Nature, Psychological Research , vol. 75, no. 2, pp. 107-121, 2010.
[32] B. Moens, L. van Noorden, and M. Leman, “D-jogger: Syncing music with walking.”, Universidad
Appendix
User Test Instructions
Instructions:
1.
Set the BPM tracker to 120 BPM.
2.
Try and match the beat for 8 beats.
3.
Press ‘Results’.
4.
Repeat 2 more times.
5.
Repeat previous steps with 80 BPM.
Raw Data Charts
120 BPM No Visual Feedback
NoVF 120 BPM
Beat
No. 1 2 3 4 5 6 7 8
1 0 10 -38 19 7 17 15 -8
User 1 2 0 36 1 -19 50 8 6 12
3 0 11 2 12 3 19 30 -16
1 0 8 11 -1 -1 -18 -3 25
User 2 2 0 -5 14 21 5 2 -30 -10
3 0 -22 13 29 -30 -3 2 5
1 0 0 27 -18 1 11 -1 11
User 3 2 0 52 -24 52 36 4 -12 22
3 0 48 -21 -41 1 11 2 3
1 0 110 25 25 22 21 21 0
User 4 2 0 50 0 82 2 61 57 27
3 0 42 31 40 31 10 21 39
1 0 31 0 12 4 31 4 13
User 5 2 0 27 -28 -49 25 29 12 21
3 0 20 4 -19 10 20 20 6
1 0 6 -8 4 3 -8 -20 -40
User 6 2 0 23 1 -19 -7 0 -5 3
3 0 -23 29 -12 15 24 -48 18
1 0 34 3 48 1 5 29 31
User 7 2 0 127 11 3 37 2 38 20
3 0 31 16 2 42 2 10 7
1 0 -11 21 41 31 11 32 40
User 8 2 0 0 -21 31 10 0 21 41
3 0 -25 20 52 5 3 15 20
1 0 -71 11 42 10 -1 -9 31
User 9 2 0 21 -11 -17 9 20 -30 31
1 0 0 -93 -60 -20 9 3 0
User 10 2 0 30 21 30 31 12 -31 0
3 0 62 29 12 -32 -8 21 0
1 0 72 8 52 9 4 -41 11
User 11 2 0 14 47 -24 32 -8 9 3
3 0 19 21 9 11 34 -42 -49
1 0 -17 10 19 -3 -3 3 14
User 12 2 0 -4 -2 -23 6 -18 58 1
3 0 -15 -5 -20 -3 9 48 14
1 0 104 10 20 -13 35 9 -30
User 13 2 0 2 -72 11 19 52 -51 72
3 0 94 0 18 -61 53 -51 72
1 0 41 20 1 0 12 -1 10
User 14 2 0 32 11 -1 2 -9 9 39
3 0 0 22 0 32 30 -22 43
1 0 20 0 3 -1 10 10 40
User 15 2 0 22 9 24 -23 -19 11 29
3 0 -2 22 3 -2 -9 31 18
1 0 -21 -9 -19 -19 11 -1 -1
User 16 2 0 -9 21 1 41 -1 -29 21
3 0 10 20 13 -52 22 -4 32
1 0 30 10 22 23 8 -61 28
User 17 2 0 0 -1 11 -17 8 -22 22
3 0 1 2 12 15 -7 20 25
1 0 0 31 -22 -39 82 -50 -32
User 18 2 0 31 0 30 0 11 -9 -1
3 0 30 -11 -21 53 21 -40 9
1 0 73 19 32 -10 10 32 53
User 19 2 0 72 51 10 0 -31 21 1
3 0 52 27 35 -22 -29 0 1
1 0 20 1 30 21 43 30 31
User 20 2 0 62 20 22 -10 1 1 19
120 BPM Visual Feedback
VF 120BPM Beat No. 1 2 3 4 5 6 7 8
1 0 65 -38 7 -9 3 -17 15
User 1 2 0 -12 26 19 -13 -35 -4 -15
3 0 17 -9 46 -29 39 -81 22
1 0 52 62 74 8 -2 -11 74
User 2 2 0 32 -8 -14 -9 46 9 32
3 0 5 -27 45 38 -38 0 3
1 0 24 -17 4 15 -17 29 -66
User 3 2 0 -48 6 10 -19 8 12 -25
3 0 -67 15 7 25 31 -33 -23
1 0 52 8 13 13 18 10 28
User 4 2 0 43 10 50 53 33 42 24
3 0 116 30 30 17 34 1 1
1 0 -46 10 22 25 14 -37 2
User 5 2 0 55 1 -25 1 5 5 -22
3 0 3 -31 -46 36 11 9 2
1 0 56 -1 28 -1 59 -20 2
User 6 2 0 -47 7 20 0 3 -10 20
3 0 11 0 -14 49 19 28 25
1 0 43 9 7 12 6 29 25
User 7 2 0 3 12 11 5 13 1 20
3 0 20 25 23 58 8 9 27
1 0 -3 -20 11 -1 10 20 2
User 8 2 0 -21 11 29 41 11 40 0
3 0 8 20 52 -1 -61 -30 23
1 0 -21 -20 -10 21 -11 -38 51
User 9 2 0 10 -21 11 -10 40 -19 53
3 0 24 -21 -20 52 0 35 0
1 0 30 51 62 -71 -49 11 39
User 10 2 0 8 70 43 -90 11 -10 31
1 0 81 -31 20 2 1 -1 1
User 11 2 0 31 -11 11 -19 11 -24 0
3 0 52 -1 40 -19 33 -21 -12
1 0 69 -17 18 -9 22 0 11
User 12 2 0 56 15 1 -12 31 34 20
3 0 81 0 19 23 21 -22 1
1 0 10 -8 10 -8 8 -10 52
User 13 2 0 11 53 51 31 22 -31 42
3 0 42 -3 35 22 61 -22 -48
1 0 50 0 22 -30 0 -11 20
User 14 2 0 0 0 31 -40 51 -22 42
3 0 -1 -11 23 1 -22 -1 22
1 0 23 10 11 17 -7 39 21
User 15 2 0 10 31 1 19 11 29 0
3 0 -29 0 -30 9 -9 10 29
1 0 -23 -1 14 -11 0 11 0
User 16 2 0 -30 31 0 -11 -8 17 72
3 0 21 -9 0 0 -10 31 0
1 0 21 30 21 28 83 53 0
User 17 2 0 81 10 63 -10 30 -11 -71
3 0 71 40 -13 47 30 -1 12
1 0 152 143 0 22 -1 -20 31
User 18 2 0 -32 11 31 0 31 -60 31
3 0 50 1 9 -59 30 -20 -9
1 0 0 102 13 61 10 73 123
User 19 2 0 87 72 32 -11 -21 -7 10
3 0 72 47 -7 -13 13 -39 21
1 0 48 -20 32 9 -9 10 21
User 20 2 0 18 32 12 49 11 11 -10
80 BPM No Visual Feedback
No VF 80BPM Beat No. 1 2 3 4 5 6 7 8
1 0 33 -115 105 -42 -15 -7 32
User 1 2 0 6 -9 -29 20 -45 112 -46
3 0 17 28 -36 -13 -3 15 28
1 0 -33 23 -38 -4 51 -54 28
User 2 2 0 -34 36 17 2 22 35 -21
3 0 -50 33 42 -26 32 29 -14
1 0 262 271 208 250 262 250 248
User 3 2 0 76 -25 36 -47 18 1 3
3 0 6 -7 18 -45 37 3 5
1 0 137 6 6 8 9 4 15
User 4 2 0 126 27 25 16 46 36 5
3 0 108 17 47 19 19 34 158
1 0 259 253 271 228 243 269 210
User 5 2 0 12 -52 5 -46 -22 42 24
3 0 -29 14 -20 14 -16 -50 -46
1 0 7 11 47 -47 -8 70 -50
User 6 2 0 91 -22 -27 -59 -18 67 33
3 0 14 -43 91 26 -96 -30 -9
1 0 14 4 22 50 31 2 3
User 7 2 0 27 15 9 27 17 44 8
3 0 10 20 13 4 6 4 41
1 0 303 289 241 259 261 282 261
User 8 2 0 39 14 -46 6 -5 6 27
3 0 20 10 -30 2 -10 -5 20
1 0 -1 27 4 -11 85 -17 18
User 9 2 0 50 -34 -28 -4 39 -7 8
3 0 70 -35 -6 26 -2 34 -2
1 0 26 99 75 28 -25 -15 22
User 10 2 0 189 -27 -13 -13 15 -5 16
1 0 -34 78 -5 93 -62 -4 36
User 11 2 0 36 67 -25 -47 16 -5 -14
3 0 108 -77 16 -45 87 -46 -14
1 0 -133 23 -23 -22 5 6 29
User 12 2 0 -8 4 14 6 23 -7 13
3 0 242 -10 46 -4 19 38 -67
1 0 0 211 158 97 18 -6 -24
User 13 2 0 106 62 52 -108 -14 -25 38
3 0 96 44 29 36 -54 37 0
1 0 25 77 -56 5 16 -16 -14
User 14 2 0 105 -13 -47 3 -2 26 -25
3 0 35 -27 8 16 -4 -5 -6
1 0 16 -16 17 34 6 -17 19
User 15 2 0 36 55 6 -6 7 34 -13
3 0 45 25 8 5 -24 -9 8
1 0 -47 -4 -55 46 -37 49 -25
User 16 2 0 -87 88 96 -45 -42 -58 65
3 0 16 9 21 16 -45 -5 37
1 0 -16 39 -36 -33 45 -4 56
User 17 2 0 112 -4 -25 35 6 -15 5
3 0 50 -4 -50 25 4 15 10
1 0 14 -5 -44 -26 25 -15 77
User 18 2 0 56 86 -4 -56 -45 36 25
3 0 96 -97 17 -37 36 5 -25
1 0 104 -21 14 -3 15 25 -16
User 19 2 0 38 13 18 23 -14 6 -6
3 0 62 83 16 -28 -13 -5 6
1 0 35 -25 -25 -5 37 -4 25
User 20 2 0 -27 -14 -15 -25 -24 56 15