Phase-Field Modeling of Phase Transformations
in Platinum-Based Alloy Nanoparticles
Shunsuke Yamakawa
1,2,+, Ryoji Asahi
1and Toshiyuki Koyama
21Toyota Central R&D Labs, Inc., Nagakute 480-1192, Japan
2Department of Materials Science and Engineering, Nagoya Institute of Technology, Nagoya 466-8555, Japan
A phase-field model that describes the phase decomposition and phase transformations inside platinum-based alloy nanoparticles is developed to elucidate the effects of particle size, alloy composition, and heat-treatment temperature on the microstructure formation. FePt, CoPt, NiPt, CuPt and IrPt binary alloy nanoparticles with diameters of less than 10 nm are investigated. The calculation results clearly show that surface segregation and atomic ordering are sensitive to the alloy components and particle size, and that the equilibrium nanostructure obtained varies according to the balance between the surface energy and chemical interaction between atomic components. Platinum-based alloy nanoparticles are expected tofind applications as electrocatalysts in polymer electrolyte fuel cells. Thus, the proposed phase-field approach demonstrates its usefulness for the control of the radial distributions of each alloying component within a nanoparticle, leading to improvements in the activity and durability of the catalyst and reducing the required amount of platinum loading. [doi:10.2320/matertrans.ME201304]
(Received January 7, 2013; Accepted April 30, 2013; Published June 7, 2013)
Keywords: phase transformation, phase-field model, catalyst, platinum, nanoparticle
1. Introduction
For many years, intensive effort has been focused on developing platinum-based alloy nanoparticles for applica-tions as electrocatalysts in polymer electrolyte fuel cells.1)
The alloying technique is expected to improve the oxygen reduction reaction in the cathode layers of fuel cells and reduce the required amount of platinum loading through the replacement of some platinum with less expensive metals. During the nanoparticle fabrication process, a compositional difference between the bulk and surface of an alloy may be induced by differences in the surface energies of the alloying elements and changes in the interaction energies between them. This compositional difference is known as surface segregation,2) and it influences the catalytic activities of alloys.3)On the other hand, the diameter of the current pure platinum catalyst is less than approximately 10 nm so as to ensure that it provides an extensive surface area for the electrochemical reaction.4)On the scale of a few nanometers, the influence of the surface energy on the thermodynamic equilibrium is inversely proportional to the particle size; this tendency causes degradation because of Ostwald ripening.4)
Therefore, the particle size is also expected to affect the surface segregation. To overcome these obstacles for the design and fabrication of a binary alloy nanoparticle, we believe that it is necessary to understand the fundamental effects of particle size, alloy composition, and heat-treatment temperature on the microstructure formation.
Computational modeling studies are useful for elucidating driving forces and predicting resultant surface structures. Thus far, various methodologies have been proposed for the investigation of the surface structure of platinum-based binary alloys, such as those based on the thermodynamic model,5)the Monte Carlo simulation model with
embedded-atom method (EAM) potential,614) and first-principles
methods.15) We think that a thermodynamic method based
on the knowledge of the thermodynamic parameters of the bulk, rather than those observed on the nanoscale, is useful for understanding the general trend in surface segregation that is common to a number of alloy systems. The previously proposed thermodynamic method estimated the surface atom fraction on the basis of pure element vaporization enthalpies and alloy solution activity coefficients.5) The alloy
particle-size dependence of the surface composition has also been discussed. However, the combined influences of the particle size and phase transformations on the degree of surface segregation were not well described.
The phase-field method16) has recently attracted more
attention as a numerical simulation method for the prediction of nanoscale phenomena. This method was applied to investigate the size dependence of the ordering of FePt nanoparticles;17,18) the results clearly showed that the disordered phase induced by the FePt particle surface becomes dominant as the particle size decreases. On the other hand, the phase-field model simulating the temporal evolution of the platinum density profile successfully represented the formation process of platinum nanoparticles on a carbon substrate.19) These application results thus
legitimate the phase-field model used to discuss the thermodynamic equilibrium in the case of a high surface-area-to-volume ratio. In the present study, we concentrate on achieving the description of the surface segregation in consideration of the phase transformations of the internal particles. Recent methodological progress in the phase-field technique has enabled simultaneous evaluation of the conservative temporal evolution of the atomic concentration and the nonconservative temporal evolution of the phase transformation through solution of the CahnHilliard20)and
AllenCahn21)equations, respectively.
The outline of this paper is as follows: In Sec. 2, formulations and implementations of the simulation method are described. The temporal evolution is calculated using the CahnHilliard and AllenCahn equations on the basis of the free-energy function associated with surface energy and
+Corresponding author, E-mail: e1044@mosk.tytlabs.co.jp
Special Issue on New Functions and Properties of Engineering Materials Created by Designing and Processing II
internal energy including the effects of phase transformations. In Sec. 3, the results of practical applications are explained. First, to verify the accuracy of this simulation, we compare this model with experimental and other simulation results for the phase transformations in FePt nanoparticles. Next, the effects of the alloying elements on the equilibrium microstructures of FePt, CoPt, NiPt, CuPt and IrPt binary alloy nanoparticles with diameters of less than 10 nm are investigated. Unfortunately, since the radial distribution of alloy components has not yet been fully investigated experimentally, it is difficult to evaluate the accuracy of our model in this regard. On the other hand, theoretical prediction of the microstructure formation of the nanoparticle has been made by using Monte Carlo simulations. Therefore, the validity of our simulation results is discussed mainly through comparisons with previously reported atomistic simulation results. The conclusions are given in Sec. 4.
2. Calculation Methods
2.1 Formulation
We introduced three types offield variables related to the atomic concentration, c, long-range crystallographic order-ing, s, and phase transition, ª, between solid and liquid. A condensed-matter phase is distinguished from a surrounding vapor phase by the vacancy concentration. The temporal evolutions of the radial distributions of each atomic concentration within a nanoparticle are calculated by using the ternary CahnHilliard equation,22,23) as expressed in the
following conservative form:
@ci
@t ¼ r Miir ¤Gsys
¤ci
Mijr ¤G¤ sys cj
;
i¼Pt;TM;j¼Pt;TM;i6¼j; ð1Þ
cPtþcTMþcVa¼1; ð2Þ
whereciis the local atomic concentration of componentias a
function of the radial coordinate, r, and the time variable,t, and its value is normalized with respect to the maximum concentration so that it is a dimensionless value between 0 and 1; the subscripts TM and Va indicate the transition-metal element alloyed with platinum and the vacancy, respectively; and Mii is the mobility of componenti due to the gradient
of the functional derivative of Gsys with respect to the
concentration of componenti.Mii and Mij are expressed as Mii¼cið1ciÞD=RT and Mij ¼cicjD=RT, respectively,
when all species have the same diffusion coefficient, D.23)
Here,RandTare the gas constant and absolute temperature, respectively.
The equilibrium radial distributions of the ordered disordered phase and the solidliquid phase within a nano-particle were calculated using the AllenCahn equation,21)
expressed in the following nonconservative form:
@s @t¼ Ls
¤Gsys
¤s ; ð3Þ
@ª @t ¼ Lª
¤Gsys
¤ª ; ð4Þ
wheresis defined as the long-range order (LRO) parameter so that s values of 0 and 1 correspond to disordered and ordered phases, respectively; ª is defined as the phase-field
parameter so thatªvalues of 0 and 1 correspond to liquid and solid phases, respectively; andLsandLª denote the mobility of the ordereddisordered and solidliquid phase interfaces, respectively. As a consequence of temporal evolution, quasi-stationary microstructures corresponding to the minimum free energy are obtained.
We defined Gsys as the volume integral of the local
chemical free energy and the gradient energy term over the entire volume,V, as follows:
Gsys¼ 1 V
Z
hðªÞGðchemSÞ þ ½1hðªÞGðchemLÞ
þ¬PtTM 2 ½ðrcPtÞ
2þ ðrc TMÞ2
þ¬Va 2 ðrcVaÞ
2þhðc
Pt+TMެs 2 jrsj
2
þWªð1ªÞ þ¬ª 2 ðrªÞ
2
dV; ð5Þ
hðxÞ ¼x3ð6x215xþ10Þ; x¼ª; cPt+TM; ð6Þ
cPt+TM¼cPtþcTM; ð7Þ
where Wis the energy barrier for the solidliquid transition
and  is the gradient energy coefficient. The particle-size dependence is naturally taken into account through the atomic-concentration derivative of the gradient energy term of the phase-field model. Here, we defineWand» as given in the following equations:
W¼ cPt
cPt+TMWPtþ cTM
cPt+TMWTM; ð8Þ
¬ª ¼ cPt
cPt+TM¬ª Ptþ cTM
cPt+TM¬ª TM: ð9Þ
Because the spatial derivative terms multiplied by¬PtTMare
not zero when the spatial derivative term multiplied by¬V ais not zero, ¬Va is represented by subtracting ¬PtTM from a
linear combination of¬Ptand¬TM, as given in the following
derivation:
1 2
cPt cPt+TM¬Ptþ
cTM cPt+TM¬TM
ðrcVaÞ2
¬PtTM
2 ðrcPt+TMÞ 2
¼1
2 cPt cPt+TM¬Ptþ
cTM cPt+TM¬TM
ðrcVaÞ2
¬PtTM
2 ðrcVaÞ
2
¼1
2 cPt cPt+TM¬Ptþ
cTM
cPt+TM¬TM¬PtTM
ðrcVaÞ2
¼1
2¬VaðrcVaÞ
2; ð10Þ
with
¬i¼hðªÞ¬ðiSÞþ ½1hðªÞ¬ðiLÞ; i= Pt, TM; ð11Þ
where ¬ðiSÞ and ¬ðiLÞ are the gradient energy coefficients of the solidvapor and liquidvapor interfaces, respectively, of atomic elementi.
GðchemSÞ ¼cPtGðPtSÞþcTMGTMðSÞ þLPtðSÞVacPtcVa
þLðTMSÞVacTMcVaþLðPtSÞTMcPtcTMþGðPtordÞTM
þRTðcPtlncPtþcTMlncTMþcValncVaÞ; ð12Þ GðchemLÞ ¼cPtGðPtLÞþcTMGTMðLÞ þLPtðLÞVacPtcVa
þLðTMLÞVacTMcVaþLðPtLÞTMcPtcTM
þRTðcPtlncPtþcTMlncTMþcValncVaÞ; ð13Þ
where the superscripts (S) and (L) indicate the solid and liquid phases, respectively; andGðjÞi is the Gibbs formation energy of pure elementiin phasejfrom the SGTE (Scientific Group Thermodata Europe) data.24) When we apply these
formulations to a pure material, eqs. (12) and (13) result in similar expressions to those reported in Ref. 25), which were applied to the sintering of two spherical pure-element particles. The energy difference between the ordered and disordered phases,GðPtordÞTM, is defined by the site fraction of
componention sublattice j,yðjÞi .2629)To reduce the number
of field variables, we adopted a three-component LRO parameter,S,30)which is defined as follows:
S¼ s1 s2 s3 0 B @ 1 C
A¼1
2
s1 Pts1 TM s2 Pts2 TM s3 Pts3 TM 0
B @
1 C
A; ð14Þ
with
Si¼
s1 i s2 i s3 i
0 B @
1 C
A¼1
2
yði1Þþyði2Þyði3Þyði4Þ yði1Þyði2Þyði3Þþyði4Þ yði1Þyði2Þþyði3Þyði4Þ 0 B @ 1 C A;
i¼Pt;TM: ð15Þ
Here, the yðjÞi values are obtained uniquely by using Si and
ci values. The parameter S (s1, s2, s3) takes the values of
(«1, 0, 0), (0, «1, 0) and (0, 0,«1) for complete L10and
L11.LðjÞiVais a pair-wise interaction parameter between alloy
elementiand a vacancy, and is defined as follows:
LðjÞiVa¼HfðjÞiTSf; j= S, L; ð16Þ
whereHfðjÞiandSfare the enthalpy and entropy of
mono-vacancy formation, respectively. LðPtSÞTM and LðPtLÞTM are provided as polynomial equations with respect to the atomic concentrations based on the thermodynamic assessments of the FePt,26)CoPt,27)NiPt,28)CuPt29)and IrPt31)binary
systems using the CALPHAD (calculation of phase dia-grams) method. The examined binary systems, with the exception of IrPt, have the ordered phase in the temper-atureconcentration phase diagram for the bulk material. Therefore, LðPtSÞTM and LðPtLÞTM are negative values. On the other hand, the IrPt phase diagram contains a miscibility gap, andLðPtSÞIr is a positive value. In addition, there may be an argument that the volume in one nanoparticle is too small for a discussion of the macroscopic thermodynamic equi-librium state. We believe that these calculation results using the CALPHAD data could be treated as an average state corresponding to a long timescale, or ensemble averages of two or more particles with the same particle diameter.
2.2 Physical constants and parameters
The surface energy of the condensed-mattervapor inter-face corresponds to a summation of the excess free energy in the diffusive transition region from very low to very high
vacancy concentration, which depends on the alloy compo-nents. In the case of the condensed-mattervapor interface with a one-dimensional gradient, the following relationship32)
exists between the surface energy,£ðjÞi , interfacial thickness,
dðjÞi and gradient energy coefficient,¬ðjÞi :
£ðjÞi ¼
ffiffiffiffiffiffiffi
¬ðjÞi
q
VmðjÞi Zcc1
cv0
ffiffiffiffiffiffiffiffiffiffiffiffiffiffiffiffi 2GðcÞ p
dc; ð17Þ
dðjÞi ¼ ðcccvÞ
ffiffiffiffiffiffiffiffiffiffiffiffiffiffiffiffiffiffiffiffiffiffiffiffiffiffiffiffiffi
¬ðjÞi 2Gðc¼0:5Þ s
; ð18Þ
where the subscript iindicates the alloy component (Pt, Fe, Co, Ni, Cu, or Ir);ccandcvare the atomic concentrations of
the condensed and vapor phases, respectively; Vm iðjÞ is the molar volume; andGis the free-energy change across the interface, which correlates with LðjÞiVa. In our calculations,
LiðSÞVa and ¬iðSÞ were determined to reproduce the £ðiSÞ and
dðiSÞ values. ThedðiSÞ value for the solid phase was set at
3.0©10¹10m by adjusting the mono-vacancy formation
energy, HfðSiÞ, which led to a change in the LðiSÞVa values.
Here, we employed the values obtained for the solid surface energy,£ðSÞi , of the (111) surfaces of Pt, Fe and Co fromfi rst-principles calculations,33)and of Ni, Cu and Ir evaluated from embedded-atom calculations.34)Since there is a discrepancy between the Pt surface energies in Refs. 33) and 34), the values in Ref. 34) were scaled tofit the Pt value in Ref. 34) to the Pt value in Ref. 33). Table 1 shows the surface energy including the temperature correction. The temperature correction was made by using the following equation:35)
£ðSÞ
i ðTÞ ¼£ðiSÞð0Þ RT =A; ð19Þ
where A is the surface area per mole of surface atoms, as defined in the following equation:35)
A¼1:612N1=3V2=3; ð20Þ
where Nis Avogadro’s number and Vis the molar volume. The liquid surface energy, £ðiLÞ, was estimated from
£ðLÞ
i ¼£ðiSÞ=1:18.35) For representation of the differences in
the bond strengths in solids and liquids,HfðLiÞwas assumed
to be expressed as a relative value ofHfðSiÞ, as defined by the
following equation:
HfðLiÞ ¼
Hvi
Hm iþHviH
ðSÞ
f i; ð21Þ
where Hmi is the heat of fusion and Hvi is the heat
of vaporization. The surface energy is considered to be associated with Hf=A, so £iðSÞ=£ðiLÞ is rewritten as
ðHfðSiÞ=HfðLiÞÞ ðAðLÞ=AðSÞÞ. In the case of platinum, Hf PtðSÞ =Hf PtðLÞ is about 1.04 (from eq. (21)), and AðLÞ=AðSÞ is about 1.07 (from eq. (20)). Therefore, ðHf PtðSÞ =Hf PtðLÞ Þ ðAðLÞ=AðSÞÞ is about 1.11. The derived
value is approximately equal to the abovementioned value of 1.18. Therefore, we consider that the assumption of eq. (21) has a physical meaning. ¬ðiLÞ was determined to reproduce the £ðiLÞ and HfðLiÞ values. The ¦Sf value in eq. (16)
approximately adopted a formulation of 1.32R, which was originally used for platinum.36)The estimatedHðSÞ
agreement with the experimental values.3739) In the case of the solidliquid interface, the interfacial energy barrier, Wi,
and » i values were determined by introducing the values
obtained for £ðiSLÞð¼£iðSÞ£ðiLÞÞ and the width of the solidliquid interface diðSLÞ (which was assumed to be approximately equal to that of the solidvapor interface) into the following equations:
£ðSLÞ
i ¼
ffiffiffiffiffiffiffi
» i
p Z1 0
ffiffiffiffiffiffiffiffi 2Wi
p
ViðSLÞdª; ð22Þ
diðSLÞ¼
ffiffiffiffiffiffiffiffiffi
» i 2Wi
r
; ð23Þ
whereViðSLÞ is introduced as
ViðSLÞ¼hðªÞViðSÞþ ½1hðªÞViðLÞ: ð24Þ
Equation (18) is modified slightly to the following expres-sion21) for the estimation of the ¬s value for the ordered disordered phase interface:
x¼2
ffiffiffiffiffiffiffiffiffiffiffiffiffiffiffiffiffiffiffiffiffiffiffiffiffi¬s
2Gðs¼0Þ
r
; ð25Þ
wherexis the width of the anti-phase boundary (APB), and
Gðs¼0Þ corresponds to the absolute value of GðPtordÞTM.
For the reproduction of the experimental results shown in Fig. 1, a x value of 1.0©10¹9m was used, which was
close to the experimentally observed value of approximately 1.38©10¹9m for FePt.40) The values of ¬s at 973.15 K were 1.63©10¹15J·m2/mol for FePt (L10), 0.160©
10¹15J·m2/mol for CoPt (L10), and 0.137©10¹15J·m2/mol
for CuPt (L11). The L10 phase of NiPt is unstable at
973.15 K. The¬PtTMvalue has a meaning for binary systems
with a miscibility gap, such as IrPt. ¬PtTM for the IrPt
binary system in the solid phase was determined to be 1.66©10¹15J·m2/mol by assuming a value of 1©10¹9m
for the widthdand using theGvalue estimated from the CALPHAD data. The ¬PtTM values for the other binary systems examined in the present computational study were
defined as having a negative sign according to eq. (17). However, a negative ¬PtTM value may induce instability during the numerical simulation. We have confirmed that when ¬PtTMis set to a positive value of the order of about 10¹17, such instability is avoided, and the value has a minor
effect on the final concentration profile. In this study, the
¬PtTMvalues for the FePt, CoPt, NiPt and CuPt systems
were set at 5©10¹17J·m2/mol.
2.3 Numerical calculation
The numerical calculation of the one-dimensional problem along the radial direction of a nanoparticle was performed by using the finite volume method with the explicit Euler method. In the present calculation, the isotropic surface energy of a nanoparticle was assumed. The simulation was executed mainly at a temperature of 973.15 K. The initial grid spacing was 0.005 nm. Changes in the local molar volume depending on the changes in atomic concentrations and phase transformations were taken into account to ensure mass
[image:4.595.49.549.84.296.2]Fig. 1 Comparison of particle-size dependences of the L10 ordering of FePt particles with experimental results.
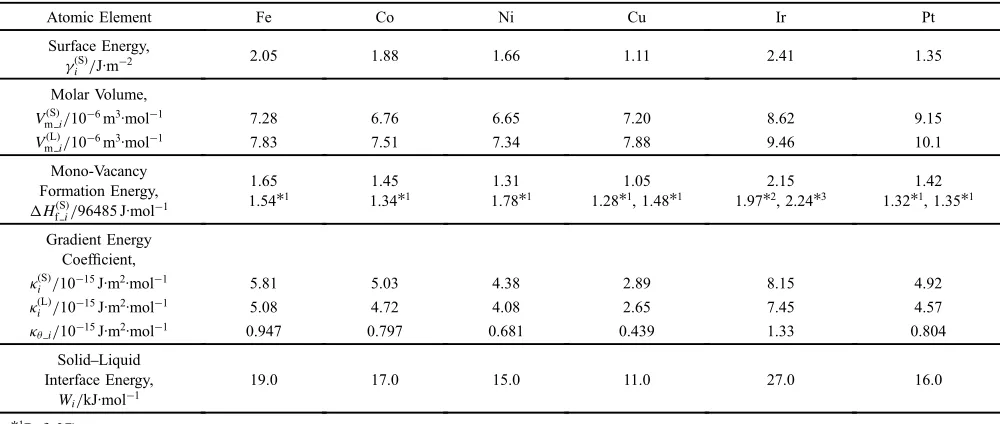
Table 1 Estimated parameters for alloy elements at 973.15 K.
Atomic Element Fe Co Ni Cu Ir Pt
Surface Energy, £ðSÞ
i /J·m¹2
2.05 1.88 1.66 1.11 2.41 1.35
Molar Volume,
VmðSÞi/10¹6m3·mol¹1 7.28 6.76 6.65 7.20 8.62 9.15
VmðLÞi/10¹6m3·mol¹1 7.83 7.51 7.34 7.88 9.46 10.1
Mono-Vacancy Formation Energy, HðSÞfi/96485 J·mol¹1
1.65 1.54*1
1.45 1.34*1
1.31 1.78*1
1.05 1.28*1, 1.48*1
2.15 1.97*2, 2.24*3
1.42 1.32*1, 1.35*1
Gradient Energy Coefficient, ¬ðSÞ
i /10¹15J·m2·mol¹1 5.81 5.03 4.38 2.89 8.15 4.92
¬ðLÞ
i /10¹15J·m2·mol¹1 5.08 4.72 4.08 2.65 7.45 4.57
¬ªi/10¹15J·m2·mol¹1 0.947 0.797 0.681 0.439 1.33 0.804
SolidLiquid Interface Energy,
Wi/kJ·mol¹1
19.0 17.0 15.0 11.0 27.0 16.0
*1Ref. 37).
*2Ref. 38).
[image:4.595.324.527.341.504.2]conservation. Therefore, the grid spacing at each grid point was updated for each time step. The initial simulation size,l, was defined as the particle radius plus 0.75 nm. The boundary conditions at r=0 and r=l were chosen such that the spatial derivatives of the field variables were zero. In the external region of the particle, only vaporized atomic elements were present, i.e., it was an inert atmosphere. The initial concentration of platinum was equal to that of the alloying element combined with platinum, the initialªvalue was equal to thecPtþTMvalue, the initialsvalues in eq. (14)
were set as ðs1 Pt; s2 Pt; s3 PtÞ ¼ ðcPtþTM;0;0Þ, and STM¼
SPt was assumed for all positions. The variable s1 is
denoted as the variable s in Sec. 3 as the representative variable for estimating the degree of L10or L11ordering. In
this simulation study, we focused on obtaining the steady-state microstructure. Therefore, the simulated time step was varied according to theflux of atomic concentration in order to reduce the simulation time. The mobility values ofLsand Lª in eqs. (3) and (4) were set to be larger than the atomic concentration change so that the rate of atomic diffusion was not limited by the mobility of the solidliquid and ordered disordered phase interfaces.
3. Results and Discussion
3.1 Phase transformations
To verify the accuracy of this phase-field model, we compared it with experimental and other simulation results. Figure 1 shows the experimentally observed particle-size dependence of the L10 ordering in FePt particles that were
fabricated or annealed at 973.15 K.4143) The degree of L1 0
ordering decreased as the particle size decreased. When the APB width was assumed to be 1.0 nm, in accordance with the experimental results described in Sec. 2.2, the calculated s
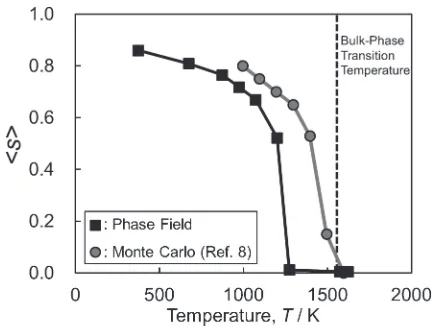
values were in good agreement with the experimental results. This implies that the present phase-field model is sufficiently accurate to describe the orderdisorder phase transition within a nanoparticle. Figure 2 shows the temperature dependence of the L10 ordering of FePt particles with
diameters of 4 nm. The orderdisorder phase-transition temperature decreased as the particle size decreased. This
figure also shows previously reported results from Monte Carlo simulations.8) At first glance, the present model
reproduces the general trend of the temperature dependence seen from the Monte Carlo simulations, although the simulated phase-transition temperature is slightly below that obtained from the Monte Carlo simulations. In the present simulation, the ordereddisordered phase interface has a
finite width inside a particle. Therefore, the disordered phase is dominant at the particle surface. On the other hand, it is well known that the surface state from the Monte Carlo simulation result is affected significantly by the adopted surface potential.9) Therefore, we cannot find conclusive evidence to clarify which results are more accurate.
Another important feature is the particle-size dependence of the solidliquid transition temperature. Figure 3 shows the equilibrium phase of the FePt nanoparticle versus the holding temperature and the particle size. When the particle diameter is on the nanometer scale, the influence of the surface tension of the particle on its chemical potential is significant. The
difference in surface tension between the solid and liquid phases also leads to a difference in the equilibrium vapor pressures of those phases. Generally, the surface tension of the liquid phase is smaller than that of the solid phase, and the liquid phase is formed at a temperature lower than the melting point of the bulk to decrease the free energy. Furthermore, at temperatures higher than the complete melting temperature of the nanoparticles, it is known that a kind of coreshell structure is formed in the particle through melting only of the particle surface, which is known as surface pre-melting.44) In this figure, the open dots denote
completely melted particles and filled dots denote partially melted particles. The simulated transition temperature of the solidliquid phases corresponds to the interface of these dots. The temperature dependence was more remarkable in particles of less than 10 nm in diameter. Figure 3 also shows the theoretical prediction from Pawlow’s model, which yields the following equation:45)
Tm¼TmBulk 1 2·svs
Hmrs 1
·l
·s vl vs
2=3
" #
( )
: ð26Þ
In this formula, the relationship between the melting temperature, Tm, and the particle radius, rs, is estimated on Fig. 2 Comparison of temperature dependences of the L10ordering of FePt particles with Monte Carlo simulation results. The particle diameter is 4 nm.
[image:5.595.318.536.68.231.2] [image:5.595.319.533.293.453.2]the basis of the equilibrium between solid and liquid particles. Each parameter in eq. (26) is defined as the mean of the physical constants of Pt and Fe:TBulk
m is 1926.6 K; the
molar heat of fusion, Hm, is 16.4 kJ/mol; the molar
volumes of the solid, vs and liquid, vl, are 8.10©10¹6and
8.97©10¹6m3/mol, respectively; and the surface tensions of the solid, ·s, and liquid, ·l, are 1.85 and 1.57 J/m,
respectively. The simulated phase boundary between the solid and liquid phases was slightly below that obtained with Pawlow’s model. It was postulated that this subtle but meaningful difference was due to surface pre-melting.46)The
surface layers of the FePt particles were partially in the liquid phase, as described in the next section. This layer is expected
to induce the more significant melting-temperature depend-ence on the particle size, as shown in Fig. 3.
3.2 Surface segregation
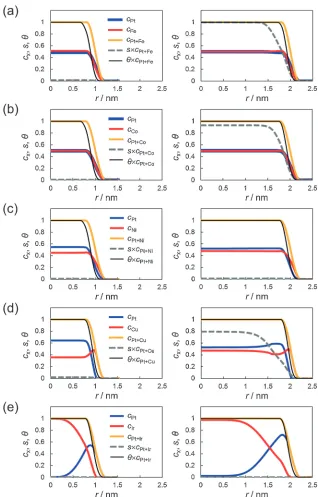
Figure 4 shows the radial distribution of the atomic concentrations (cPt, cTM and cPtþTM values), ordered
disordered phase (scPtþTM value), and solidliquid phase
(ªcPtþTM value) of nanoparticles with diameters of 2 and
4 nm at 973.15 K. The region in which the value of cPtþTM
changes from 0 to 1 corresponds to the particle surface. The change of the black line corresponding to the fraction of solid phase from 0 to 1 inside the particle implies that surface pre-melting occurs. The atomic concentrations of the alloy
[image:6.595.138.456.66.563.2]elements were also determined. In the CuPt and IrPt particles, there was remarkable concentration decomposition, espe-cially in the 2-nm particles. Enriched alloy element concentrations on the particle surface resulted in reduced concentrations of these elements inside the particles, as the total mass was conserved. In contrast, the FePt and CoPt particles showed no significant concentration decomposition. Figure 4 also shows that at the same temperature, the stable phase inside the particle changed from an ordered phase to a disordered phase as the particle size decreased.
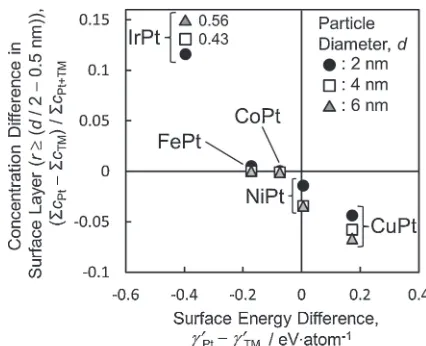
To understand this, we plotted the surface segregation against the surface energy difference, as shown in Fig. 5.£0Pt and £0TM are defined as £Pt and £TM multiplied by surface areas per atom of their (111) crystal planes, respectively. The alloy element with the lower surface energy had a tendency to segregate near the surface. However, the attractive interaction energy between platinum and the alloyed transition metal may have helped to prevent the alloy from decomposing. In the case of FePt and CoPt particles, the strong attractive interaction energy between Fe and Pt overcame the surface energy differences. Monte Carlo simulations with the cluster expansion fitted to ab initio data9) indicated that FePt
exhibited no significant segregation, and an increase in the Pt concentration in the outermost layer was compensated by a decrease in the concentration in the second layer. Our results were consistent with those of this previously reported simulation. In contrast, for Pt alloys with Cu and Ir, which had weak attractive and strong repulsive interaction energies with Pt, respectively, the surface energy differences led to significant surface segregation. In these cases, the surface segregation and atomic ordering were also sensitive to the particle size. In IrPt nanoparticles, Pt enrichment was obtained at the particle surface. Our results were probably consistent with those of the Monte Carlo simulation employing the EAM potential,13) which simulated the Pt
segregation on theflat (100) and (111) surfaces of the IrPt alloy. In CuPt nanoparticles, both the energetic tight-binding Ising model (TBIM)47)and Monte Carlo simulation
employ-ing the modified embedded-atom method (MEAM)12)
predicted Cu enrichment of the (100) and (110) surfaces caused by the low surface energy of Cu. For the (111) surface, the Monte Carlo model with MEAM sustained Pt segregation, which was in contrast to the results of the TBIM model. Schurmans et al.12) reported that the reduction in elastic strain energy causes the Pt segregation. Moreover, the difference between the Ni and Pt surface energies is very small. Our simulation predicted slight Ni enrichment on the NiPt particle surface, which was in contrast to the prediction by the Monte Carlo simulation.14)Therefore, we suggest that in the case of a small surface energy difference, as in the NiPt particle, the actual surface can be determined by atomic size mismatch, which is not considered in this model.
4. Conclusion
We have performed phase-field simulations to investigate phase transformation and surface segregation in platinum-based alloy nanoparticles. From our results, it was evident that the surface segregation and atomic ordering were sensitive to the alloy components and particle size. The simulated equilibrium structures of nanoparticles vary according to the balance between the surface energy and chemical interaction between atomic components. So far, microstructural simulations of nanoparticles have been performed mainly by using the Monte Carlo method. Although the surface energy was accounted for through parameter values related to aflat plane surface, the proposed phase-field approach gave sufficient accuracy. This method provides a useful tool for the design of alloy nanoparticles.
REFERENCES
1) M. K. Debe:Nature486(2012) 4351.
2) R. Ferrando, J. Jellinek and R. L. Johnston:Chem. Rev.108(2008) 845910.
3) V. R. Stamenkovic, B. S. Mun, K. J. J. Mayrhofer, P. N. Ross and N. M. Markovic:J. Am. Chem. Soc.128(2006) 88138819.
4) T. Takeshita, H. Murata, T. Hatanaka and Y. Morimoto:ECS Trans.16 (2008) 367373.
5) F. L. Williams and D. Nason:Surf. Sci.45(1974) 377408. 6) R. V. Chepulskii and W. H. Butler:Phys. Rev. B72(2005) 134205. 7) M. Müller and K. Albe:Phys. Rev. B72(2005) 094203.
8) M. Müller, P. Erhart and K. Albe:Phys. Rev. B76(2007) 155412. 9) R. V. Chepulskii, W. H. Butler, A. van de Walle and S. Curtarolo:Scr.
Mater.62(2010) 179182.
10) P. Moskovkin and M. Houa:J. Alloy. Compd.434435(2007) 550 554.
11) L. V. Pourovskii, A. V. Ruban, I. A. Abrikosov, Y. K. Vekilov and B. Johansson:Phys. Rev. B64(2001) 035421.
12) M. Schurmans, J. Luyten, C. Creemers, R. Declerck and M. Waroquier: Phys. Rev. B76(2007) 174208.
13) H. Deng, W. Hu, X. Shu, L. Zhao and B. Zhang:Surf. Sci.517(2002) 177185.
14) G. Wang, M. A. Van Hove, P. N. Ross and M. I. Baskes:J. Chem. Phys. 122(2005) 024706.
15) Y. Ma and P. B. Balbuena:Surf. Sci.602(2008) 107113. 16) T. Koyama:Sci. Technol. Adv. Mater.9(2008) 013006.
17) T. Koyama and H. Onodera:J. Jpn. Inst. Metals68(2004) 10081012. 18) Y. K. Takahashi, T. Koyama, M. Ohnuma, T. Ohkubo and K. Hono:
J. Appl. Phys.95(2004) 26902696.
19) S. Yamakawa, K. Okazaki-Maeda, M. Kohyama and S. Hyodo: J. Phys.: Conference Series100(2008) 072042.
20) J. W. Cahn:J. Chem. Phys.42(1965) 9399.
21) S. M. Allen and J. W. Cahn:Acta Metall.27(1979) 10851095. Fig. 5 Relationship between the degree of surface segregation and surface
[image:7.595.60.273.67.240.2]22) B. Zhou and A. C. Powell:J. Membr. Sci.268(2006) 150164. 23) W. Villanueva, K. Grönhagen, G. Amberg and J.¡gren:Phys. Rev. E
77(2008) 056313.
24) A. T. Dinsdale:CALPHAD15(1991) 317425. 25) K. Asp and J.¡gren:Acta Mater.54(2006) 12411248. 26) P. Fredriksson and B. Sundman:CALPHAD25(2001) 535548. 27) D. Kim, J. E. Saal, L. Zhou, S. Shang, Y. Du and Z. Liu:CALPHAD35
(2011) 323330.
28) X. Lu, B. Sundman and J.¡gren:CALPHAD33(2009) 450456. 29) T. Abe, B. Sundman and H. Onodera: J. Phase Equilib. Diffus. 27
(2006) 513.
30) K. Binder, J. L. Lebowitz, M. K. Phani and M. H. Kalos:Acta Metall. 29(1981) 16551665.
31) T. Abe: Zairyousekkeikougaku Keisanneturikigakuhen, (Uchida Rokakuho, Tokyo, 2011) p. 159.
32) J. W. Cahn and J. E. Hilliard:J. Chem. Phys.28(1958) 258267. 33) A. Dannenberg, M. E. Gruner, A. Hucht and P. Entel:Phys. Rev. B80
(2009) 245438.
34) Y. N. Wen and J. M. Zhang:Solid State Commun.144(2007) 163167. 35) W. R. Tyson and W. A. Miller:Surf. Sci.62(1977) 267276. 36) J. W. Arblaster:Platinum Metals Rev.50(2006) 118119.
37) H. E. Schaefer:Phys. Status Solidi A102(1987) 4765.
38) M. J. Mehl and D. A. Papaconstantopoulos:Phys. Rev. B54(1996) 45194530.
39) Y. Ouyang, H. Chen and X. Zhong: J. Mater. Sci. Technol.19(2003) 243246.
40) M. Watanabe, T. Masumoto, D. H. Ping and K. Hono:Appl. Phys. Lett. 76(2000) 39713973.
41) T. Miyazaki, O. Kitakami, S. Okamoto, Y. Shimada, Z. Akase, Y. Murakami, D. Shindo, Y. K. Takahashi and K. Hono:Phys. Rev. B72 (2005) 144419.
42) C. B. Rong, N. Poudyal, G. S. Chaubey, V. Nandwana, R. Skomski, Y. Q. Wu, M. J. Kramer and J. P. Liu: J. Appl. Phys.102(2007) 043913.
43) C. B. Rong, D. R. Li, V. Nandwana, N. Poudyal, Y. Ding, Z. L. Wang, H. Zeng and J. P. Liu:Adv. Mater.18(2006) 29842988.
44) Z. L. Wang, J. M. Petroski, T. C. Green and M. A. El-Sayed:J. Phys. Chem. B102(1998) 61456151.
45) A. Barybin and V. Shapovalov:J. Appl. Phys.109(2011) 034303. 46) S. Zhao, S. Wang and H. Ye:J. Phys. Soc. Jpn.70(2001) 29532957. 47) A. Khoutami, B. Legrand and G. Tréglia:Surf. Sci.287288(1993)