University of Southampton Research Repository
ePrints Soton
Copyright © and Moral Rights for this thesis are retained by the author and/or other
copyright owners. A copy can be downloaded for personal non-commercial
research or study, without prior permission or charge. This thesis cannot be
reproduced or quoted extensively from without first obtaining permission in writing
from the copyright holder/s. The content must not be changed in any way or sold
commercially in any format or medium without the formal permission of the
copyright holders.
When referring to this work, full bibliographic details including the author, title,
awarding institution and date of the thesis must be given e.g.
University of Southampton
High-precision isotope ratio measurements of uranium
and plutonium in the environment
January 2002
A thesis submitted for the degree of Doctor of Philosophy
Thorsten Warneke Dipl. Phys. (Heidelberg)
Faculty of Science
School of Ocean and Earth Science
ABSTRACT
A high-precision mass spectrometry method has been developed to measure 240Pu/239Pu at low concentrations in environmental samples. A reproducibility of <1% for sample sizes of > 0.5pg has been achieved using a highly sensitive and precise multi-collector ICP-mass spectrometer (Micromass IsoProbe). The research has involved applying the developed methods to a number of environmental studies.
Application I: A chronology for 240Pu/239Pu is presented. This chronology over the period 1945-1980 is derived from grass samples from the IACR Rothamsted Archive at Harpenden (Hertfordshire, UK) and an Alpine ice core from Dome du Gouter, Mont Blanc, French Alps. Activity concentrations for 137
Cs and 239,240Pu and the 238U/235U atomic ratio were also determined in the same samples. The activity concentrations clearly reflect the yearly yields of atmospheric testing. A higher abundance of 235
U can be linked to nuclear testing between 1950-1963. A higher abundance of 238U is found in the period 1970-80 in the grass, but not in the ice. The 240Pu/239Pu ratio is compared with Polar ice core and stratospheric data that have appeared in the literature. It is particularly notable that the UK herbage samples clearly identify fallout from the early U.S. tests in the Nevada desert (1952 and 1953) and that 1954-68 samples show isotope ratios reflecting stratospheric fallout. Ratios for the 1970s cannot be uniquely attributed to a single source. Complementary measurements of the 240
Pu/239Pu have been carried out on stratospheric air filters from Sweden and ground-level air filters from Germany.
Application IIA: Plutonium isotopes have been measured in a sediment core from the Wyre saltmarsh. Radionuclide contamination in this area is much higher than in many other UK sites because of its incorporation of discharges from the BNFL Sellafield. A model for the transport of radiolabelled sediment from the Sellafield area is also presented.
Application IIB: Plutonium isotopic ratios in a mudflat core from Poole Harbour reflect the pattern that is expected from weapons fallout in the pre-1970 period. The post-1970 sediment shows an additional source that is considered to be the discharges from AEA Winfrith.
ACKNOWLEDGMENTS
Contents
1. INTRODUCTION
1.1 Aims of the research
1.2 The elements U and Pu and their characteristic ratios from different sources
1.3 Nuclear tests and satellite accidents as global sources of Pu and U in the environment 1.4 Local sources with impact to the UK environment
1.4.1 British nuclear activities and facilities 1.4.2 BNFL Sellafield
1.4.3 AWE Aldermaston and Burghfield 1.4.4 AEA Winfrith
1.4.5 COGEMA La Hague 1.4.6 The Chernobyl accident
2. METHODS USED FOR THE RESEARCH
2.1 Separation of U and Pu from environmental samples 2.1.1 Dissolution methods
2.1.2 Chemical separation
2.2 Blank values for different acid grades 2.3 Gamma spectrometry of 137Cs 2.4 Mass spectrometric measurements 2.4.1 Introduction to the instruments used
2.4.2 Loading techniques for Thermal Ionisation Mass Spectrometry (TIMS) 2.4.3 Measurement of plutonium isotopic ratios using IsoProbe-MCICPMS 2.4.4 Static measurements of the 238U/235U using Faraday collectors
2.4.5 Static Faraday-Daly measurement of 238U/235U 2.5 Conclusions
3. APPLICATION I: CHRONOLOGY OF URANIUM AND PLUTONIUM ISOTOPIC RATIOS IN WEAPONS FALLOUT
3.1 Introduction
3.2 Transport of radionuclides from tests with stratospheric input to the UK 3.3 Transport of radionuclides from the Nevada test site to the UK 3.4 Existing stratospheric and ice core data
3.5 Grass samples from the IACR Rothamsted archive and an ice core from Dome du Gouter, Mont Blanc, French Alps
3.5.1 Deposition onto the grass and presentation of the Rothamsted data
3.5.2 137Cs, plutonium (alpha), 240Pu/239Pu and 238U/235U in Rothamsted grass samples and the Mont Blanc ice core
3.6 Possible explanation for the production of enriched uranium in a nuclear explosion 3.7 Stratospheric air samples from Sweden
3.8 Air filters from the PTB Braunschweig
3.9 Summary plot of data, suitable for a 240Pu/239Pu chronology 3.10 Conclusions
4. APPLICATION II A: PLUTONIUM FROM THE BNFL SELLAFIELD SITE–RESULTS FOR A SEDIMENT CORE FROM THE WYRE SALTMARSH
4.1 Introduction
4.2 Radionuclides in the Irish Sea and the transport to the sampling site 4.3 Plutonium and caesium concentrations in the core
4.4 238Pu/239,240Pu and 239,240Pu/137Cs activity ratios in the core 4.5 240Pu/239Pu and 242Pu/239Pu atom ratios in the core 4.6 A model for the dispersion of plutonium 4.7 Model response to the variation of the parameters 4.8 Best fit parameters for the Wyre core
5. APPLICATION II B: PLUTONIUM IN A SEDIMENT CORE FROM POOLE HARBOUR
5.1 Introduction 5.2 Core Geochemistry 5.3 Plutonium in the core 5.4 Conclusions
6. APPLICATION III: DISTRIBUTION OF U AND PU FROM AWE ALDERMASTON AND BURGHFIELD
6.1 The discharge from AWE Aldermaston 6.2 Results from the dispersion model
6.3.1 Modelled angular distribution of AWE discharge fallout 6.3.2 Modelled lateral distribution of AWE discharge fallout 6.3.3 Implications of the dispersion to the AWE survey results
6.4 The environmental monitoring survey around AWE Aldermaston and AWE Burghfield 6.4.1 Depth distribution of plutonium
6.4.2 Contamination around the AWE sites
6.5 Discussion of the observed contamination pattern 6.6 Conclusions
7. CONCLUSIONS AND POSSIBLE FUTURE WORK 8. REFERENCES
9. APPENDICES
M.1 Time independent mass fractionation laws in mass spectrometry
M.2 Derivation of an analytical formula for the sample ratio from a spike-sample mixture A1 Atmospheric nuclear test data
A2 Discharges from AWE Aldermaston A.3 Discharges from the AEA Winfrith A.4 Discharges from COGEMA La Hague A.5 Discharges from BNFL Sellafield A.6 Atmospheric circulation
A.7 Theory of the dispersion model for the AWE airborne discharge
A.7.1 General theory of the dispersion of airborne discharges (Gaussian plume equation) A.7.2 Calculations and assumptions for the dispersion from AWE Aldermaston
A.7.3 Main assumptions and approximations used for the model A.7.4 Effects of the modelled deposition for the measurements A.7.5 Calculation of the critical ratios and concentrations A.8 Compilation of analytical isotope data determined in the research
A.9 Paper: Plutonium isotope ratio analysis at femtogram to nanogram levels by multicollector ICP-MS,
(Taylor R.N., Warneke T., Milton J.A., Croudace I.W., Warwick P.E. and Nesbitt R.W. (2001) J. Anal.
At. Spectrom. 16, 279-284)
LIST OF FIGURES
Figure 1.1 Yearly test yields
Figure 1.2 Global locations of major atmospheric nuclear tests Figure 1.3 Stratospheric 239,240Pu inventories
Figure 1.4 Latitudinal distribution of (a) 238Pu and (b) 239,240Pu Figure 1.5 Nuclear facilities in the UK
Figure 1.6 The passage of the Chernobyl plume Figure 2.1 Decay scheme of 137Cs
Figure 2.2 Schematic of the Micromass IsoProbe MCICPMS
Figure 2.3 Method blank corrected 240Pu/239Pu versus sample concentration Figure 2.4 Dependance of the242Pu/239Pu on the measurement cycle Figure 2.5 238U/235U atomic ratio vs. 238U voltage
Figure 2.6 238U/235U versus voltage on mass 238
Figure 3.1 Height of the centre of the fireball versus explosive yield Figure 3.2 137Cs in surface air at Moosonee, Ontario, Canada Figure 3.3 Plutonium isotopic ratios in the stratosphere Figure 3.4 Plutonium isotopic ratios in Polar Ice Figure 3.5 239,240Pu/137Cs activity ratio in the stratosphere Figure 3.6 Dry matter yield of Rothamsted Grass Figure 3.7 137Cs concentration in Rothamsted Grass Figure 3.8 137Cs deposition density on Rothamsted Grass
Figure 3.9 (a)137Cs concentration in the Rothamsted grass and deposition flux at Milford Haven (b) 239,240Pu concentration in the Rothamsted grass and in Alpine ice
Figure 3.10 (a) 240Pu/239Pu atom ratio in an ice core from the J-9 Ross Ice Shelf, Antarctica and in the Northern Stratosphere (b) 240Pu/239Pu atom ratio in Rothamsted grass and Alpine ice
Figure 3.11 (a) 238U/235U in Rothamsted grass samples (b) 238U/235U in Alpine ice from Dome du Gouter (4300m), Mont Blanc, France
Figure 3.12 Summary plot of 240Pu/239Pu data Figure 4.1 Location of the Wyre saltmarsh
Figure 4.2 (a) 239,240Pu (b) 238Pu (c) 137Cs in the Wyre core Figure 4.3 238Pu/239,240Pu activity ratio in the Wyre core Figure 4.4 239,240Pu/137Cs activity ratio in the Wyre Core Figure 4.5 240Pu/239Pu in the Wyre core
Figure 4.6 242Pu/239Pu in the Wyre Core
Figure 4.7 Schematic diagram of the Wyre transport model
Figure 4.8 Modelled 238Pu, 239,240Pu and 238Pu/239,240Pu for different values of w Figure 4.9 Modelled 238Pu, 239,240Pu and 238Pu/239,240Pu for different values of t1/2
Figure 4.10 Measured and modelled curves for the best-fit parameters of the Wyre transport model Figure 4.11 Reconstructed 240Pu/239Pu in the Sellafield Discharge
Figure 5.1: Profiles of Fe2O3, MnO, S and Al2O3 in the Poole Harbour Core Figure 5.2 137Cs profile in the Poole Harbour core
Figure 5.3 241Am profile in the Poole Harbour core
Figure 5.6 238Pu/239,240Pu in the mudflat core from Poole Harbour Figure 5.7 241Pu/239,240Pu in the mudflat core from Poole Harbour
Figure 5.8 Plutonium concentration measured in core, discharge of alpha activity from AEE Winfrith and modelled concentration
Figure 6.1 Aerial discharge from the AWE Aldermaston
Figure 6.2 Angular distribution of uranium surface air concentration (SAC) and uranium wash-out (WO) at a distance of 1km
Figure 6.3 Angular distribution of plutonium surface air concentration (SAC) and plutonium wash-out (WO) at a distance of 1km
Figure 6.4 Lateral distribution of plutonium surface air concentration (SAC) and plutonium wash-out (WO) in northern direction for the first km
Figure 6.5 Lateral distribution of plutonium SAC and WO in northern direction for 1–5km Figure 6.6 Lateral distribution of uranium SAC and WO in northern direction for 1–5km Figure 6.7 Percentage of 239,240Pu in the first 3 soil layers
Figure 6.8 Percentage of 239,240Pu in the first 2 soil layers Figure 6.9 Half Life of 239,240Pu in the first soil layer
Figure 6.10 Depth distribution of the240Pu/239Pu for non-contaminated sites Figure 6.11 Deviation from the natural 238U/235U around the AWE Sites Figure 6.12 239,240Pu concentration around the AWE Sites
Figure 6.13 240Pu/239Pu around the AWE sites from the AWE Survey
Figure 6.14 240Pu/239Pu, 239,240Pu and deviation of the238U/235U for Control Site samples
List of Tables
Table 1.1 Half lives and abundance of U isotopes of interest Table 1.2 238U/235U for different sources
Table 1.3 Half lives and decay mode of plutonium isotopes of interest Table 1.4 Plutonium grades
Table 1.5 Plutonium ratios for different sources Table 1.6 Plutonium ratios for different reactor types Table 1.7 Power reactors in the UK
Table 1.8 Weapons-related sites in the UK
Table 2.1 Uranium content of different acid grades
Table 2.2 Specification and performance data of the gamma detector Table 2.3 Loading techniques for TIMS- filaments
Table 2.4 Typical backgrounds for an extract setting of 40%
Table 2.5 Measured 240Pu/239Pu and 242Pu/239Pu for the site112 sediment and UK-Pu5 Table 2.6 Measured 240Pu/239Pu and 242Pu/239Pu for NBL122, NBL126 and NBL128 Table 2.7 Correction factors for peak tailing to the low mass side for the Isoprobe Table 3.1 Nuclear test data and 240Pu/ 239Pu for Rothamsted grass
Table 3.2 240Pu/239Pu results for stratospheric air filters from Sweden Table 3.3 240Pu/239Pu results for ground level air filters from the PTB Table 4.1 Best fit parameters for the Wyre transport model
Table 5.1 Sediment accumulation rates determined using different methods Table 6.1 Mass equivalents of 1MBq for different isotopic compositions Table A.1 Atmospheric nuclear tests with yields greater than 500kt Table A.2 CED values
Table A.3 Expected results from continuous air concentration above the limit Table A.4 240Pu/239Pu data for air filters from the PTB Braunschweig Table A.5 240Pu/239Pu data for stratospheric filters from Sweden
Table A.6 238U/235U, 240Pu/239Pu and 137Cs and 239,240Pu concentration data for the Rothamsted grass Table A.7 238U/235U, 240Pu/239Pu and 239,240Pu concentration data for the Alpine ice core
Table A.8 Radionuclide and geochemical data for the Poole sediment core
PhD Proposal (1998)
Graduate School of Ocean & Earth Science
Characterisation and differentiation of Pu and U isotopes in the environment Supervisors: Dr IW Croudace, Dr PE Warwick & Dr R Taylor
The recent radiometric survey of Greenham Common, Newbury District and surrounding areas (Croudace, Warwick, Taylor and Dee, 1997)* was specifically tasked with studying the alleged nuclear incident at the Greenham Common airbase. Despite using mass spectrometric techniques no evidence for any such incident was found at or around the airbase. Sampling around AWE (Aldermaston) was also carried out and small amounts of anomalous U (and Pu to a lesser extent) were detected in the vicinity of the site.
Specific measurements for 235U, 238U, 239Pu, 240Pu and 241Pu should allow apportionment to be made between the two main source terms (viz. AWE discharges and weapons fallout). Thermal ionisation mass spectrometry (TIMS) will be used to determine the ratio of 239Pu/240Pu and 238U/235U in samples (soils and other environmental materials) collected at various distances from AWE to study the lateral and vertical (historical) distribution of anomalous U and Pu. Although a general 239Pu/240Pu ratio of 5 (compared with ca. 10-15 for weapons material) is known from weapons’ fallout more detailed temporal variations for the southern UK are not known. It is also proposed to determine a unique time-series dataset using a national herbage archive. This archive consists of grass, cut and stored annually since 1830, which should preserve a reliable record of weapons’ fallout. Promising preliminary measurements on samples from 1930 (pre-fallout), 1958 and 1963 (peak fallout) and 1995 (post Chernobyl) grass have already been made.
Pu behaviour in the environment
Most thermonuclear weapons use Pu in the core ( >90% 239Pu with the rest mostly 240Pu ) but have U (mostly 238U) in the tamper. Any Pu in the weapon that is not fissioned will form chemically resistant (refractory) PuO2 that will eventually return to the ground as fallout.
239
Pu and 240Pu are also formed during the nuclear detonation by neutron capture reactions on 238U. It has been suggested that fallout-Pu formed on irradiation of 238U during a nuclear weapon detonation is chemically more available than the Pu derived in the weapon core. Approximately 66% of the Pu released to the stratosphere during atmospheric weapons’ testing would be formed through neutron capture during the fusion-fission lifetime of the detonated device (relatively short). The irradiation of 238U will produce 239U and 240U which then decay to 239Pu and 240Pu over a period of days (i.e. much longer than the lifetime of the thermonuclear reactions). This Pu, which is not high-fired, will be more labile in the environment than the original Pu used in the weapon construction. The study will investigate whether the two forms of Pu (labile and non-labile) have different isotopic composition. If a variation in composition is confirmed then Pu isotopic measurements using TIMS will be used to investigate whether there is any evidence for the variation of chemical behaviour in the environmental samples.
*Croudace, I, Warwick, P., Taylor, R. and Dee, S. (1997) An investigation of radioactive
Presentations given
Geoscience 2000, Manchester, UK
Poster: 240Pu/239Pu isotopic ratio measurements by IsoProbe MC-ICP-MS
Coger 2000, Southampton, UK
Talk: 240Pu/239Pu isotopic ratio measurements in environmental samples using MC-ICP-MS
AGU 2001, San Francisco, USA
Talk: Environmental applications of 240Pu/ 239Pu measurements using the IsoProbe MC-ICP-MS
Papers and reports
Croudace I., Warwick P., Taylor R., Bradshaw K. and Warneke T. (1999) An assessment of
radioactive contamination in the environment as a result of operations at the AWE sites in Berkshire Report No.1
Croudace I., Warwick P., Cundy A., Warneke T., Oh J.S. and Taylor R.N. (2000) An assessment of radioactive contamination in the environment as a result of operations at the AWE sites in Berkshire Report No.2
Croudace I., Warwick P., Warneke T., Cundy A., Oh J.S. and Taylor R.N. (2001) An assessment of radioactive contamination in the environment as a result of operations at the AWE sites in Berkshire Report No.3
Declaration
CHAPTER 1
1. Introduction
1.1. Aims of the research
The project is concerned with the detection of uranium and plutonium pollution in the environment. Isotope ratio data are used to characterise the sources of plutonium and uranium. In most measurements, the uranium background is dominated by natural uranium. The isotopic ratios in natural uranium are well known and constant over the time periods of interest. In contrast to uranium plutonium does not occur naturally only in trace amounts. A background of plutonium was introduced into the environment by nuclear weapon testing. The plutonium isotopic ratios vary over the time periods of interest and its variation is not well known.
The following goals have been achieved during the PhD research:
• Investigation of the 240Pu/239Pu atomic ratio measurement using TIMS and MC-ICPMS. Several filament loading techniques for TIMS were investigated at an early stage in the project. However, the IsoProbe MC-ICPMS proved to be superior for the determination of the 240Pu/239Pu at low concentrations (~0.5pg). The development of the plutonium measurement on the IsoProbe MC-ICPMS has been published in Taylor et al., 2001. • Application I: A chronology of plutonium and uranium isotopic ratios in grass samples
CHAPTER 1
first time that a chronology based on ground-level deposition of the 240Pu/239Pu and the 238
U/235U has been presented for northern temperate latitudes.
• Application II A: Plutonium isotopes have been measured in a sediment core from the Wyre saltmarsh. Anthropogenic radionuclide contamination in this area is much higher than in many other areas because of the relatively close proximity to BNFL Sellafield. A model for the transport of the discharges and a 240Pu/239Pu history of Sellafield discharge is presented.
• Application II B: Plutonium concentrations and isotopic ratios have been investigated in a sediment core from Poole Harbour. In the pre-1970 period the plutonium isotopic ratios show the same pattern as was expected from weapons fallout. Post-1970 an additional source could be identified. The ratios suggest an origin from material that had been in the nuclear-fuel cycle and the assumed source is AEA Winfrith, which is approximately 20 km west of Poole Harbour.
CHAPTER 1
1.2. The elements U and Pu and their characteristic ratios from different sources
Uranium:
Uranium is a naturally occurring element. It occurs at approximately 2 ppm in the earth's crust. Natural uranium consists essentially of the three isotopes 234U, 235U and 238U. A further 3 artificial uranium isotopes (232U, 233U, 236U) have lives greater than 1 year. The half-life and the natural abundance of the U isotopes of interest are given in Table 1.1 and all these isotopes decay via alpha emission. To capitalise on the fission properties of 235U, it is necessary to enrich the isotope from natural uranium and the amount of enrichment required depends on the application. Fuel for nuclear reactors typically contains between 3-5% 235U, depending on the reactor type whereas weapon material contains more than 90% 235U (Lieser, 1991). The enrichment process leads to the production of large quantities of depleted uranium, which contains about 0.2-0.3% 235U. Depleted uranium is used in the outer shell in warheads.
Isotope Half life (years) Natural U atomic abundance
233U 1.59 × 10⁵
234U 2.45 × 10⁵ <0.055 %
235U 7.04 × 10⁸ 0.7200 %
236U 2.34 × 10⁷
238U 4.46 × 10⁹ 99.2745 %
Table 1.1 Half lives and abundance of U isotopes of interest
CHAPTER 1
be indicated by the presence of 236U. It is difficult to use the 238U/234U because of its natural variability. The 238U/235U for the cases discussed above are given in Table 1.2. In this research the 238U/235U was used to characterise the contamination in soils around the AWE site at Aldermaston and Burghfield. There are two problems in using the 238U/235U when investigating soils:
1. The high natural level of uranium in the environment dilutes the anthropogenic source term. Hence high precision measurements are required to detect slight changes in the 238
U/235U.
2. In many cases both depleted and enriched uranium are discharged together and therefore there are three effective components (natural, depleted and enriched). The relative proportion of each will therefore determine the measured ratio and an apparent natural ratio may include anthropogenic components.
Type of uranium 238U/235U
Natural 137.88
Reactor 15 – 32 before burn-up
Weapon grade <0.1
Depleted 250-500
Table 1.2 238U/235U for different sources
Plutonium:
CHAPTER 1
Isotope Half life in years Decay mode
238
Pu 87.7 alpha
239Pu 2.41 × 10⁴ alpha
240Pu 6537 alpha
241Pu 14.4 Beta-(99+), alpha(0.002)
242
Pu 3.76 × 10⁵ alpha
244Pu 8.20 × 10⁷ Alpha(99.9), S.F.(0.1)
Table 1.3Half lives and decay mode of plutonium isotopes of interest
Plutonium is produced by the 238U capture of neutrons. This capture produces neutron rich uranium, which decays then by two beta- decays to plutonium. The quantities of the produced isotopes depend on the neutron flux and the time of the neutron bombardment. In a nuclear reactor the neutrons are produced by the fission of 235U. Since one-neutron-capture dominates amongst other nuclides mainly 239Pu is produced. Once established 239Pu also fissions or transmutes to 240Pu. The interplay between the uranium and plutonium isotopes changes the 239Pu content relative to heavier Pu isotopes with time. The highest 239Pu content is obtained at low burn-up. In civil use it is not economically efficient to refuel the reactor at low burn-up, but for nuclear weapons a high 239Pu and a low 240Pu content are required. The 240
CHAPTER 1
Grade 240Pu Remarks
Super ≤3% Sub-category of weapon grade
Weapon ≤7%
Fuel 7-19% Produced in tritium production reactors
Reactor >19% Power reactors
Table 1.4 Plutonium Grades
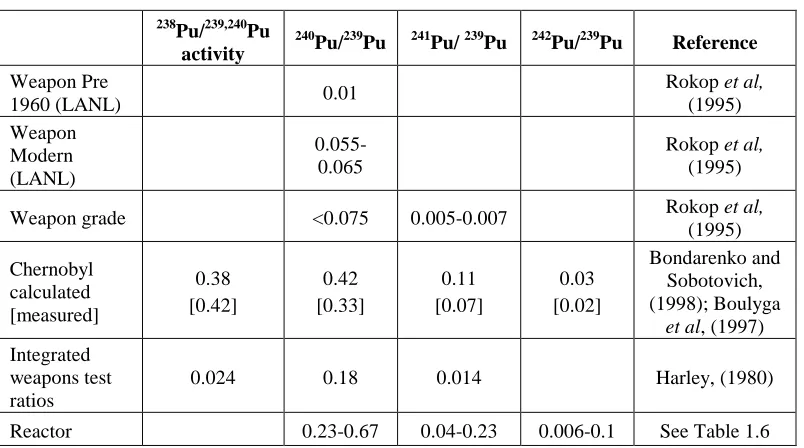
238Pu/239,240Pu
activity
240Pu/239Pu 241Pu/ 239Pu 242Pu/239Pu Reference
Weapon Pre
1960 (LANL) 0.01
Rokop et al, (1995) Weapon
Modern (LANL)
0.055-0.065
Rokop et al, (1995)
Weapon grade <0.075 0.005-0.007 Rokop et al,
(1995)
[image:18.595.106.508.261.485.2]Chernobyl calculated [measured]
0.38 [0.42]
0.42 [0.33]
0.11 [0.07]
0.03 [0.02]
Bondarenko and Sobotovich, (1998); Boulyga
et al, (1997)
Integrated weapons test ratios
0.024 0.18 0.014 Harley, (1980)
Reactor 0.23-0.67 0.04-0.23 0.006-0.1 See Table 1.6
Table 1.5Plutonium ratios for different sources
Reactor type
Fuel burn-up from normal operation
[GWd/t]
240Pu/239Pu 238Pu/239,240Pu
activity
241Pu/239Pu 242Pu/239Pu
GCR 3.6 0.23 40.6 0.045 0.006
PHWR 7.5 0.41 51.7 0.077 0.023
AGR 18 0.57 99.4 0.184 0.093
RBMK 20 0.67 98.1 0.203 0.108
BWR 27.5 0.40 121 0.177 0.055
PWR 33 0.43 148.3 0.228 0.096
Table 1.6Plutonium ratios for different reactor types (Carlson et al., 1988)
CHAPTER 1
1.3. Nuclear tests and satellite accidents as global sources of Pu and U in the environment
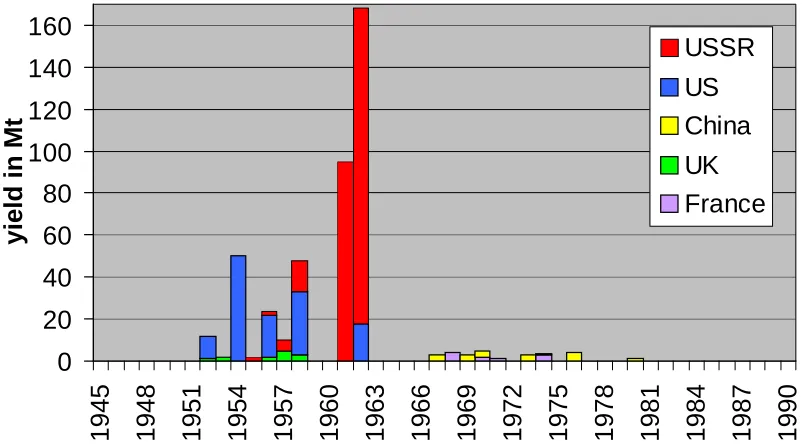
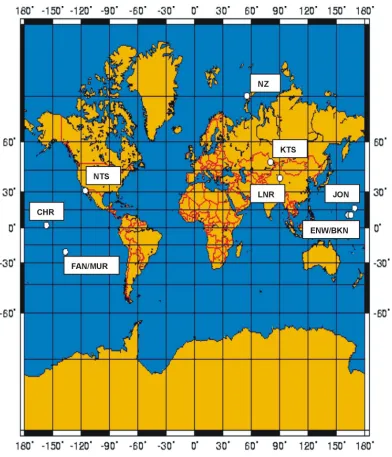
[image:19.595.108.510.448.672.2]The main source of Pu in the environment is fallout from atmospheric nuclear weapon tests, which were conducted between 1945 and 1980. Yearly test yields are shown in Figure 1.1 and the locations of the tests in Figure 1.2. Tests with yields of less then 500 ktonnes are not taken into account. Details of these tests can be found in Carter and Moghissi (1977) and Lawson (1998). Approximately 15000 TBq 239,240Pu were produced in the tests. About 2500 TBq Pu are deposited as local fallout and about 12500 TBq were globally distributed (Harley, 1980) via the stratosphere. The stratospheric inventories of 239,240Pu are shown in Figure 1.3. Other radioactive isotopes in nuclear tests are produced by neutron induced fission of 235U, 238U and 239Pu. These three nuclei have fairly similar fission yield curves with two peaks at masses 100 and 140. Therefore, in contrast to plutonium, the composition of these isotopes does not vary much with the type of the nuclear device. The formed nuclei are mostly unstable and pass through a variety of decay chains before becoming stable.
CHAPTER 1
Figure 1.2 Locations of major atmospheric nuclear tests
CHAPTER 1
Figure 1.3 Stratospheric 239,240Pu inventories due to Harley (1980)
There are different ways of producing/modifying plutonium in a nuclear explosion. One part of the weapons fallout plutonium originates from neutron irradiation of 238U during the explosion by the following reactions:
238
U (1n,γ) 239U (β-) 239Np (β-) 239Pu 238
U (2n,γ) 240U (β-) 240Np (β-) 240Pu 238
U (3n,γ) 241U (β-) 241Np (β-) 241Pu 238
U (4n,γ) 242U (β-) 242Np (β-) 242Pu 238
U (6n,γ) 244U (β-) 244Np (β-) 244Pu
The duration of the neutron flux in a thermonuclear explosion is of the order of microseconds and the half-life of the neutron rich uranium isotopes of the order minutes or hours. Therefore the plutonium isotopes produced do not undergo further neutron capture. The second part of the plutonium comes from the plutonium that was present in the weapon before the detonation. This plutonium consists of non-irradiated plutonium and neutron irradiated, but not fissioned plutonium. In the first mode of production, the uranium is exposed to the high temperatures of the thermonuclear explosion and the plutonium is produced after the particles have been cooled down. In the second mode of production the plutonium is exposed to the high temperatures. This might result in differences of produced metal phases with different chemical behaviour. Chemical and/or physical differences exist
CHAPTER 1
between stratospheric and tropospheric fallout. Plutonium fallout from the stratosphere consists of small plutonium metal oxide particles attached to aerosols (Harley, 1980). Tropospheric fallout consists of larger particles that result from partial or completely vaporised ground material. Differences in chemical behaviour of Pu are reported for sediments from the North Atlantic (Noshkin and Gatrousis, 1974, Buessler and Sholkovitz, 1987), the Gulf of Mexico (Scott et al., 1983) and the North Pacific (Buessler, 1997). All studies suggest that the tropospheric fallout is quickly removed from the water column, whereas stratospherically-derived plutonium remains in solution with a residence time greater than 10-100 years. The source of the tropospheric fallout in the North Atlantic and the Gulf of Mexico is the Nevada Test Site and in the North Pacific it is the Pacific Proving Grounds (Marshall Islands).
The second source of environmental contamination with a global impact is from accidents involving satellites and their power packs. A major source of plutonium in the stratosphere was the SNAP-9A accident in April 1964 over the Indian Ocean. It introduced about 630 TBq 238Pu into the atmosphere at about 50 km altitude (Harley, 1980). Since the plutonium from atmospheric weapons tests consists mainly of 239Pu and 240Pu (238Pu/ 239,240Pu activity ratio = 0.024, see Table 1.5) the SNAP-9A accident was the main source of 238Pu in the stratosphere (see Figure 1.4). Other satellite accidents introduced uranium in the atmosphere. The satellite Cosmos-954 re-entered the atmosphere over northern Canada in January 1978 and the Cosmos-1402 satellite desintegrated over the South Atlantic Ocean in February 1983. Both satellites contained about 50kg enriched uranium. The assumed isotopic composition of the uranium is 1% 234U, 90% 235U, 0.5% 236U and 8.5% 238U (Krey et al, 1979, Leifer et al, 1987).
CHAPTER 1
Reiter (1975) about 15% of the stratospheric mass is exchanged with the other hemisphere per year. The plutonium isotopic ratios depend on the design of the weapon and the parameters of the test. Therefore the ratio is not constant over time. The integrated 240
[image:23.595.114.470.262.581.2]Pu/239Pu in soils is 0.18 and does not vary greatly with latitude (Kelley et al, 1999). The only exceptions are lower ratios around 35°N due to the Nevada Test Site.
Figure 1.4 Latitudinal distribution of (a) 238Pu and (b) 239,240Pu in Bq/m2 in 1971 due to Hardy et al. (1973)
239,240Pu
0 20 40 60 80 100
-90 -75 -60 -45 -30 -15 0 15 30 45 60 75 90
238Pu
0 0,5 1 1,5 2 2,5
-90 -75 -60 -45 -30 -15 0 15 30 45 60 75 90
test
CHAPTER 1
1.4 Local sources with impact to the UK environment
Local sources of Pu are authorised discharges from plants that process Pu or accidental releases of plutonium. In the following sections any local sources that could have an impact on the environment in the UK are discussed. Besides their impact on the environment some information about selected sites is given. All the listed facilities could potentially be sources of radionuclides to the UK environment. In 1.4.2 –1.4.6 the sources that are thought to be relevant for this research are discussed in more detail. This discussion includes two sources outside the UK which are the La Hague reprocessing plant and the Chernobyl accident.
1.4.1 British nuclear activities and facilities
CHAPTER 1
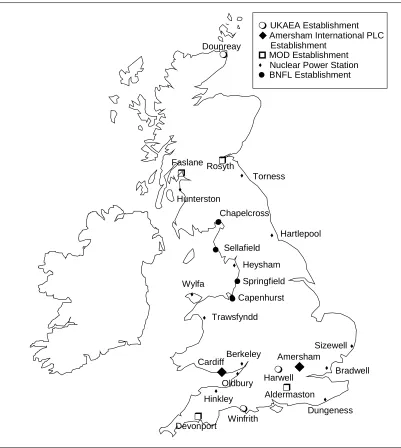
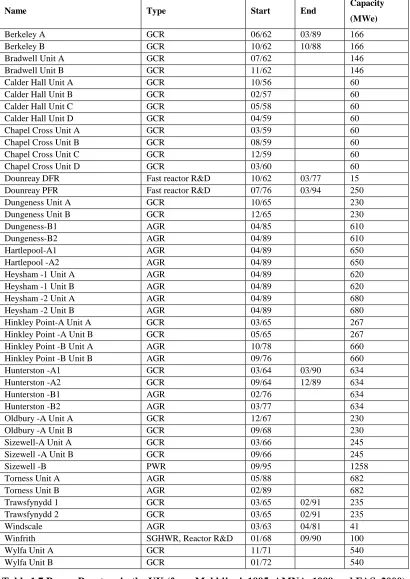
The separated plutonium was then transported to Aldermaston for the weapons construction. The quantities of plutonium produced for military purposes were 0.4 metric tons at Windscale during 1951-1957 and 3.2 metric tons at Sellafield/Calder Hall and Chapelcross during 1957-1964 (Makhijani, 1995). The locations of all nuclear facilities in the UK can be seen in Figure 1.5 and details about the facilities are given in Table 1.7 and Table 1.8.
UKAEA Establishment
BNFL Establishment Amersham International PLC Establishment
MOD Establishment Nuclear Power Station
Sellafield Dounreay
Harwell
Aldermaston Cardiff
Winfrith Capenhurst
Hartlepool
Wylfa Hunterston
Torness
Sizewell Faslane Rosyth
Chapelcross
Heysham
Springfield
Trawsfyndd
Bradwell
Dungeness
Devonport Hinkley
Amersham
Oldbury Berkeley
[image:25.595.102.503.228.676.2]
CHAPTER 1
Name Type Start End Capacity
(MWe)
Berkeley A GCR 06/62 03/89 166
Berkeley B GCR 10/62 10/88 166
Bradwell Unit A GCR 07/62 146
Bradwell Unit B GCR 11/62 146
Calder Hall Unit A GCR 10/56 60
Calder Hall Unit B GCR 02/57 60
Calder Hall Unit C GCR 05/58 60
Calder Hall Unit D GCR 04/59 60
Chapel Cross Unit A GCR 03/59 60
Chapel Cross Unit B GCR 08/59 60
Chapel Cross Unit C GCR 12/59 60
Chapel Cross Unit D GCR 03/60 60
Dounreay DFR Fast reactor R&D 10/62 03/77 15 Dounreay PFR Fast reactor R&D 07/76 03/94 250
Dungeness Unit A GCR 10/65 230
Dungeness Unit B GCR 12/65 230
Dungeness-B1 AGR 04/85 610
Dungeness-B2 AGR 04/89 610
Hartlepool-A1 AGR 04/89 650
Hartlepool -A2 AGR 04/89 650
Heysham -1 Unit A AGR 04/89 620
Heysham -1 Unit B AGR 04/89 620
Heysham -2 Unit A AGR 04/89 680
Heysham -2 Unit B AGR 04/89 680
Hinkley Point-A Unit A GCR 03/65 267
Hinkley Point -A Unit B GCR 05/65 267
Hinkley Point -B Unit A AGR 10/78 660
Hinkley Point -B Unit B AGR 09/76 660
Hunterston -A1 GCR 03/64 03/90 634
Hunterston -A2 GCR 09/64 12/89 634
Hunterston -B1 AGR 02/76 634
Hunterston -B2 AGR 03/77 634
Oldbury -A Unit A GCR 12/67 230
Oldbury -A Unit B GCR 09/68 230
Sizewell-A Unit A GCR 03/66 245
Sizewell -A Unit B GCR 09/66 245
Sizewell -B PWR 09/95 1258
Torness Unit A AGR 05/88 682
Torness Unit B AGR 02/89 682
Trawsfynydd 1 GCR 03/65 02/91 235
Trawsfynydd 2 GCR 03/65 02/91 235
Windscale AGR 03/63 04/81 41
Winfrith SGHWR, Reactor R&D 01/68 09/90 100
Wylfa Unit A GCR 11/71 540
[image:26.595.101.511.117.696.2]Wylfa Unit B GCR 01/72 540
Table 1.7 Power Reactors in the UK (from Makhijani, 1995, AMNA, 1999 and FAS, 2000)
Magnox Reactor (GCR), Advanced Gas-cooled Reactor (AGR), Pressurised Water Reactor (PWR), Steam-Generating Heavy
CHAPTER 1
Site Type Origin Closure
AWE Aldermaston
R&D Weapons Laboratory (since 1950s), fissile material storage and recycle, component
manufacture
1952 (begun in 1950)
AWE Burghfield
Weapons Assembly and Disassembly,
non-fissile component manufacture 1954 (constructed 1941)
AWE Cardiff Depleted uranium and beryllium component manufacture
1958 (engineering
establishment since 1939) 1997
Capenhurst Enrichment 1953
Chapelcross
Military Production Reactors (Pu)
Tritium production (since 1980)
1958 today
civilian
Dounreay Reprocessing 1955 1998
Foulness Island High- Explosives testing 1997
Harwell Site R&D Weapons Laboratory (pre mid 1950s) 1946
Sellafield Reprocessing 1951 (existed since 1939 as a munitions factory)
Sellafield/
Windscale
Military Production Reactors (Pu) 1951 1957
Sellafield/
Calder Hall
Military Production Reactors (Pu) 1956
Springfields Conversion 1948
Table 1.8 Weapons-related sites in the UK (from Makhijani, 1995, AMNA, 1999 and FAS, 2000)
1.4.2 BNFL Sellafield
[image:27.595.92.519.114.475.2]CHAPTER 1
been brought into operation on site. Currently the main activity at Sellafield is recycling of used fuel from nuclear power stations worldwide. Large stocks of military plutonium are held in special vaults at the site, though no plutonium for use in nuclear weapons is produced nowadays. Sellafield began under the Ministry of Supply in 1947 and responsibility was transferred to the United Kingdom Energy Authority (UKAEA) in 1954. In 1971 British Nuclear Fuels Limited (BNFL) took over.
Liquid waste is discharged via pipelines which extend 2.5 km from the high water mark out into the Irish Sea. Discharges started in 1952. An annual discharge record is given in Appendix A6 and further details are given in Gray et al, 1995. Atmospheric discharges occur from many separate points on the Sellafield site and a complete set of annual records is not available. A further problem is that significant atmospheric discharges have arisen from accidents or abnormal plant operation. Sellafield is one of two major European sources of plutonium into the environment and concentrations of up to 15800Bq/kg 239,240Pu are found in sediments close to the plant (Oh, 1999). The 240Pu/239Pu found in the Esk estuary sediment ranges from 0.16-0.26 (McCarthy and Nicholls, 1990; Sampson et al.,1991; Momoshima et al., 1997; Erfurd, 1995 due to Rokop et al., 1995). Soil samples within 10km of the plant,
collected between 1976-1986 (McCarthy and Nicholls, 1990), have 240Pu/239Pu ratios that depend on the sampling location but no correlation with sampling time can be made. The 240
Pu/239Pu in the soil ranges from 0.057 to 0.126. The concentration was between 0.64-30 Bq/kg 239,240Pu. The low 240Pu/239Pu ratios suggest that the plutonium is mostly due to aerial discharges in the early years of operation. Compared with Sellafield the other nuclear installations in the UK are only minor sources of plutonium. In the fourth report of the Committee on Medical Aspects of Radiation in the Environment (COMARE, 1996) it was concluded that there is a significantly elevated level of all malignancies in young people (0-24) in Seascale for the period between 1963-1992. However, it was also concluded that the calculated radiation dose from both routine and accidential discharges was too low to explain the observed cancer rates.
1.4.3 AWE Aldermaston and Burghfield
CHAPTER 1
miles from Basingstoke, and 12 miles from the town of Reading. The first building was completed in spring 1951 and the main warhead fabrication plant in April 1952. Six months later Britain had carried out its first nuclear test. Nowadays AWE's prime purpose is still the support of the UK nuclear deterrent, but it is also an important research and development centre. Aldermaston started off under the control of the Ministry of Supply, then by the United Kingdom Atomic Energy Authority. In 1973 it was taken over by the Ministry of Defence. Ten years later the MoD Procurement Executive Directorate of Research and Development Establishment took over control. In 1987 the two Royal Ordnance Factories, Burghfield and Llanishen (Cardiff), were renamed Atomic Weapons Establishment (AWE) and combined with Aldermaston to create the AWE group. On 1 April 1993 AWE was contractorised and managed on behalf of the MoD by Hunting BRAE Ltd, a consortium comprising Hunting Engineering (51%), Brown & Root (31%) and AEA Technology (18%). In April 2000 a new consortium AWE plc comprising BNFL, Lockheed Martin and Serco took over. Until 31 March 1999 Aldermaston received a total of 17.12 tonnes plutonium with 3.51 tonnes still held at the site at 31March 1999 (MOD, 2000).
CHAPTER 1
MAFF and now the EA have inspected areas associated with discharge twice a year. In the third report of the Committee on Medical Aspects of Radiation in the Environment (COMARE, 1989) it was stated that there is a small but statistically significant increase in registration rates of childhood cancers within 10km of AWE Aldermaston and AWE Burghfield, compared with both national rates and regional rates for Oxford and Wessex. However, it was also concluded that the discharges (data supplied by the MoD) are too low to explain this increase. It was pointed out that the distribution of childhood cancer around nuclear installations cannot be seen in a proper context due to a lack of information about national geographical pattern of the distribution of childhood cancer.
AWE Burghfield covers 265 acres and is located 5 miles north-east of Aldermaston near Reading in Berkshire. Established in 1954 as Royal Ordnance Factory (ROF), the facility is used for the final assembly for British nuclear weapons and the decommissioning and re-commissioning of older weapons. According to the MoD atmospheric discharges started in 1970 and consisted purely of tritium until 1987 (4x10³ - 6x10⁴ MBq/yr). Since 1987 85Kr has also been discharged. Liquid discharges began in 1962 and are of low activity similar to the AWE Aldermaston trade waste. They are discharged via the sewage works at the same point as the AWE trade waste.
The impact of both AWE facilities is investigated in Chapter 6.
1.4.4 AEA Winfrith
The Winfrith site in Dorset was developed by UKAEA in the mid 1950s. The main facility at Winfrith was the prototype Steam Generating Heavy Water Reactor (SGHWR) which was closed in 1991 and is now being decommissioned. Besides that several different kinds of low power (and zero power) reactors were operated but are all now closed and are being decommissioned. The discharge records are given in the Appendix A4.
1.4.5 COGEMA La Hague
CHAPTER 1
l'Energie Atomique (CEA) - which has conducted France's nuclear weapons testing and production program - and 11% of which is owned by the French national petroleum company Total. COGEMA is therefore wholly owned and operated by the French government. In 1966 the UP2 reprocessing plant started operation. This plant reprocessed metallic fuel until 1987. Oxide-fuel reprocessing began at UP2 in 1976. In 1994 new plant components increased the nominal capacity from 400 tonnes of fuel per year to 800 tonnes of fuel per year. In 1989 a new reprocessing plant known as UP3 was commissioned. It is designed to reprocess oxide fuel and has a nominal capacity 800 tonnes of fuel per year. A small scale reprocessing plant, the AT1 facility operated at La Hague between 1969 and 1984 to reprocess fast-reactor fuel. Some fast reactor fuel was also reprocessed at UP2 between 1979 and 1984. Mixed-oxide (MOX) fuel was reprocessed at UP2 in 1992 and 1998. The upgrade of the UP2 and the opening of the UP3 can be seen in an increase in the discharge between 1989 and 1995.
The discharge records are given in the Appendix A5.
1.4.6 The Chernobyl accident
CHAPTER 1
238
CHAPTER 1
CHAPTER 2
2. Methods used for the research
2.1. Separation of U and Pu from environmental samples 2.1.1 Dissolution methods
Complete dissolution (Option 1)
The soil sample was dried at 100°C and the weight was recorded. After grinding the sample was transferred into a furnace. The temperature was slowly increased to 600°C and then ignited for approximately 24 hours. 5g of ignited sample was combined with 7g of eutectic lithium borate flux (80% lithium metaborate, 20% lithium tetraborate; ICPH, France) along with tracers (233U - 236U double spike and/or 242Pu). The mixture was dried, mixed and transferred either to a grain-stabilised platinum-gold dish or a graphite crucible before fusion at 1200°C for approximately 20min. The melt was quenched in 75ml of deionised water in a 250ml beaker. A 4 cm diameter Pt lid was placed at the bottom of the beaker to dissipate heat and prevent the beaker from cracking. The Pt lid was removed after the fused mix had been poured into the beaker. The water was discharged and 30 ml of 8M HNO3 and 1ml of 0.2M polyethylene glycol was added to each beaker. The samples were transferred to a combined hot plate/magnetic stirrer and left overnight at 40°C under constant stirring to dissolve the glass. The sample was filtered under suction through a Whatman GF/C glass fibre filter mounted on top of a Whatman No. 540 filter funnel. After washing with approximately 10ml of 8M HNO3 and 10ml of deionised water the residue was discarded. The filtrate was acidified with 10ml concentrated nitric acid and 0.5 ml of concentrated HCl.
Aqua regia leaching (Option 2)
Aqua regia was added to the ignited sample in the weight proportion 10:1. The mixture was
CHAPTER 2
2.1.2 Chemical separation
Basic separation of U and Pu
Two ion-exchange columns were prepared for each sample. The first a 6cm high 0.7 cm internal diameter column with Eichrom anion exchange resin (100-200 mesh, 8% cross-linked), and the second a 2cm high x 0.7 cm internal diameter column containing Eichrom UTEVA resin. The UTEVA column was placed immediately below the anion exchange column and both columns were pre-conditioned with 10ml 8M HNO3. The sample was transferred to the anion exchange column and the eluent passed directly onto the UTEVA column. The two columns were washed with 20ml 8M HNO3 followed by 30ml of 3M HNO3, and then separated. The anion column was washed with 30ml 3M HNO3 followed by 25ml 9M HCl to remove thorium. Plutonium was then eluted with 50 ml of freshly prepared 1.2M HCl/H2O2 (50:1). The UTEVA column was washed with 10ml 3M HNO3 followed by 10ml 9M HCl. The uranium was eluted with 10ml 0.02M HCl.
Additional Purification of U
If the uranium was to be measured by TIMS the following additional purification was used: 10ml of concentrated HCl (12M) was added to the eluent from the UTEVA column to adjust the concentration to 6M. The solution was then loaded onto a 2x0.7cm internal diameter anion exchange column (Eichrom 100-200 mesh 8% cross-linked) pre-conditioned with 10ml 6M HCl and washed with 10ml 6M HCl. The U was eluted with 10ml H20 and the eluent evaporated to dryness in a PFA beaker.
Additional purification of Pu
The following additional purification is required in the following cases: 233
U was added and the plutonium is to be measured by alpha spectroscopy. Reason: The 233
Uhas a high specific activity and its alpha peak overlaps with the 242Pu tracer peak. High amounts of natural uranium are present in the sample and the plutonium is to be measured with MCICPMS. Reason: The 238U forms a hydride that interferes with the 239
Pu measurement.
CHAPTER 2
40ml 7.2M HNO3 and 15ml 9M HCl. Plutonium was then eluted with 25 ml of freshly prepared ammonium iodide reagent (0.1M NH4I/9M HCl). The eluent was evaporated to dryness and the residue was treated with concentrated HNO3 to decompose the excess NH4I.
Electrodeposition of Pu
The EDP (electrodeposition) cell was prepared by placing a new stainless steel disc into the base of the EDP cell, a new insert into the top of the EDP cell and screwing on the top. The cells were checked for any leaks by doing an initial test using distilled water. The dry residue from the purification was dissolved in 1ml of 10% hydrochloric acid. 5ml of 2% ammonium oxalate solution were added to the beaker and the solution was transferred to the electrodeposition cell. The beaker was washed with another 5ml of 2% ammonium oxalate solution that was then added to the electrodeposition cell and the cathode connection was attached. The platinum anode was lowered into the solution, the current was adjusted to 400 mA and electrodeposition was carried out for 100 minutes. The current and sample level in the cell were checked at regular intervals. The current was adjusted accordingly and the cell was topped up with water if the level dropped significantly. After 100 minutes of electrodeposition, a few drops of ammonia solution were added. Deposition was continued for another 30 seconds and then the power supply was disconnected. The cell was rinsed several times with water and the stainless steel disc was removed. The disc was washed with water again and dried on a hot plate. The disc was then counted on a EG&G Octete PC alpha spectrometer.
2.2. Blank values for different acid grades
CHAPTER 2
found. The same measurement was repeated in brand new PFA containers. This time a correlation between the U content and the acid grade could be seen. The results are shown in Table 2.1.
Technical grade
Analytical grade
Aristar grade
sub-boiled Aristar
2 times sub-boiled Aristar
HCl 55 0.573 0.567 0.133
HNO3 59 0.167 0.373 0.037 0.058
Table 2.1 Uranium content of different acid grades (Merck) measured by TIMS in pg/g
The measurement of the technical grade acids has errors up to 50% because of strongly fluctuating ion signals. This fluctuation is probably due to a high organic content. Analar and Aristar grade acids contain less than 1pg/g Uranium. Analar HCl and Aristar HCl contain the same amount of uranium within the errors of the measurement. Sub-boiling reduced the uranium blank by a factor of about 5 for both HCl and HNO3. A second sub-boiling does not show any further significant improvement. Besides the acids MQ water was also measured. The uranium value was below the detection limit of the measurement.
2.3. Gamma spectrometry of 137Cs 137
CHAPTER 2
Figure 2.1Decay scheme of 137Cs
Details Note
Model GCW 4523 Canberra
Type Coaxial one open end
Diameter 76 mm
Active volume 239 cc
Well depth 45 mm
Resolution FWHM (2.25 keV) 60Co (1332 keV)
Peak/Compton 46.5 : 1 "
[image:38.595.208.329.118.318.2]Efficiency 41.1 % "
Table 2.2 Typical detector specification and performance data of the gamma detector
2.4. Mass spectrometric measurements 2.4.1 Introduction
The instruments used are Inductively Coupled Plasma Mass Spectrometry (ICP-MS), Thermal Ionisation Mass Spectrometry (TIMS) and the Isoprobe Multi-Collector Inductively Coupled Plasma Mass Spectrometry (MC-ICPMS).
CHAPTER 2
Another disadvantage are beam fluctuations due to instabilities in the plasma. Because of these beam fluctuations and the poor peak shape, ICPMS is not suitable for precise isotopic ratio measurements. Using a MCN6000 nebuliser an overall efficiency of 0.045% can be achieved.
TIMS in contrast to ICPMS has stable beams and is commonly used for plutonium isotopic ratio measurements (e.g. Buesseler and Halverson, 1987). The instrument used is a single-focusing VG (Micromass) Sector 54 thermal ionisation mass spectrometer. The instrument is equipped with seven Faraday collectors and a Secondary Electron Multiplier/Daly detector (SEM) positioned behind the axial Faraday collector. Signals from the SEM are received by an EG&G® Ortec 9302 amplifier/discriminator and EG&G® Ortec 996 ion counter/timer. The main disadvantage in TIMS is a low ionisation efficiency of less than 0.1% and an overall efficiency of 0.002%. The ionisation efficiencies are further reduced by other matrix atoms. Therefore extremely good elemental separations are required. Another disadvantage is the time dependent mass fractionation due to small differences in the quantum states of the different isotopes, which is particularly large for small sample loads. Using 236U-233U double spike, the 238U/235U can be measured to a reproducibility of <0.2% (2sd) on nanogram loads of uranium (Croudace et al., 1999) Due to the lack of an internal fractionation correction and different ionisation behaviour the reproducibility in 240Pu/239Pu measurements is only 3% (2sd).
CHAPTER 2
[image:40.595.104.516.437.669.2]amounts of hydrogen. The detection system consists of Faraday collectors for simultaneous collection of ions and a Daly detector for high sensitivity ion analysis. The Daly detector is positioned behind a WARP (Wide Angle Retarding Potential) filter. This increases the abundance sensitivity by two orders of magnitude. For the WARP to be effective it is essential that the energy spread of the entering ions is reduced because its acceptance is restricted to 5500+/-1V. Such a small energy spread is provided by the TIMS and the Isoprobe but not by normal ICPMS. Using the MCN6000 nebuliser an overall efficiency of 0.8% is achievable. 238U/235U can be measured with a reproducibility of <0.2% (2sd) on the Isoprobe (Croudace et al, 2000). An advantage of a plasma source MS is that mass fractionation corrections can be carried out using a different element. The reason is that different elements of similar mass tend to have similar levels of ionisation and similar levels of mass fractionation. For example, the uranium fractionation factor can be applied to correct for isotopic fractionation of plutonium (Taylor et al, 2001). This element-to-element style of correction is not possible in TIMS because both, the evaporation from the filament, and the ionisation vary significantly between elements.
CHAPTER 2
2.4.2 Loading techniques for Thermal Ionisation Mass Spectrometry (TIMS)
Thermal ionisation sources are based on the fact that the particles evaporated from a heated metal surface contain ions in addition to the neutral particles. The ratio of the number of evaporated ions n+ to the number of evaporated neutral particles n is called the efficiency. The Saha-equation gives the following proportionality:
−
∝
+
kT
I
W
n
n
exp
where k is the Boltzmann constant, W the work function of the metal, I the ionisation potential and T the temperature. In our case (W-I) is negative. Hence the temperature has to be high to get a reasonable efficiency. On the other hand the sample will evaporate very quickly when T becomes too high. Therefore a compromise must be made between the efficiency of the ionisation and the length of time for which the sample lasts. Another limit of the temperature is given by the melting point of the filament. Besides the temperature the efficiency can be influenced by the choice of the filament material as one can see from the equation above. The material should be refractory and possess a high work function. The common filament material for U and Pu is carburized rhenium. Carbon acts as a reducing agent, promoting the production of elemental ions at the expense of oxide species (Buesseler and Halverson 1987; Kelley and Robertson 1985). Besides that, carbon can enhance or reduce the work function and change the Pu ion emission characteristics. The work function of pure rhenium is 4.96eV. If the carbon is completely dissolved in the rhenium the work function is 0.25 V higher, but as soon as graphite layers on the filament surface are formed the work function decreases by 0.9 V with respect to pure rhenium (Pallmer et al, 1980). Kelley and Robertson (1985) observed a useful ion signal of small Pu quantities only if the carbon saturation temperature of the filament was exceeded. Hence supersaturated rhenium is not suitable as a filament material. The saturation temperature is the temperature at which carbon redissolves into the filament. It can be determined by an irregularity in the filament temperature respond to the current passed through (Gordon, 1983).
CHAPTER 2
Kelley and Robertson, 1985; Buessler and Halverson, 1987). The resin bead has the advantage that quantitative high amounts of Pu can be loaded nearly as a point source. In addition the heated and pyrolysed resin bead serves as a carbon source. The carbon dissolves into the rhenium upon heating. However, the amount of carbon might not be sufficient to enhance the work function and an additional carburization step might be required. Very precise measurements have been made by employing a porous emitter (Smith and Carter, 1981) or by overplating the filament with platinum (Perrin et al., 1985). These two methods have been shown to enhance the lifetime of the signal and reduce fractionation.
238
U/235U isotopic ratios can be measured in 5g soil with an overall precision of 0.2% at the 99.73% uncertainty level using a solution load onto a carbon coated filament. (Taylor et al., 1998). However, Pu concentrations are much smaller and the sample loading technique becomes more important. The different loading techniques have been investigated in this study using approximately 20pg 239Pu and the results are given in Table 2.3. The best method was the overplating by platinum. The measured ratio for Site 112 (an Irish Sea sediment contaminated with Pu isotopes) was 240Pu/239Pu=0.227 +/-0.6%(SdErr).
Loading technique
239Pu
counts/s
Duration
of signal Comments
Solution load with
aquadag 7000 <5 min
duration of signal too short for measurement
Resin bead 1000 >30min potential loss of bead during decomposition
Rhenium sucrose
overlayer 500 >30min
no reliable measurement due to strongly fluctuating signal
Overplating with
platinum 1000 >30min best investigated loading technique
CHAPTER 2
2.4.3 Measurement of plutonium isotopic ratios using Isoprobe-MCICPMS
The measurement of plutonium isotopic ratios using the Isoprobe MC-ICPMS is published in Taylor et al. (2001; see Appendix). In the following some details that might be useful for users of the Isoprobe and some additional results are presented.
Sensitivity/Backgrounds/Blanks
The day before each measurement period the nebuliser, torch and cone were cleaned. The night before each measurement day the Hexapole was baked. On the measurement day the instrument was first tuned for optimum sensitivity using a 250ppt natural uranium solution. The 238-voltage of this solution on the Faraday detector ranges between 0.05V-0.13V for an extract setting of 40%. The strong variation in sensitivity is due to machine performance and variation in solution uptake by the MCN 6000 nebuliser. On some measurement days the exchange of the nebuliser tube increased the sensitivity by a factor 2. Backgrounds are determined using 2% HNO3. Background signals were found at all masses from 239 through 242. As a typical example the backgrounds from the 25 August 2001 are shown in Table 2.4 for an extract setting of 40%. On this day the voltage of the 250ppt natural uranium solution was 0.1V. Both background and signal decrease by lowering the extract. However the functional relation between background and extract is different from the functional relation between signal and extract. Hence it is sometimes useful to optimise the signal-background-ratio by changing the extract.
n=20 Average signal in µV Stdev in µV
239Pu 0.81 0.35
240Pu 0.78 0.38
242
Pu 0.64 0.30
Table 2.4 Typical backgrounds for an extract setting of 40%. The voltage of the 250ppt natural uranium solution was 0.1V (400V/ppm 238U).
The 240Pu/239Pu could be determined in two ways, either by subtracting a method blank or by subtracting the 2% HNO3 acid blank. The
240
CHAPTER 2
in the method blank is 0.8. It can be seen that for low concentrations the method blank corrected 240Pu/239Pu can be significantly different from the acid-blank-corrected 240Pu/239Pu. A low method blank (~0.5ppq) was achieved by dissolving the dry residue first in aqua regia, taking the sample to dryness again and repeating the same procedure with nitric acid.
For some samples this procedure reduced the method blank by a factor of 5, which suggests that organic residues are responsible for high method blanks.
Figure 2.3 Method blank corrected 240Pu/239Pu versus sample concentration. The acid
blank corrected 240Pu/239Pu (true ratio) of the sample is 0.2. The assumed concentrations of the method blank are 0.5ppq, 1ppq and 2ppq. The assumed 240Pu/239Pu in the method blank is 0.8.
Standards and 242Pu/239Pu measurement
In Taylor et al. (2001) the reproducibility of the isotopic ratio measurement is determined from an in-house sediment ‘standard’, called Site112 (Irish Sea Sediment) and the accuracy is tested on the standard UK-Pu-5 (Table 2.5). In addition to those measurements the U.S. standards NBL122, NBL126 and NBL128 from the Brookhaven National Laboratory are measured (Table 2.6). The 240Pu/239Pu measurement of those standards expands the range where the method proves to be accurate. The measurement confirms that 240Pu/239Pu ratios between 0.01 and 0.13 can be accurately measured. This range is especially important for the detection of weapons grade plutonium in the environment. The NBL-standards also confirm the accuracy of the 242Pu/239Pu measurement for ratios around one, but for the rather extreme NBL122 standard about twice the certified value of 0.002 is measured. The error in the
0,17 0,175 0,18 0,185 0,19 0,195 0,2
0,1 0,2 0,3 0,4 0,5 0,6 0,7 0,8 0,9 1
239
Pu (ppt)
2
4
0 P
u
/
2
3
9 P
u
m
b
-c
o
rr
e
c
te
d
CHAPTER 2
measurement of the 242Pu/239Pu only appears if the ratio was determined using the sequence 240
Pu - 239Pu - 242Pu (see Taylor et al, 2001). The 242Pu/239Pu in the NBL122 was accurately measured, if the ratio was calculated from the first and second cycle of the sequence 242Pu - 239
Pu - 242Pu. In this research the only case where 242Pu/239Pu ratios of less than 1 were determined is in the Wyre sediment core (see Chapter 4). Some of the samples were re-measured using the sequence 242Pu - 239Pu - 242Pu. Figure 2.4a shows that for 242Pu/239Pu below 0.01 the ratios from the two cycles start to deviate. The deviation does not correlate with the voltage (Figure 2.4b). However, the deviation is not random, but seems to follow a simple function.
Measured 240Pu/239Pu Certified 240Pu/239Pu
0.5 ppt 5-10ppt
Site112 0.2264 +/- 0.0024* 0.2263 +/-0.0021 (n=13)
0.2262 +/-0.0007 (n=22)
UK-Pu-5 0.9662 +/- 0.0011 - 0.9645 +/- 0.0013 (n=7)
Measured 242Pu/239Pu Certified 242Pu/239Pu
0.5 ppt 5-10ppt
Site112 - 0.0.0095 +/-0.0008
(n=13)
0.0095 +/-0.0002 (n=7)
UK-Pu-5 0.9662 +/- 0.0011 - 1.0252 +/- 0.0034 (n=7)
[image:45.595.119.491.517.718.2]*not certified, but assumed to be accurate from high concentration measurements by TIMS
Table 2.5 240Pu/239Pu and 242Pu/239Pu for the Site112 sediment and UK-Pu-5
Measured 240Pu/239Pu Certified 240Pu/239Pu
0.5 ppt 5ppt
NBL122 0.1320 0.1318 +/-0.001 (n=4)
0.1321 +/-0.0001 (n=3)
NBL 126 0.0209 0.0211
(n=1) 0.0204 (n=1)
NBL 128 0.0007 - 0.0007 (n=1)
Measured 242Pu/239Pu Certified 242Pu/239Pu
0.5 ppt 5ppt
NBL122 0.0021 0.0040 +/-0.001 (n=4)
0.0046 +/-0.0004 (n=3)
NBL 126 <5x10⁻⁶ - -
NBL 128 1.00106 - 0.9996 (n=1)
CHAPTER 2
Figure 2.4 Dependance of the 242Pu/239Pu on the measurement cycle. Cycle i (i= 1, 2, 3) is defined as the 242Pu/239Pu where the 242Pu from the cycle i is used. (a) Cycle3/Cycle1 vs Cycle1 (b) Cycle3/Cycle1 vs voltage of 239
2.4.4 Static measurements of the 238U/235U using Faraday collectors (used for Rothamsted grass)
Uranium masses 233, 234, 235, 236 and 238 were measured statically using Faraday detectors. A natural uranium standard extracted and purified from CCRMP-BL1 was run between each sample. All ratios were corrected for low-mass tailing of the other uranium peaks. The factors for the tailing correction are given in Table 2.7 and were determined by normalising the measured ratio for the BL1-standard to the natural 238U/235U of 137.88. These factors are lower than those reported by Thirlwall (2001). Both samples and standard were spiked with a 233U-236U double spike to correct for mass fractionation (Croudace et al, 1999). In addition measured compositions are corrected for the 238U and 235U in the double spike. (238U/235U=4, Taylor et. al, 2001) The calculations are shown in Appendix M.2. Finally the ratio of each sample is externally corrected by normalising to the mean of the two adjacent standards. The voltage of the method blanks was between 0.2V and 0.5V on 238 and the 238U/235U appears to be natural. However, the samples have been diluted to approximately the same concentration as the BL1-standard. Applying this dilution to the method blank it yields a 238-voltage of 0.02V – 0.05V. That is a factor 40-100 smaller than the lowest measured sample. Since the 238U/235U in the method blank is natural, it is likely that the uranium is due to small amounts of contamination in the laboratory. The method blank shows that the contamination in the lab is small and can be neglected for those samples. The 238U/235U of all measured samples and standards is plotted versus the signal intensity in Figure 2.5. A correlation between the measured ratio and the signal intensity
242
Pu/239Pu
0 0,5 1 1,5 2 2,5
0,001 0,01 0,1 1 10 100 1000
Cycle1
C
y
c
le
3
/C
y
c
le
1
242
Pu/239Pu
0 0,5 1 1,5 2 2,5
0 0,0002 0,0004 0,0006 0,0008 0,001
239V
C
y
c
le
3
/C
y
c
le
CHAPTER 2
could not be observed. The 3 s.d. uncertainty has been determined from all standards that were run during the analysis of the samples. Only samples outside the 3 s.d. limit are considered to deviate from natural uranium.
Mass units (amu) light peak/heavy peak
1 0.000012
2 0.000009
3 0.000004
4 0.000002
5 0.000001
Table 2.7 Correction factors for peak tailing to the low mass side
Figure 2.5 238U/235U atomic ratio vs. 238U voltage
2.4.5 Static Faraday-Daly measurement of 238U/235U (used for alpine ice samples)
The 238U/235U is measured statically with mass 235 on the Daly and 238 on the Faraday detector. The measurement of the samples is made using a natural uranium standard run between two samples. Standard solutions are prepared over the concentration range of the sample solutions and after each sample a standard close to the sample concentration was measured. The measured 238U/235U depends on the concentration of the solution. A typical
136,5 136,8 137,1 137,4 137,7 138 138,3
2 3 4 5 6 7 8 9 10
238
U volts
2