© 2019, IRJET | Impact Factor value: 7.211 | ISO 9001:2008 Certified Journal
| Page 3012
BEHAVIOR OF ULTRA HIGH PERFORMANCE CONCRETE (UHPC) AND
NORMAL CONCRETE (NC) COLUMNS UNDER ECCENTRIC LOADS
Ahmed Abd El-Azim A.
1, Hany A. El-Ghazaly
2, Sally Nabil A
31
Associate Professor, Civil Engineering Dept.
2Professor, Civil Engineering Dept.
3Post Graduate Student, Civil Engineering Dept.
Faculty of Engineering, Fayoum University, Fayoum, Egypt
---***---Abstract -
In this study,mechanical properties of Ultrahigh Performance Concrete (UHPC (and Normal Concrete
(NC) are presented. The average compressive strengths of UHPC and NC were 1200 kg/cm2, and 380 kg/cm2 respectively. The main purpose of this study is to compare between the behavior of NC columns, UHPC columns and Compound columns under eccentric loads. In this way, The Nine reinforced concrete columns were divided into three groups. Group (1) is the normal concrete (NC), group (2) is the Ultra high Performance Concrete (UHPC), and group (3) is the compound concrete. Every group were tested under axial loading, eccentricity (e=0.5b) column, and big eccentricity (e=b) where b is width for each column. The results showed that the cracks developed gradually and the failure was progressive in NC columns and more ductile. In contrast, sudden brittle behavior of UHPC columns when capacity load reached with sudden covers Spalling. The failure of the COMC columns was sudden with a very little warning and only a few crunches could be heard.
Key Words
:
Ultra High Performance Concrete;Compound columns; NC columns; special dolomite.
1. INTRODUCTION
UHPC is the material which has a compressive strength up to 1500 kg\cm2 as the description of the US department of transportation. UHPC has low water to cement ratio and high range water reducing agents to make the concrete workable. [1]
Typical tensile strength values for UHPC are in the range 71.33–112kg/cm2. UHPC Without fibers has a very brittle failure in tension.[2] .Post-cracking tensile stress through the composite action between the concrete and fibers is resisted by Steel fiber reinforced concretes, including chemical and mechanical bonding at the interface between the concrete and fibers [3]. The effectiveness of the fiber reinforcement across micro cracks spreading in the cementitious matrix subjected to tensile stresses governs the cracking mechanism [4].
Recently, Jiangtao Yu and Kequan Yu et al developed a new kind of ECC (ultra-high deformability cementitious composite, UHDCC) which has a maximum tensile strength reaching 200 kg\cm2 and the tensile capacity is in the
range from 8% to 13%, using high strength and high Young’s modulus PE (polyethylene) fibers [5]. Almost, UHPC is mixed in any conventional concrete mixer. UHPC requires increased energy input if it is compared with conventional concrete, so mixing time will be increased. This increased energy input because combination has a reduced coarse aggregate and low water content. [6]
Applications of UHPC have only a limited number. The design and use of the material has not yet been streamlined .As a result, the cost is still noticeably higher than that of conventional concrete. The producers have an expectation that as UHPC becomes more common in practice, the cost of use will decrease and they suggest that savings will be achieved over the life cycle when compared to conventional solutions. [7]. Karmout, M., Arafa, M and Shihada, S. studied Mechanical properties of UHPC produced in Gaza strip. [8]
Popa, M., Zagon, R. and Constantinesu, H., Bolca, G.
studied the behavior of the columns of ultra-high
performance and normal concrete [9]. Venkatesh Babu Kaka, Jinsup Kim and Shih-Ho Chao (2016) made a research to comparison between two simply supported beams, one made of reinforced concrete (RC) and one made of UHP-FRC in flexural strength. [10]
2. MATERUALS AND METHODS
2.1. Materials
Properties of materials used are shown in table 1,2,3,4,5, and 6
Table -1: Properties of Coarse Aggregate (dolomite) Type of Dolomite
Properties Dolomite Local
Size(1) Local Dolomite Size(0) Special Dolomite 2.5 2.5 2.6 Specific Gravity 1.448 1.559 1.472 Volume
Weight (t\m3)
2.5% 2.5 %
© 2019, IRJET | Impact Factor value: 7.211 | ISO 9001:2008 Certified Journal
| Page 3013
Table -2: The Properties of Silica FumeType
property
Color /appearance
grey powder
Specific Gravity
2.2
Table -3: The Physical and Chemical Properties of Quartz Powder
Type property
Appearance Granular powder
Color white
PH 6-8
Specific Gravity 2.65
Table -4: Properties of Fine Aggregate (sand)
Specification Limits Measured Values Properties 2.5-2.7 2.5 Specific Gravity 1.4-1.7 1.7 Volume Weight (t\m3)
2-2.73 2.57
Fineness Modulus
<3% by weight 0.8%
Percentage of Dust and Fine
[image:2.595.328.543.389.511.2]Material (By Weight)
Table -5: Physical and Mechanical Properties of CMI.
Properties Measured Values Surface area of particles
(cm2/gm.) 2920
Water standard 28%
Volume change(mm) 1.0
Specific gravity 3.15
Setting time initial final 145 min 3.1 hr.
Compressive strength
7 days 27.4
28 day 36.9
28 day 36.9
Table -6: The Physical and Chemical Properties of Sikament –NN##
2.2. Concrete Mix Proportions
Two mixes of concrete (NC, UHPC) were produced to cast three types of columns. Table 7 shows NC mix proportions.
Table- 7: One Cubic Meter Components of NC Mixture
Materials Quantity
Cement (Kg /m3) 350
Sand (Kg /m3) 687
local dolomite size(0) (Kg /m3) 549 local dolomite size(1) (Kg /m3) 549
Water (Kg /m3) 175
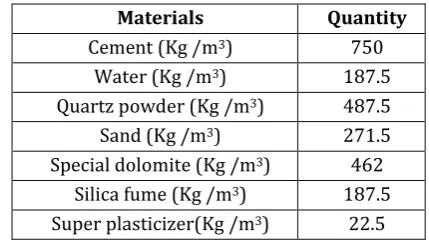
About twenty UHPC mixes were made. Different amounts of cement were used in mixture as 700, 750 and 800 kg per cubic meter. Different types of dolomite were used as local dolomite size (0), local dolomite size (1), and special dolomite. The best mixture which was contained 750 kg cement per cubic meter and special dolomite. The proportions which were used in preparing the best UHPC mixture for one cubic meter are shown in Table -8. Table -8: One Cubic Meter Components of UHPC Mixture
Materials Quantity
Cement (Kg /m3) 750 Water (Kg /m3) 187.5 Quartz powder (Kg /m3) 487.5 Sand (Kg /m3) 271.5 Special dolomite (Kg /m3) 462
Silica fume (Kg /m3) 187.5 Super plasticizer(Kg /m3) 22.5
2.3 Samples and Experimental Program
Nine reinforced concrete columns were cast. Columns were cast in three groups. The first group was made of normal concrete, the second group was made of ultra- high performance concrete, and the third group was compound columns which were made from NC and UHPC internal core. The columns had a square cross section and a clear length 130cm. Table -9 shows cross section for columns.
The normal concrete specimens were named group (1) which was consisted of three columns (NC1, NC2, and NC3). The UHPC concrete specimens were named group (2) which was consisted of three columns (UHPC1, UHPC2, and UHPC3) .The compound concrete specimens were named group (3) which was consisted of three columns (COMC1, COMC2, and COMC3).
Type Property
Chemical base Naphthalene formaldehyde sulphonate
Color /appearance Brown liquid
[image:2.595.41.276.478.619.2]© 2019, IRJET | Impact Factor value: 7.211 | ISO 9001:2008 Certified Journal
| Page 3014
Table -9: Cross Section for Columns.Group Cross Section
NC columns (18*18)cm2 (with 2 cm concrete cover from each side)
UHPC columns (9*9) cm2 (with 1 cm concrete cover from each side)
COMC columns
(18*18) N.C (with (6*6) UHPC internal core with 2 cm concrete
cover from each side)
All columns had identical internal steel reinforcement which was designed according to minimum requirements. Four 10mm deformed bars with nominal tensile strength 3600kg/cm2 were provided as longitudinal reinforcement. 8 mm bars with nominal tensile strength 2800 kg/cm2 were provided as transversal reinforcement with 10cm and 15 cm spacing . Figures 1, 2, 3, 4, 5 and 6 show concrete dimension and details of reinforcement for all columns.
Figure -1: Reinforcement Details for Axially Loaded Columns (NC1, UHPC1 and COMC1)
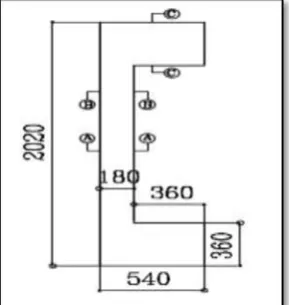
[image:3.595.352.531.56.283.2]Figure -2: Concrete Dimension for Eccentrically Loaded Columns (NC2, NC3) and (COMC2, COMC3)
[image:3.595.345.534.325.697.2]Figure -3: Reinforcement Details for Eccentrically Loaded Columns (NC2, NC3) and (COMC2, COMC3)
Figure -4: Cross Section for (COMC2, COMC3)
[image:3.595.68.247.361.535.2] [image:3.595.85.230.579.732.2]© 2019, IRJET | Impact Factor value: 7.211 | ISO 9001:2008 Certified Journal
| Page 3015
Figure -6: Reinforcement Details for EccentricallyLoaded Columns (UHPC2 and UHPC3)
2.4. Experimental Tests
Compression tests were carried out on 100 mm cubes, splitting tensile test carried out on 100X200 mm cylinders, and flexural test carried out on 10X10X50 mm beams using a 2000 KN compression machine. Compressive strength were measured at the ages of 7, and 28 days, and splitting tensile strength were measured at the age of 28 days to determine mechanical properties of concrete.
The Nine reinforced concrete columns were divided into three groups. Group (1) is the normal concrete which was consisted of three columns (NC1, NC2, and NC3). Group (2) is the UHPC concrete which was consisted of three columns (UHPC1, UHPC2, and UHPC3). Group (3) is the compound concrete which was also consisted of three columns (COMC1, COMC2, and COMC3).
[image:4.595.309.548.56.272.2]Every group were tasted under axial loading, eccentricity (e=0.5b), and big eccentricity (e=b) where b is width for each column. Columns were tasted until failure by using loading frame. Figure-7 shows loading frame. Linear variable displacement transformer (LVDT) is used to measure lateral deflection due to loading. The horizontal (LVTD) is placed at the mid –height of the column during loading by loading jack (120 ton capacity). LVDT makes a relationship between load and corresponding lateral deflection. LVDT presents this relationship as a curve between load and mid- height lateral deflection.
Figure -7: Loading Frame.
3. RESULTS AND DISCUSSION
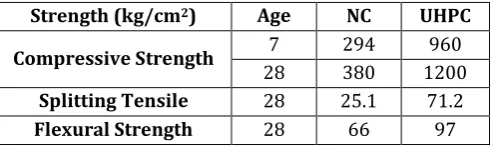
[image:4.595.316.563.448.523.2]Results of compressive strength, splitting tensile strength, and Flexural Strength were shown in table 10. Compressive strength at 7 days and 28 days for UHPC was higher than compressive strength for NC by 224.3% and 215.8% respectively, tensile strength at 28 days for UHPC was higher than tensile strength for NC by183.2% and Flexural strength at 28 days for UHPC was higher than flexural strength for NC by 47.0%.
Table-10: Results of Strength for Concretes Types Strength (kg/cm2) Age
days
NC UHPC
Compressive Strength 7 294 960
28 380 1200
Splitting Tensile Strength
28 25.1 71.2
Flexural Strength 28 66 97
3.1 Results of Columns
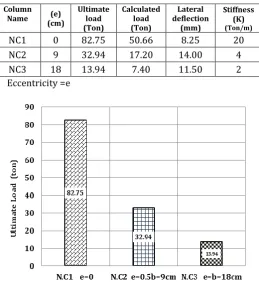
3.1.1 Results of Group (1)The load carrying capacity and the lateral deflection of the three samples (NC1, NC2, and NC3) were obtained, and presented in Table -11. Increase in load eccentricity by 50% and 100% leads to decrease in normalized load capacity by 60% and 83% respectively. By increasing the load eccentricity the load decreases where the lateral deflection has no relation with the eccentricity. Figure -8 shows ultimate load carrying capacity of group (1) and Figure -9 shows the lateral deflection of group (1). Figure -10 shows the load curve versus the lateral deflection of group (1).
© 2019, IRJET | Impact Factor value: 7.211 | ISO 9001:2008 Certified Journal
| Page 3016
by 50% and 100% leads to decrease in stiffness by 80% and 90% respectively. Figure -11 shows the stiffness of group (1)
[image:5.595.312.550.63.506.2]Column specimens exhibited a gradual ductile failure mode. Micro cracks appeared during loading which increased by increasing the load till reached to its ultimate failure then load started to decrease while concrete had to maintain consistency during failure. As shown in Figures -12.
Table -11: Results of Group (1) Normal Concrete (NC) (Cross Section Area of Column 324(18*18)(cm2))
Column
Name (cm) (e) Ultimate load (Ton)
Calculated load (Ton)
Lateral deflection
(mm)
Stiffness (K)
(Ton/m)
NC1 0 82.75 50.66 8.25 20
NC2 9 32.94 17.20 14.00 4
NC3 18 13.94 7.40 11.50 2
Eccentricity =e
[image:5.595.32.564.191.778.2]Figure -8: Load Capacity of Group (1) at Different Eccentricity
Figure -9: Lateral Deflection of Group (1) at Different Eccentricity.
Figure -10: Relation Between Load and Lateral Deflection for Group (1)
Figure -11: Stiffness of Group (1) at Different Eccentricity
NC1 NC2 NC3
Figure -12: Failure Mode of group (1)
3.1.2 Results of Group (2)
[image:5.595.29.289.254.540.2]© 2019, IRJET | Impact Factor value: 7.211 | ISO 9001:2008 Certified Journal
| Page 3017
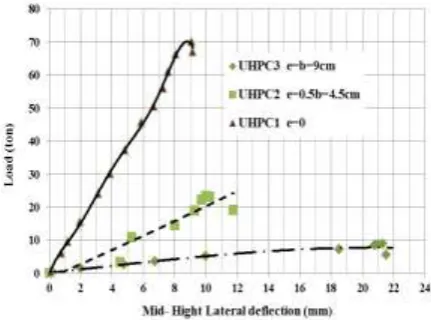
eccentricity by 50% and 100% leads to decrease in normalized load capacity by 66.6% and 87.3%. By increasing the load eccentricity the load decreases where the lateral deflection has no relation with the eccentricity. Figure -13 shows the load carrying capacity of group (2) and Figure -14 shows the lateral deflection of group (2). Figure -15 shows the load curve versus the lateral deflection of group (2).
Stiffness was calculated for each column by approximate method from the load–deflection curve at elastic stage for a unit displacement. It is observed that increase in load eccentricity by 50% and 100% leads to decrease in stiffness by 61.25% and 93.75% respectively. Figure-16 shows the stiffness of group (2).
[image:6.595.318.559.58.273.2]Failure mode of columns UHPC was considered a compression failure. Compression failure is a crushing failure that occur when the applied stress exceeded the allowable stresscatastrophic brittle behavior when peak load reached and small mid height displacement while concrete had a small crushing during failure. As shown in Figures -17.
Table -12: Results of Group (2) UHPC (Cross Section Area of Column 81(9*9)(cm2))
Column
Name (cm) (e) Ultimate load (Ton)
Calculated load (Ton)
Lateral deflection
(mm)
Stiffness (K)
(Ton/m)
UHPC1 0.0 70.30 41.60 9.17 8.1
UHPC2 4.5 23.44 15.50 11.75 3.1
UHPC3 9.0 8.88 6.80 21.50 0.5
Eccentricity =e
Figure -13: Capacity Load of Group (2) at Different Eccentricity
[image:6.595.327.543.323.483.2]Figure -14: Lateral Deflection of Group (2) at Different Eccentricity
Figure -15: Relation between Load and Lateral Deflection for Group (2)
[image:6.595.32.289.402.674.2]© 2019, IRJET | Impact Factor value: 7.211 | ISO 9001:2008 Certified Journal
| Page 3018
[image:7.595.319.558.58.267.2]UHPC1 UHPC2 UHPC3
Figure -17: Failure Mode of group (2)
3.1.3 Results of Group (3)
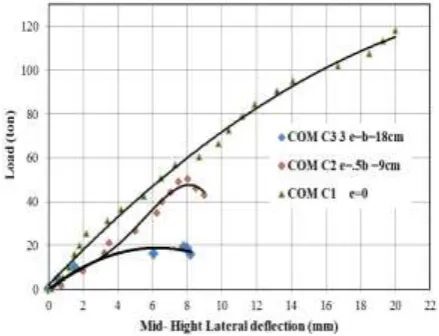
The load carrying capacity and the lateral deflection of the three samples (COMC1, COMC2, and COMC3) were obtained, and presented in Table -13. Increase in load eccentricity by 50% and 100% leads to decrease in normalized load capacity by 57.49% and 83.73%. By increasing the load eccentricity the load decreases whereas the lateral deflection has no relation with the eccentricity. Figure -18 shows the load carrying capacity of group (3) and Figure -19 shows the lateral deflection of group (3). Figure -20 shows the load curve versus the lateral deflection of group (3).
Stiffness was calculated for each column by approximate method from the load –deflection curve at elastic stage for a unit displacement .It observed that increase in load eccentricity by 50% and 100% leads to decrease in stiffness by 14.28% and 31.42% respectively. Figure -21 shows the stiffness of group (3).
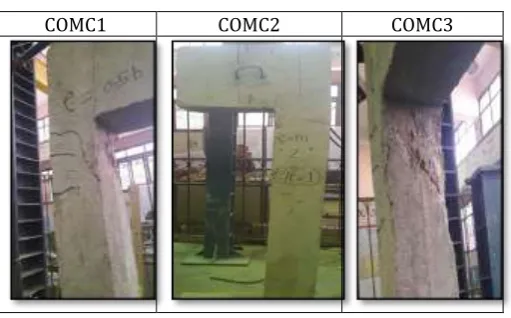
Failure mode of COMC columns was considered compression failure. The behavior of the “compound columns” was hard to record. Since the occurrence of the first crack and the failure of the column it was only a very short period of time. Spalling of the NC layer leads to buckling, after yielding in compression. Figure-22 shows failure mode of group (3). The failure of the columns was sudden with a very little warning, only a few crunches could be heard.
Table -13: Results of Group (3) COMC (Cross Section Area of Column 324(18*18)(cm2))
Column
Name (cm) (e) Ultimate load (Ton)
Calculated load (Ton)
Lateral deflection
(mm)
Stiffness (K)
(Ton/m)
COMC1 0 118.1 61.00 20.75 7.0
COMC2 9 50.2 19.92 9.00 6.0
COMC3 18 19.2 9.20 8.20 4.8
[image:7.595.323.538.313.483.2]Eccentricity =e
[image:7.595.322.542.549.717.2]Figure -18: Capacity Load of Group (3) at Different Eccentricity
Figure -19: lateral deflection of Group (3) at Different Eccentricity
© 2019, IRJET | Impact Factor value: 7.211 | ISO 9001:2008 Certified Journal
| Page 3019
Figure -20: Stiffness for Group (3)COMC1 COMC2 COMC3
Figure -22: Failure Mode of group (3)
3.2 Discussion
The UHPC column was designed to carry the same load of the NC column with the same value of longitudinal reinforcement but normal concrete had a higher compressive strength than which was calculated. However, UHPC column had a half cross section of NC column with the same reinforcement. Load capacity of UHPC1 was satisfied about 85% of the NC1 capacity load. The difference between experimental capacity load and calculated load was considered as a factor of safety. The factor of safety of COMC1 column was 94% of the calculated load but the factors of safety of UHPC1 and NC1 were 63 % and 69% of calculated load respectively. Stiffness of column NC1 was higher than stiffness of COMC1 because NC1 failed much earlier than COMC1.
Capacity load of compound column COMC2 was higher than capacity load of NC2 by 52 % . UHPC2 column achieved about 71% from capacity load of NC2 column with a half section of the NC2 column and with the same reinforcement. The difference between experimental capacity load and calculated load was considered as a factor of safety .The factor of safety of COMC2 column was 152% of the calculated load but the factors of safety of UHPC3 and NC3 were 92% and 51% of calculated load
respectively. Stiffness of column COMC2 was higher than stiffness of NC2 because NC2 failed much earlier than COMC2.
Capacity load of compound column COMC3 was higher than capacity load of NC3 by 43% .UHPC3 column achieved about 64% from capacity load of NC3 column with a half section of the NC3 column and with the same reinforcement. The difference between the experimental capacity load and the calculated load was considered as a factor of safety .The factor of safety of COMC3 column was 109% of the calculated load and the factors of safety of UHPC3 and NC3 were 31% and 91% of calculatedload respectively. Stiffness of column COMC3 was 2.4 times stiffness of NC3 .Stiffness of NC3 was about 4 times of stiffness of UHPC3.
4. CONCLUSIONS
Based on the experimental results presented in this study, the main conclusion remakes are as the follows: 1- It is observed that by adding UHPC core to the NC
column, it provides the specimen capacity to carry higher loads and increase the ductility. However, the compound column and the NC column had the same cross section and the same value of longitudinal reinforcement, load capacity of COM1 was 1.42 times load capacity of NC1 column.
2- The cracks developed gradually. The failure was progressive in NC columns and more ductile.
3- In contrast, sudden brittle behavior of UHPC columns when capacity load reached with a sudden covers spalling.
4- The behavior and the increasing opening of cracks of the NC columns were easy to record but the behaviors of the COMC columns were hard to record. Since the occurrence of the first crack and the failure of the column it was only a very short period of time. The failure of the COMC columns was sudden with a very little warning, only a few crunches could be heard. Noises of cracking were observed before the sudden failure. Spalling of the NC layer leads to buckling, after yielding in compression.
5- Also, it was noticedthat stiffness of column NC1 was higher than stiffness of COMC1 because NC1 failed much earlier than COMC1, Stiffness of column COMC3 was higher than stiffness of NC3 by 140% and stiffness of NC3 was about 4 times stiffness of UHPC3.
© 2019, IRJET | Impact Factor value: 7.211 | ISO 9001:2008 Certified Journal
| Page 3020
5. REFERENCES
[1] Hafeez, M., "Mechanical Properties of Ultra High Strength Fiber Reinforced Concrete", MSc in civil engineering, University of Akron, May 2015.
[2] Fehling, E., Schmidt, M., frohlicl, S., Walraven, J., Leutbecher, T.," Ultra-High Performance Concrete UHPC"Fundamentals, Design, Examples"2014. [3]El-tawil.Sh., Liu, Z., and Hansen,W. ," Effects of silica
powder and cement type on durability of UHPC ,"
first international interactive symposium on UHPC,2016.
[4] Duque. L.F.M., and Gray Beal. I.B., "Fiber reinforcement influence on the tensile response of UHPFRC, "first international interactive symposium on UHPC, 2016.
[5] WANG,Y., YU,J.,XU,Q.,” A General Reinforcement Developed To Change Hydraulic and Alinite Inorganic Materials Into Ultra-High Ductile
Composite “,2nd International Conference on UHPC
Materials and Structures (UHPC2018-China), November 2018.
[6] Ortiz, J.P. ," UHPC Astate-of –Art Report for the
bridge community,"FHWA-HRT-13-060, June 2013.
[7] Moallem, M.R.," Flexural Redistribution in Ultra-High
Performance Concrete Lab Specimens," the faculty
of the Russ College of Engineering and Technology, Ohio University, 2010.
[8] Karmout, M., Arafa, M., Shihada, S. ," Mechanical properties of UHPC produced in Gaza strip," MSc in Civil Engineering, Islamic university of Gaza, 2009.
[9]-Popa, M., Zagon, R., Constantinesu, H., Bolca, G., "The Behavior of the Columns of Ultra-High Performance and Normal Concrete" Tradition and Innovation - 60 Years of Constructions in Transylvania, june2015.
[10] Babu Kaka,V.,Kim,J.,Ho ChaoSh.," Formulating Constitutive Stress-Strain Relations for Flexural Design of Ultra-High-Performance Fiber-Reinforced
Concrete” First International Interactive Symposium