Look-a-like: A Fast Content-based Image Retrieval
Approach using a Hierarchically Nested Dynamically
Evolving Image Clouds and Recursive Local Data Density
Plamen Angelova, Pouria Sadeghi-Tehran1
aSchool of Computing and Communications, Data Science Group,
Lancaster University, United Kingdom, LA1 4WA
Abstract
The need to find related images from big data streams is shared by many pro-fessionals, such as architects, engineers, designers, journalist, and ordinary people. Users need to quickly find the relevant images from data streams generated from a variety of domains. The challenges in image retrieval are widely recognised and the research aiming to address them led to the area of CBIR becoming a ’hot’ area. In this paper, we propose a novel com-putationally efficient approach which provides a high visual quality result based on the use of local recursive density estimation (RDE) between a given query image of interest and data clouds/clusters which have hierarchical dy-namically nested evolving structure. The proposed approach makes use of a combination of multiple features. The results on a data set of 65,000 im-ages organised in two layers of an hierarchy demonstrate its computational efficiency. Moreover, the proposedLook-a-like approach is self-evolving and updating adding new images by crawling and from the queries made.
Keywords: recursive density estimation (RDE), dynamically evolving hierarchy of data clouds, content-based image retrieval (CBIR)
1. Introduction
The last decade has witnessed an enormous growth in the amount of dig-ital images on Internet (it was recently estimated that the number of images on the Web is over 100 Billion [1], a figure which some observers consider to
URL: [email protected](Plamen Angelov),
be an underestimate). Everyday millions of new images are being generated creating an enormous multi-dimensional data stream. They play an im-portant role in the fields of entertainment, education, advertising, etc. For instance, photographers or designers often request images with a particular colour or texture; therefore, developing a system which automatically de-rives requested and similar images is essential. Using the World-wide Web, users are able to access these images from anywhere in the World which creates a huge stimulus to quickly find images that user needs.
Since images are in a digital form this opens new prospects to organise them in a convenient to manipulate form. However, the information that they contain is unstructured and there is no universal established and sta-ble approach to convert this information into an easy to manipulate form. For example, text can be organised alphabetically, music using notes, etc. Images, however, are significantly more unstructured by nature. It is a challenge to organise a huge and dynamically growing amount of images in a structure that is convenient to search quickly. It is possible to identify and retrieve desired images from a small database; however, the difficulties become more vivid for big and dynamically growing data streams with var-ied images. Another challenge is to use an effective measure of similarity between the query image and another image or a set of similar images.
The methods for retrieving similar images based on features such as colour, texture, or shape are usually referred to as Content-Based Image Retrieval (CBIR). The early use of CBIR system was introduced by Kato [2] in 1992. This research area has since been widely investigated by many researchers.
Although, CBIR technology has started to be used in the form of com-mercial products - such as TinEye [3], QBIC [4], Yandex Image Search [5], etc. and research projects like NETRA [6], Photobook [7] - still suffers from the lack of maturity. It is obvious from the (lack of) effectiveness of exist-ing CBIR systems, especially when handlexist-ing real-time scenario on the Web (handling 1011 images). There are still many open research issues to be
addressed before taking a full advantage of fast and reliable CBIR systems in practice.
are looking for.
In order to address some of the issues mentioned above, a new fast method called Look-a-like for finding visually similar images in big data streams is proposed in this paper which is using a combination of features of different nature, a dynamically evolving hierarchically nested structure of image clouds and a single formula of recursive density estimation (RDE) [8, 9] applied locally (per image cloud). The proposed approach is compu-tationally and time-wise very efficient due to the combination of the hierar-chically nested image clouds structure and the use of the local RDE.
Dynamically evolving character of the problem is addressed by a con-stant update of the proposed nested hierarchical structure using the re-cently introduced ELM [10] clustering method at the back-end server of the overall system. This approach is very computationally efficient and robust and provides visually meaningful results due to the combination of features of various nature. The local RDE provides the exact information about the similarity between any given query image and all images from a given image clouds. The proposed approach Look-a-Like is capable of real-time image retrieval from a huge number of images. (For example, 1012 images which is approximately the amount of images on Internet can be organised automatically using ELM in 6 layers of hierarchy with approximately 100 clusters/data clouds in each layer and the search will then only require to calculate 6×100 = 600 times the local RDE which takes less than a sec-ond on a PC. The performance of the proposed approach was evaluated on a database containing 65,000 images with over 600 classes. The results demonstrate that Look-a-like method introduced here is computationally very efficient and fast. Furthermore, the images returned as a result of the search were visually very similar to the query image and the time required was very low, especially with the hierarchically nested structure. In addi-tion, a GUI for a desk-top application was also developed.
The remainder of the paper is organised as follows. First, in section 2 the related work on CBIR is analysed. The proposed approach,Look-a-like, is described in section 3. Section 4 details the experimental results. Finally, Section 5 provides conclusions and outlines the future works.
2. State-of-the-art of CBIR
Eakins and Graham [11] categorised three types of queries in CBIR sys-tems. The first type includes extracting primitive features such as colour, texture, shape or the spatial location of image elements. The most common query is the query by example; for instance, users are interested to find im-ages that are similar to a certain query image. The second type, concerns retrieval of specific object of given type identified by extracted features, with some degree of logical inference [12]. For instance, users intend to find a pic-ture of a bus. The third type includes retrieval by abstract attributes. It involves a considerable amount of high level reasoning regarding the purpose of the objects including pictures with emotional significance, special event, etc. For example, users may want to find pictures of a cheerful crowd. The second and third types are referred to as ’semantic image retrieval’ and the difference between them is called ’semantic gap’ [11]. Image retrieval of the first type requires users to submit an example/query image; on the other hand, semantic image retrieval supports query by keywords in case users do not have a query image.
In this paper we focus on the first two types of image retrieval where the search is based on a query image and visual similarity, not semantic one. There are three main steps of the process, namely, feature extraction, organisation of the available images, and evaluating the similarity between images.
categories known as; a) based, and b) boundary-based. In region-based techniques, the entire region is used while in the boundary-region-based approach only the outer boundary is taken into account [19]. For different applications scale, rotation or translation invariance can be used to represent the shape.
Another very important element of CBIR, especially, when applied to the Internet is the organisation of images. Different clustering algorithms has been used for this purpose such as the mean-shift, k-means, and hier-archical clustering methods [20]. BenHaim et al. in [21] used HSV colour histogram to extract features and cluster images based on the offline iter-ative mean-shift clustering algorithm. The cluster that corresponds to the largest number of parent images is selected and referred to as the ’significant’ cluster. In [22] the BOO-clustering algorithm and GDBSCAN is utilised to extract colour clusters of each image. Once these are determined, the ob-jects are formed by selecting one or a few colour clusters of the image in an interactive manner. K-means clustering approach and indexing structure B+ tree is used in [23] to group relevant images in a CBIR system. For the retrieval process, images from the closest cluster and from other nearby clusters are considered to retrieve similar images even if the query image is mis-clustered; however, an important drawback of this approach is that the number of clusters, K has to be predefined and is not changing afterwards (is fixed); thus, the number of image groups in the dataset should be known in advance. Another disadvantage is the computational complexity of the k-means approach which is iterative, for large number of images it becomes prohibitive.
In [24] a hybrid clustering technique is used based on k-means clus-tering and Linde-Buzo-Gray (LBG) clusclus-tering methods. Initially, this algo-rithm assumes that one large Gaussian represents all images in the database. This is later iteratively split and re-estimated to obtain a mixture of Gaus-sians. The authors tested their algorithm on 12,000 images from 100 classes collected from Google Image search; however, the result of only one class has been illustrated and no comparison with other methods has been done. Same disadvantages as for the previous approach can be attributed to this approach plus the unrealistic assumption of Gaussian distribution.
im-age to the database the whole procedure, including the clustering has to be repeated ’from scratch’. In addition, this approach has not been and cannot be applied to a large number of images (e.g. Internet) because it is computationally expensive.
Searching through large image collections especially on the Web with over 100 billion images can be a tedious work. Developing a hierarchical organisation can significantly speed up the search which is essential. In [26] authors developed a hierarchical annular histogram (HAH) and tested it on images from prostate cancer. They consider the hierarchy of image to sub-images and not a hierarchy of nested clusters/image clouds as in the proposed paper and applied their technique to a small amount of images from a specific area only. On the other hand, Distasi et al. [27] applied a hierarchical entropy-based representation (HER) to a database containing several shapes represented by their closest contour in curvilinear coordinates to be used in a CBIR system. A tree-based structure of representation of images was proposed by Chow et al. [28] where a root node contains the global features, as opposed to child nodes which contain the local features. Authors also used multi-layer self-organising map to form the tree structure. In [29] a multi-level hierarchy was proposed and applied to text retrieval and natural language. Finally, in [30] a hierarchical structure to which dynamic indexing and guided search are applied using wavelet-based scheme for multiple features extracted from images in a warehouse. The hierarchy is, however, over the image colour, palm and face etc. Features are not over nested clusters/clouds of images. This approach will also struggle in terms of computational complexity for huge amount of images and sub-images or features.
Although, forming hierarchical structures for retrieving images has been explored by other researchers, their goals for doing so differ from our pro-posed method. We offer a hierarchy of nested clusters of mean values, not images and sub-images or features.
Last, but not least, it is important to select appropriate proximity and similarity measure used for clustering and search. Traditionally, Euclidean, Mahalonobis, cosine, Manhattan/city distance measures are used. In Look-a-Like, we use relative Manhattan (L1) distance. However, all of these are
use such measure of similarity which is not the same as the distance between two data samples (images) nor between groups of images, nor between an image and a mean of a cluster (mean of a cluster is often not an existing image, but an abstraction) only. Data density as defined in [8, 9] is a unique measure which allows quickly to be computed (because is recursive and in the proposed approach can be calculated in a hierarchically nested setting) theexact (not approximate) similarity between a given query image and as many other images as needed (e.g. 100 billion or100 etc.).
3. The Proposed Approach Look-a-Like
The aim of the proposed approach is to provide an efficient and fast CBIR system to deal with big data streams in the form of images. Look-a-like is a quick strategy for search and retrieval of images in big dynamically evolving data streams. It is subject of a pending patent application [31]. It consist of three main elements:
(a) multiple features extracted from images which represent them in a com-putationally compact form in a unique way (that is, an image is con-verted to a vector of less than 700 floating point numbers per image); (b) a hierarchically nested dynamically evolving data clouds (cluster-like)
structure which facilitates the computationally efficient search and logi-cal organisation of the images and is dynamilogi-cally updated with each new available image including the query image using evolving local means (ELM) algorithm [10]:
(c) computationally efficient RDE formula for evaluating the similarity be-tween a query image and a huge number of other images. The proposed approach is also using relative Manhattan (L1) distance.
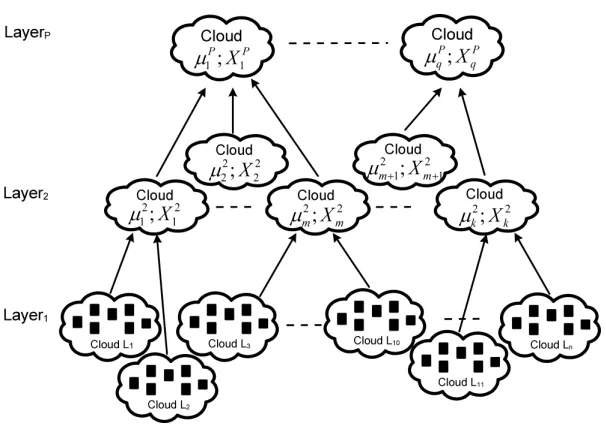
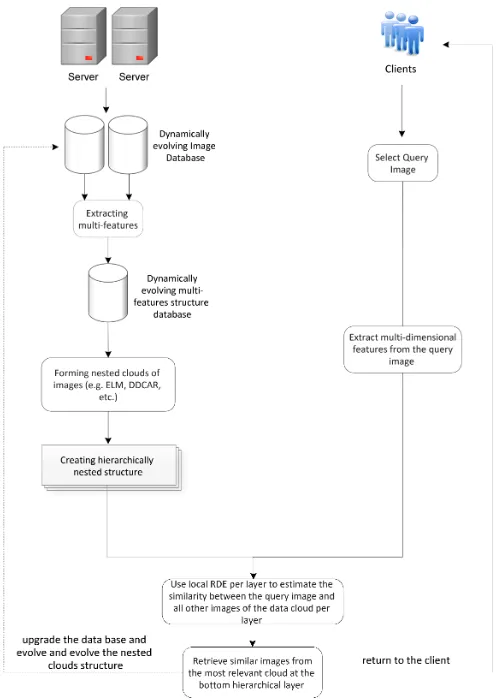
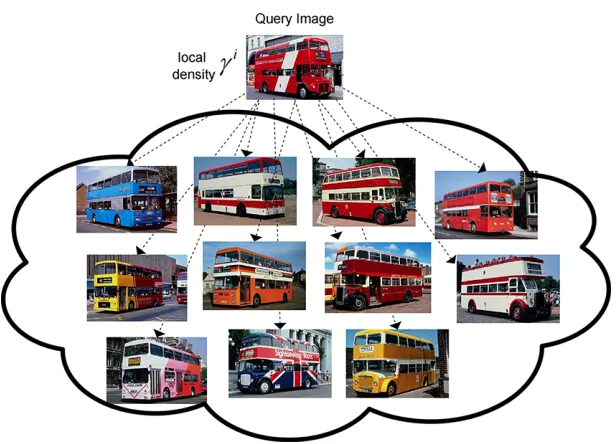
The proposed approach builds automatically a dynamically evolving hi-erarchically nested image clouds/clusters structure from unstructured big data streams (e.g. billions of images) facilitating the search of most relevant similar images using local density (see Fig. 1). From the computing realisa-tion point of view, the proposedLook-a-Likecan be realised as a client-server system (see Fig.2) which can be offered as a web service.
Figure 1: Schematic representation of the hierarchically nested data clouds structure, each square in layer one represents features of an image a described in section 3.1; µand X
denote mean values and scalar products which are abstract values and are described in section 3.3
multi-features (less than 700 floating point numbers per image) and means and accumulated scalar products. It is not using pixels directly; finally, it is using efficient local (per cloud) RDE formula [8] and relative Manhattan distance.
illustrated further.
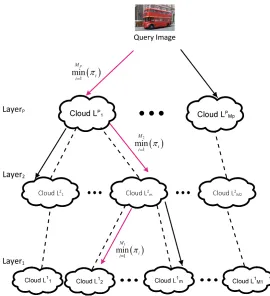
It has to be stressed that local RDE calculates the exact similarity be-tween a query image andall images from the winning data clouds recursively and, thus, computationally efficiently. Due to the recursive calculations, the proposed approach is very efficient computation- and time-wise. Further-more, the proposed method involves search in an ordered multi-layer hierar-chy (Fig. 3) such that search process is speeded up by orders of magnitude. The results show that the performance is very high quality and very fast for big data streams even on ordinary laptop using Windows OS and Matlab (using Linux OS and C/C++ language as well as parallelisation or use of GP GPU can further improve significantly the performance). The main reason is that by introducing the hierarchical organisation of the images combined with the RDE the number of comparisons is dramatically reduced yet the full and exact information of the comparison with all images from a data cloud is kept intact, Fig. 2.
3.1. Feature Selection
Having a selection of representative features is very important for the quality of the algorithm. InLook-a-Like we use a combination of multiple feature sets of different nature, with size of 697 floating point digits: F =
FG;FHSV;FM;FC;FLG;FW [32].
The first feature is GIST [33] which extracts the global features of the image and gives an impoverished and coarse version of the principal contours and textures of the image which is still detailed enough to recognize the image. It is computationally efficient and there is no need to parse the image or group its components in order to represent the spatial configuration of the scene. The fundament of GIST approach is Gabor filters. Several Gabor filters with selected channels are computed on a grid of the image (4×4) and indexed into an array with 512 features,FG.
The second feature is a colour HSV histogram. To extract colour his-togram, each pixel of an image is associated to a specific histogram bin on the basis of its own colour. HSV colour space is used for histogram gen-eration where each pixel contributes its intensity and improves perceptual uniformity. Each image is quantised in the HSV colour space into 8×2×2 equal bins, which creates a feature vector with 32 features, FHSV.
each colour channel), FM. The c-th colour channel of thei-th image pixel Pci is defined by:
i the average colour value in an image:
Mc=
1 A
A
X
i=1
pci (1)
whereA=H×W H = height, W = width
ii the variance
σc=
v u u t 1 A A X i=1
(pci−Mc)2 (2)
iii the skewness which is a measure of the degree of asymmetry in the distribution:
Sc= 3
v u u t1 A A X i=1
(pci−Mc)3 (3)
The colour auto-correlogram is the fourth extracted feature set which describes how the spatial correlation of colour changes with the distance. If the distanced∈[n] is a fixedpriori, the correlogram of an image,I is defined fori, j∈[m] positions of pixels,k∈das [36]:
βcki,cj(I)≡Pr
|p1−p2|=k, p2 ∈ICj|p1 ∈ICi
(4)
where|p1−p2| ∆
= max{|x1−x2|,|y1−y2|}
Given any pixel of colourCi in the image I, βcki,cj gives the probability
that a pixel at distancek away from the given pixel’s colour [36]. For each pixel in the image, the auto-correlogram method applies to all the neighbours of that pixel. If the distance is large, a large area will be covered and more information will be collected from the image; however, the computational complexity will increase. In order to address the computational complexity, the setS is used which is a subset of d(S = 1; 3; 5; 7)[34] resulting in a 64 features vector,FC which are added/appended toF.
of filters is required to obtain wide spectrum coverage. In addition, their response is symmetrically distributed around the centre frequency, which results in redundant information in the lower frequencies that could instead be devoted to capturing the tails of images in the higher frequencies.
The log-Gabor function is used as an alternative to Gabor function [37] designed as Gaussian functions on the log axes. It has been proven that log-Gabor filter outperforms the standard Gabor filter in order to verify an object inside an image [38]. Their symmetry on the log axes results in a more effective representation of the uneven frequency content of the images. Furthermore, log-Gabor filters do not have a DC component, which allows an increase in the bandwidth which results in fewer filters to cover the same spectrum. The log-Gabor filters are defined in the log-polar coordinates of the Fourier domain as shifted from the origin Gaussians [39]:
G(s,o)(ρ, θ) = exp −
1 2
ρ−ρs
σρ
2!
exp −1
2
θ−θ
(s,o)
σθ
2!
(5)
ρs = log2(n)−s
θ(s,o)=
π
noo if s is odd
π no(o+
1
2) if s is even
(σρ,σθ) = 0.996
q 2 3, 1 √ 2 π no (6)
where s and o specify the scale and orientation of the wavelet, respec-tively (s = 0,1, ..., ns;t = 0,1, ..., no); and (ρ, θ) are the log-polar
coordi-nates. ρs, θ(s,o)
are the coordinates of the centre of the filter and (σρ, σθ)
are the bandwidths. LetF denote the Fourier transform of the input image. The convolution ofGs,oand F is obtained by [40]:
LetF denote the Fourier transform of the input image. The convolution ofGs,o and F is obtained by [40]:
An array of magnitudes is obtained as:
Es,o=
X
i
X
j
|Vs,o(i, j)| (8)
where (i, j) denotes the 2D coordinates of a pixelpi,j.
These magnitudes represent the energy content at different scale and orientation of the image. The main goal of the texture-based retrieval is to find images or regions with similar texture. It is assumed that we are interested in images or regions that have homogenous texture; therefore, the following mean,µso and standard deviation,σsoof the magnitude of the
transformed coefficient are used to represent the homogenous texture of the region as a feature:
µso =
Es,o
N (9)
σso=
r P
i
P
j
(|Gso(i, j)| −µso)2
N (10)
A feature vector is constructed using µs,o and σs,o. In our experiment
the scale was set to 5 and orientation to 6 which results in a feature vector FLG, of size 30 for eachµs,o,σs,o.
wlow[n] =
∞ X
k=−∞
x[k]h[2n−k] (11)
whigh[n] =
∞ X
k=−∞
x[k]g[2n−k] (12)
After resizing the image into 256×256 matrix, we applied a 4-level wavelet transformation. The upper left 16×16 matrix is stored and also divided into its high and low frequency components, as part of the feature vector. Finally, we calculated the mean and standard deviation of the 16×16 matrix to construct the feature vector. The final size of the feature vector is composed of two sets of 16 features each (32 in total),FW.
As a result of applying these six sets of features a vector with size 697 is formed asF =
FG, FHSV, FM, FC, FLG, FW [32].
3.2. Forming data clouds
Similarity comparison between the query image and each image from a large collection can be computationally prohibitive and very slow. In addi-tion, it is impossible to compare the query image with all the images in the World Wide Web with its vast and increasing size individually. Therefore, automatically arranging/structuring of the images based on their similarity is essential, especially when the users need to narrow down their requirement to a particular subset. In this sense, it is useful to arrange the images into simple genres forming data clouds. Arranging massive amount of images in the World Wide Web generated every second is the toughest challenge. This is where one of the main innovation aspects of the proposed new Look-a-like approach lies. If we try to implement some of the classical clustering algorithms such as k-means, fuzzy C-means etc. this is not practical due to their fixed structures and pre-defined number of clusters, prohibitive com-putational costs etc. In addition, storing the huge amount of image data in the memory and processing them is another challenge that needs to be addressed. Moreover, the amount of images in the World Wide Web is not limited or fixed and traditional approaches would require the task to be re-solved each time again and again, which is also prohibitive. Therefore, we need a computationally efficient, recursive and dynamically evolving algo-rithm for data partitioning/forming data clouds.
[43]. The advantage of DDCAR is that it is fully autonomous and does not require any parameter to be pre-specified (for comparison, even ELM does require the radius,r to be pre-specified).
ELM is based on the concept of non-parametric gradient estimate of the density function using local (per data cloud/rubric) means [10]. The local means are being updated for each new coming feature vector/image descriptor allowing for the data set to evolve/expand (as is the case with the World Wide Web, for example). New data clouds are being formed if the density pattern changes, a cloud is created. In that case, the evolving nature of ELM can be useful if new images are added to the database. For each image cloud, i that is being formed we can calculate the local mean, µi and variance, σi. The mean does not necessarily (and usually) represent
a meaningful image but is rather an abstraction/focal point of the cloud. Details of the ELM approach are provided in [10]. Initially a radius of the data cloud is being defined. In terms of the feature vector which was defined in the previous sub-section [32], the initial radius value was chosen to be 150 for the lower hierarchical layer and 250 for the higher/top layer (the units are related to the unnormalised feature vector. As a new image (feature vector) is being processed, the distance/dissimilarity to all existing data clouds is computed. If the following condition is satisfied, then the imageI is assigned to the data cloudi:
di <(max (kσik, r) +r) (13)
where di is the distance from image I to the data cloud mean µi. r is a
pre-specified radius of the cloud.
If this condition for the image I is true for more than one data cloud, the nearest data cloud is selected. After assigning the new coming image to an existing data cloud, the mean of the data cloudµi and the variance, σi
are updated recursively as detailed in [10].
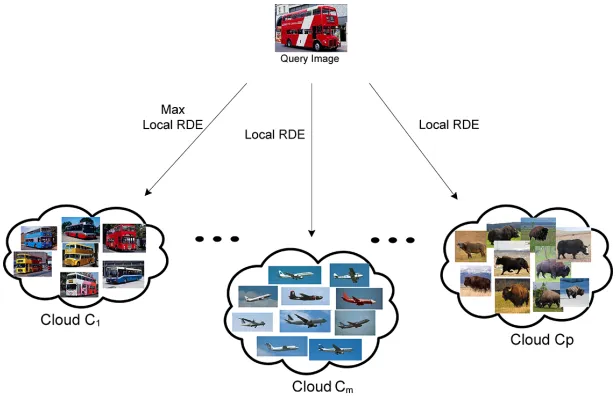
3.3. Similarity measure based on the local RDE
Figure 4: Computing similarity between a given query image,Q and clouds using local density at the highest hierarchical level
in terms of similarity between the query and each individual image from the clouds [8, 9]. Only the information concerning the density (mean, µ and the scalar product, X) is accumulated and stored for each cloud in the memory. Moreover, it makes possible to use a significantly smaller (in orders of magnitude) amount of computations. Due to recursive nature of the algorithm, if compare with the case when the query image is compared with each image from the cloud individually, it is computationally efficient and fast.
In Look-a-Like, the degree of similarity of a query image to all images inside a cloud is measured by the relative density in regards to the query image:
γki = 1
1 +Fk−µik
2
+Xi k−
µik
2 (14)
In practice, it is more convenient (and in accordance with the typicality, [44]) to consider the accumulated proximity,π:
πik= 1
γki −1 (15)
where F = {f1, . . . , f697} is the representation of the image with its
Figure 5: Computing local densityγi of a query image toallimages inithcloud
within theith cloud;C is the number of clouds.
Both, the mean, µk and the scalar product, Xk can be updated
recur-sively as follows [9]:
µk=
k−1
k µk−1+ 1
kFk; µ1 =F1 (16)
Xk =
k−1
k Xk−1+ 1 kkFkk
2; X
1=kF1k2 (17)
The cloud with the maximum local density in respect to the query image is the winner which contains images that are most relevant/similar to the query image:
Ck∗ = arg min i=1
πik (18)
Once the winning cloud is selected, the image that are contained in it are re-ranked using relative Manhattan/L1 distance which yields best results
d Q, Ij = n X k=1 Qk−I
j k
1 +Qk+Ikj
;j= 1, . . . , Mi (19)
where Mi is the number of images of a certain cloud; n is the number
of extracted features, in this workn=697 [32]. The final result includes all images from the selected/wining cloud up to a certain threshold in terms of d,ε(recommended values ∼20).
IF d Q, Ij< ε T HEN display Ij (20)
4. Experimental Results
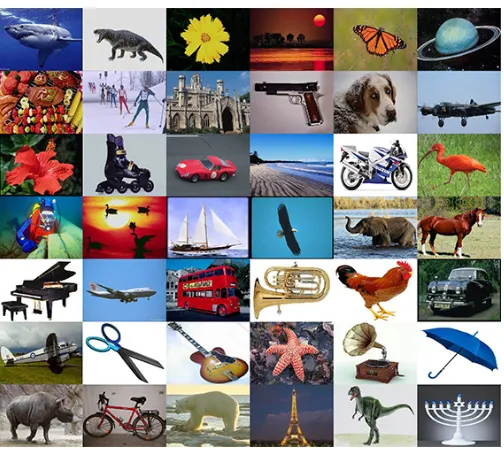
In this section, the experimental results are presented. The proposed approach, Look-a-like has been evaluated in terms of the speed and accu-racy. It was tested with an image database which includes 65,000 images collected within the WANG database [45] by the visual Geometry group at the University of Oxford [46]. The database contains over 600 classes which makes it an ideal example to evaluate the performance of CBIR systems. Some of the image classes are illustrated in Fig. 6. It should be noted that the number of images is not the same for all classes.
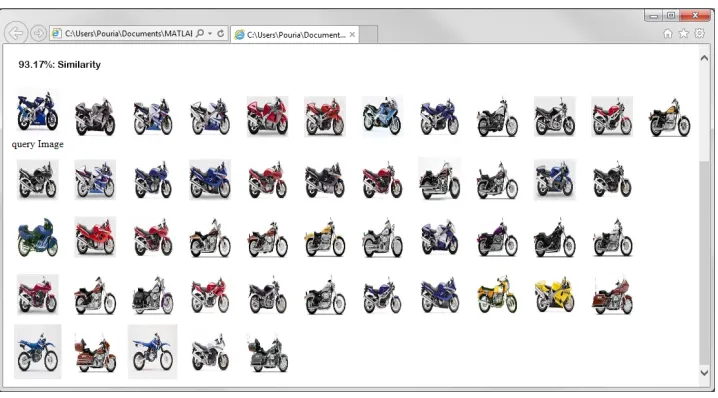
The tests were performed on a standard PC with Intel Core i7, process-ing power with 3.4 GHz CPU and 8 GB RAM runnprocess-ing Windows 7 operat-ing system. A graphical user interface (GUI) application was developed in MATLAB environment (Fig. 7) to facilitate the evaluation work.
The test starts with the user uploading a query image and retrieving the similar images. Users can select a threshold, εto retrieve the most similar images (we used ε=23). At the end, the final search result was saved in HTML format and ready to publish on the Web. Execution time of the proposed nested hierarchical system and an alternative of clustering and a non-hierarchical system were also compared.
4.1. Speed evaluation of the proposed approach
Figure 6: Example images from the dataset that was used (65,000 images in total)
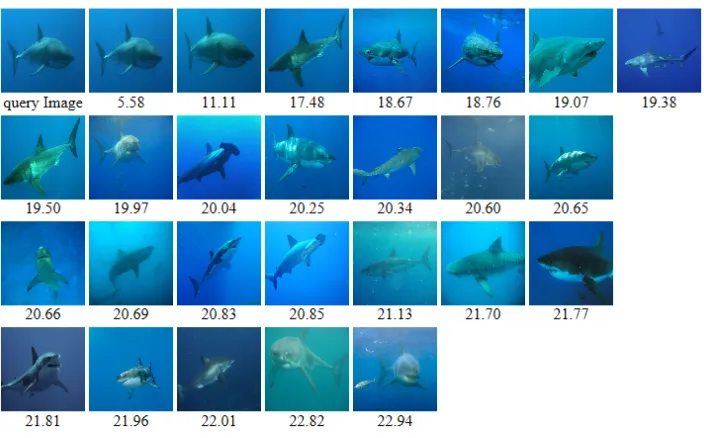
[image:20.612.125.487.478.615.2]Figure 8: All images from the winning cloud are shown after re-ranking
Table 1: A two layer example of the proposed hierarchically nested approach
Two Layer Hierarchically Nested Structure
Radius No. Clouds
Layer one 150 697
1-2 Layer two 250 36
[image:21.612.182.431.391.448.2]Figure 9: Execution times in seconds on different setups
[image:22.612.128.480.401.620.2]Figure 11: Results for searching cars
5. Conclusion
In this paper, a new fast approach for organisation and search within CBIR context has been proposed. Its main idea is to organise the otherwise unstructured set of complex, multi-dimensional data (images) into a dy-namically evolving hierarchically nested clouds structure using a combined multiple sets of features and a computationally efficient local-RDE-based similarity measure. The approach was tested on a data base which contains 65,000 images from about 600 different genres/rubrics. The proposed Look-a-like approach was able to automatically form 697 lower layer clouds and 36 higher/top layer clouds and for a given query image it provided visually very relevant results within few milliseconds making only about 50 calculations of the local RDE formula. The approach is scalable and parallelisable in nature (different data clouds can reside on different hardware or multi-core application can benefit from parallelisation, too). It can be realised as a web service. It is also possible to include user feedback in a future application. The method is a subject of a patent application [31].
6. Bibliography
[1] T. Blog, “Internet 2011 in numbers
[2] T. Kato, “Database architecture for content-based image retrieval,” Proc. SPIE 1662, Image Storage and Retrieval Systems, vol. 1662, pp. 112–123, Jan. 1992.
[3] TinEye, “http://www.tineye.com/,” Jan. 2012.
[4] W. Niblack, R. Barber, W. Equitz, M. Flickner, E. Glasman, D. Petkovic, P. Yanker, C. Faloutsos, and G. Taubin, “The QBIC project: querying images by content using colors, texture and shape,” pp. 173–187, Jan. 1993.
[5] R. Consoli, “http://yandex.ru/images/?d=IBQIKQ.”
[6] W. Y. Ma and B. S. Manjunath, “NeTra: a toolbox for navigating large image databases,” inImage Processing, 1997. Proceedings., Inter-national Conference on, pp. 184–198, 1997.
[7] A. Pentland, R. W. Picard, and S. Sclaroff, “Photobook: Content-based manipulation of image databases,” International Journal of Computer Vision, vol. 18, pp. 233–254, Jan. 1996.
[8] P. Angelov, “Anomalous system state identification.” patent applica-tion, GB1208542.9, May 2012.
[9] P. Angelov, Autonomous Learning Systems: From Data Streams to Knowledge in Real Time. John Wiley and Sons, Jan. 2012.
[10] R. D. Baruah and P. Angelov, “Evolving Local Means Method for Clus-tering of Streaming Data,” IEEE World Congress on Computational Intelligence, pp. 2161–2168, Jan. 2012.
[11] J. Eakins and M. Graham, “Content-based image retrieval,” tech. rep., Jan. 1999.
[12] Y. Liu, D. Zhang, G. Lu, and W.-Y. Ma, “A survey of content-based image retrieval with-level semantics,” Journal of Pattern Recognition Society, vol. 40, pp. 262–282, Jan. 2007.
[13] W.-T. Chen, W.-C. Liu, and M.-S. Chen, “Adaptive Color Feature Extraction Based on Image Color Distributions,”IEEE Transaction on Image Processing, vol. 19, pp. 2005–2016, Jan. 2010.
[15] P. L. Stanchev, D. Green Jr., and B. Dimitrov, “High level color similar-ity retrieval,” International Journal on Theories Applications, vol. 10, pp. 363–369, Jan. 2003.
[16] J. R. Smith and S.-F. Chang, “Automated binary texture feature sets for image retrieval,” inAcoustics, Speech, and Signal Processing, 1996. ICASSP-96. Conference Proceedings., 1996 IEEE International Con-ference on, pp. 2239–2242, 1996.
[17] I. Daubechies and B. J. Bates, Ten lectures on wavelets, vol. 93. The Journal of the Acoustical Society of . . . , 1993.
[18] B. S. Manjunathi and W. Y. Ma, “Texture Features for Browsing and Retrieval of Image Data,” IEEE Trans. on Pattern Analysis and Ma-chine Intelligence, vol. 18, pp. 837–842, Jan. 1996.
[19] Y. Rui, A. C. She, and T. S. Huang, “Modified Fourier descriptors for shape representation-a practical approach,”Proc of First International Workshop on Image Databases and Multi Media Search, 1996.
[20] D. Cai, X. He, Z. Li, W. Ma, and J. Wen, “Hierarchical clustering of WWW image search results using visual, textual and link information,” inProceedings of the 12th annual ACM, pp. 952–959, Jan. 2004.
[21] N. Ben-Haim, B. Babenko, and S. Belongie, “ImprovingWeb-based Im-age Search via Content Based Clustering,” inComputer Vision and Pat-tern Recognition Workshop, 2006. CVPRW ’06. Conference on, pp. 17– 22, 2006.
[22] P. Dutta, D. Bhattacharyya, and J. Kalita, “Clustering approach to content based image retrieval,”Modeling and Imaging, pp. –, Jan. 1993.
[23] E. Yildizer, A. M. Balci, T. N. Jarada, and R. Alhajj, “Integrating wavelets with clustering and indexing for effective cotent-based image retrieval,” Knowledge-Based Systems, vol. 31, pp. 55–66, Jan. 2012.
[24] T. Deselaers, D. Keysers, and H. Ney, “Clustering visually similar im-ages to improve image search engines,” In Informatiktage 2003 der Gesellschaft fr Informatik, Bad Schussenried, Germany., Jan. 2003.
[26] L. Yang, X. Qi, F. Xing, T. Kurc, J. Saltz, and D. J. Foran, “Parallel content-based sub-image retrieval using hierarchical searching,” Bioin-formatics, Jan. 2013.
[27] R. Distasi, D. Vitulano, and S. Vitulano, “A Hierarchical Representa-tion for Content-based Image Retrieval,” Journal of Visual Languages and Computing, vol. 11, pp. 369–382, Jan. 2000.
[28] S. Chow, M. Rahman, and S. Wu, “Content-based image retrieval by using treestructured features and multi-layer self-organizing map,” Pat-tern Analysis & Applications, vol. 9, pp. 1–20, Jan. 2006.
[29] R. Levinson and G. Ellis, “Multi-level hierarchical retrieval,” In 6th Annual Conceptual Graphs Workshop, pp. 285–310, Jan. 1996.
[30] J. You and Q. Li, “On hierarchical content-based image retrieval by dy-namic indexing and guided search,” Cognitive Informatics, 2009. ICCI ’09. 8th IEEE International Conference on, pp. 188–195, 2009.
[31] P. Angelov and P. Sadeghi-Tehran, “Data Structuring and Searching Method and Apparatus.” patent application, GB1417807.3, Oct. 2014.
[32] P. Sadeghi-Tehran and P. Angelov, “An Approach to CBIR using a com-posite Multi-Feature Vector and Local Recursive Density Estimation,” Journal of Computer Vision and Image Understanding (submitted, Oc-tober 2014).
[33] A. Oliva and A. Torralba, “Building the gist of a scene: The role of global image features in recognition,” Progress in brain research, vol. 155, pp. 23–36, Jan. 2006.
[34] H. Yu, M. Li, H.-J. Zhang, and J. Feng, “Color texture moments for content-based image retrieval,” in International Conference on Image Processing, pp. 929–932, 2002.
[35] M. Stricker and M. Orengo, “Similarity of color images,”IS&T/SPIE’s, pp. 381–392, Jan. 1995.
[36] J. Huang, S. R. Kumar, M. Mitra, W.-J. Zhu, and R. Zabih, “Image indexing using color correlograms,” inIEEE Computer Society Confer-ence on Computer Vision and Pattern Recognition, pp. 762–768, 1997.
[38] J. Arr´ospide and L. Salgado, “Log-Gabor Filters for Image-Based Ve-hicle Verification,” IEEE Transaction on Image Processing, vol. 22, pp. 2286–2295, Jan. 2013.
[39] S. Fischer, F. ˇSroubek, L. Perrinet, R. Redondo, and G. Crist´obal, “Self-Invertible 2D Log-Gabor Wavelets,”International Journal of Computer Vision, vol. 75, pp. 231–246, Nov. 2007.
[40] M. Kuse, Y. F. Wang, and V. Kalasannavar, “Local isotropic phase symmetry measure for detection of beta cells and lymphocytes,” Jour-nal of pathology Informatics, vol. 2, no. 2, 2011.
[41] S. Mallat, “Wavelets for a vision,” Proceedings of the IEEE, vol. 84, pp. 604–614, Jan. 1996.
[42] K. Arai and C. Rahmad, “Wavelet Based Image Retrieval Method,” (IJACSA) International Journal of Advanced Computer Science and Applications, vol. 3, pp. 6–11, Jan. 2012.
[43] R. Hyde and P. Angelov, “DDCAR: Data Density based Clustering with Automated Radius,” in IEEE International Symposium on Evolving and Autonomous Learning Systems (EALS’14 to appear).
[44] P. Angelov, “Anomaly Detection,” Journal of Automation, Mobile Robotics and Intelligent Systems (JAMRIS), vol. 8, pp. 29–35, 2014.
[45] J. Z. Wang, “http://wang.ist.psu.edu/docs/related.shtml,” Jan. 2004.
[46] U. Oxford, “Visual Geometry Group