Can people detect errors in shadows and reflections?
Sophie J. Nightingale1&Kimberley A. Wade1&Hany Farid2&Derrick G. Watson1
#The Author(s) 2019
Abstract
The increasing sophistication of photo-editing software means that even amateurs can create compelling doctored images. Yet recent research suggests that people’s ability to detect image manipulations is limited. Given the prevalence of manipulated images in the media, on social networking sites, and in other domains, the implications of mistaking a fake image as real, or vice versa, can be serious. In seven experiments, we tested whether people can make use of errors in shadows and reflections to determine whether or not an image has been manipulated. Our results revealed that people’s ability to identify authentic and manipulated scenes based on shadow and reflection information increased with the size of the manipulation, but overall, detection rates remained poor. Consistent with theories of incomplete visual representation, one possible reason for these findings could be that people rarely encode the details of scenes that provide useful cues as to the authenticity of images. Overall, our findings indicate that people do not readily make use of shadow and reflection cues to help determine the authenticity of images—yet it remains possible that people could make use of these cues, but they are simply unaware of how to do so.
Keywords Image manipulation . Digital image forensics . Visual processing . Human perception
On May 23, 2016, Dinesh and Tarakeshwari Rathod were hailed as the first Indian couple to conquer Mount Everest (Boone,2016). Yet the couple’s celebrations were cut short when fellow mountaineers charged that the couple never made it to the summit and that the photos they provided as evidence of their success were forgeries. Of particular interest was the date and time stamp on the photos—6.25 a.m. on May 23, 2016. Crucially, the shadows in the image suggested the photo was taken closer to noon than to 6.25 a.m. (Boone,2016). Following an investigation, the Nepalese government con-cluded that the couple had indeed faked their summit photos and subsequently banned them from mountaineering in Nepal
for 10 years (Safi,2016). The Rathod’s story highlights how shadow information offers a useful means to detect photo forgeries. In the present study, we examine whether people can use inconsistencies between shadows, and similarly, in-consistencies between reflections, within a single scene to determine if an image has been manipulated.
The growing sophistication of photo-editing software means nearly anyone can make a fairly convincing forgery. For instance, the phone app Facetune®allows users to reshape noses, whiten teeth, remove blemishes, perfect skin, and even add a smile (King,2015). In coming years, algorithms might be used to invent or fabricate entire scenes (Quach,2017). Yet a growing body of research suggests that people are poor at detecting image manipulations (Kasra, Shen, & O’Brien,
2016; Nightingale, Wade, & Watson, 2017). Farid and Bravo (2010), for example, examined whether people can identify discrepancies in image-based cues (e.g., shadows and reflections) that often arise as a result of tampering. Subjects viewed a series of computer-generated scenes consisting of basic geometrical objects. In some scenes, the objects cast accurate (consistent) shadows and reflections, while in other scenes the objects cast impossible (inconsistent) shadows and reflections. When the inconsis-tencies were blatant—for instance, when shadows ran in op-posite directions—subjects identified tampered images with nearly 100% accuracy. Yet when the inconsistencies were * Sophie J. Nightingale
Kimberley A. Wade [email protected]
Hany Farid
Derrick G. Watson
1
Department of Psychology, University of Warwick, Coventry, UK
2 Department of Computer Science, Dartmouth College,
Dartmouth, NH, USA
subtle—for instance, shadows were a combination of results from two different light positions on the same side of the room—subjects’performance was close to chance.
More recently, Nightingale et al. (2017) examined people’s ability to detect manipulations of complex, but everyday, real-world scenes. In two online experiments subjects viewed 10 images, half of which were authentic and half of which had been manipulated in one of five ways (e.g., a face was airbrushed or a shadow altered). Although there were differ-ences in subjects’ability to detect if an image had been ma-nipulated depending on how it had been changed (e.g., image addition and subtractions were better detected than airbrushing, geometrical inconsistences, or shadow inconsis-tencies), overall performance was close to chance. What’s more, even when people correctly detected a manipulated im-age, they were often unable to locate where the manipulation was. A related study explored the strategies people use to determine image authenticity (Kasra et al.,2016). Subjects made judgements about the authenticity of images of real-world scenes that were paired with news stories. Consistent with Nightingale et al.’s results, people performed poorly at identifying whether the images had been manipulated. Perhaps more interestingly, subjects reported using nonimage cues, such as the source of the information (e.g., the credibility of the social media platform) or the details in the accompany-ing story (e.g., the caption provided alongside the image), rather than image-based cues to guide their judgements. In fact, subjects rarely mentioned inconsistencies in lighting and shadows, so it remains unknown if people can make use of such image-based cues even when instructed to do so.
When forgers edit images, they often, inadvertently, create inconsistencies in the physical properties of the scene because 2-D editing of a 3-D scene is difficult. As such, observers might use these inconsistencies to determine whether the im-age is fake, just as state-of-the-art digital imim-age forensic tools do to determine whether a photo is authentic or not (Farid,
2016; Farid & Bravo,2010; Kee, O’Brien, & Farid, 2013; O’Brien & Farid,2012). Although previous research suggests that people might not intuitively use such cues to discriminate between authentic and manipulated images (Kasra et al.,
2016; Nightingale et al.,2017), scientists have yet to examine whether image-manipulation detection improves when people are explicitly instructed to do so. We address this question by focusing on shadows (Part 1) and reflections (Part 2), that, in principle, provide observers with a reliable and relatively sim-ple method to verify an image.
Part 1: Cast shadows
Cast shadows are formed when an opaque object obstructs light and prevents it from illuminating a surface, such as the ground. Because light travels in a straight line, a point in a
shadowed region, its corresponding point on the shadow-casting object, and the light source must all lie on a single straight line (Farid, 2016). As such, shadows provide infor-mation about the geometry of a 3-D scene and can be used to determine the location of the 3-D light source (Casati,2004; Farid,2016; Farid & Bravo,2010). Assuming linear perspec-tive, then lines in 3-D are imaged as lines in 2-D—that is, the physical laws that constrain the behavior of light in the 3-D world also apply to 2-D images (Farid,2016; Kajiya,1986), so when we take photos, or render images from a virtual en-vironment, the interaction of light and the 3-D objects in the scene is captured in the geometry of the 2-D image.1
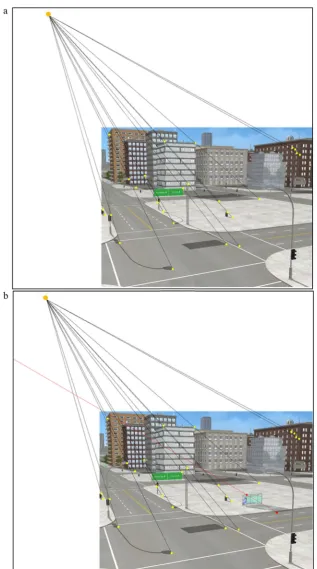
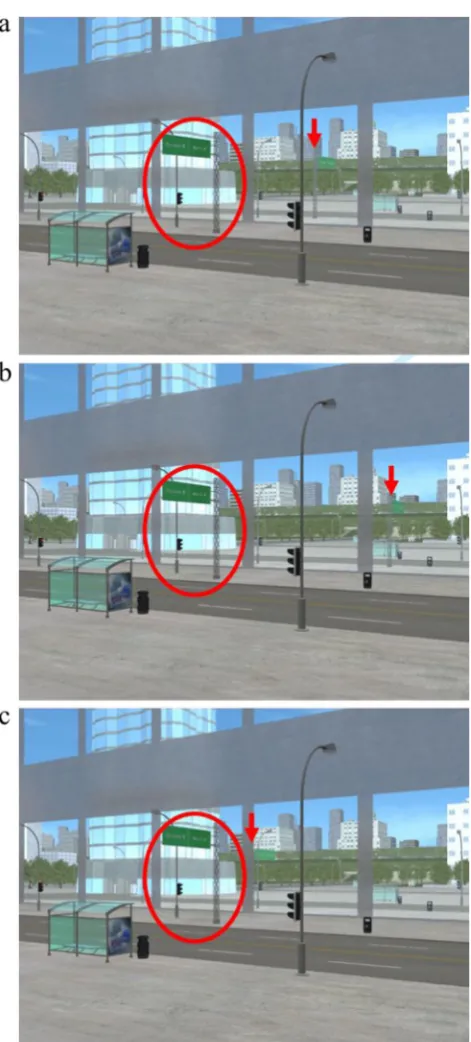
The constraint that connects the shadow, the shadow-casting object, and the light source provides an image-based technique for objectively verifying the authenticity of shadows (Farid, 2016; Kee et al., 2013). The scene in Fig.
1a contains shadows that are consistent with a single light source and have not been manipulated. The geometric tech-nique has been applied to objectively demonstrate the authen-ticity of the shadows in the scene. To use this technique, one can locate any point on a shadow and its corresponding point on the object, then draw a line through them. Repeating this process for as many corresponding shadow and object points as possible reveals the point at which these lines intersect and the exact location of the projection of the light source. In Fig.
1b, a bus stop and its shadow have been taken from another scene where the light source is in a different position and added to the original scene from Fig. 1a. Using the same principle, the line connecting the bus stop’s shadow and the corresponding point on the object does not intersect the scene’s light source. This inconsistency indicates that the im-age has been manipulated—and demonstrates how shadows can be helpful in detecting forgeries (Farid,2016; Kee et al.,
2013).2
We might predict that people can make use of shadow information to help identify image forgeries. Shadows convey important information about the arrangement and spatial po-sition of objects in a scene, and numerous studies show that the human perceptual system makes use of such information to understand the scene (e.g., Allen, 1999; Dee & Santos,
2011; Khang, Koenderink, & Kappers,2006; Tarr, Kersten, & Bülthoff,1998). In an early study investigating the percep-tion of inconsistent shadows, people searched for a target cube that was illuminated from a different direction to distractor cubes also present in the display (Enns & Rensink, 1990).
1In a 3-D scene, a shadow point, object point, and the light source lie on a
straight line. Assuming a rectilinear projection, the transformation of the 3-D world coordinates to 2-D image coordinates means that in a 2-D image of the scene, the line connects the images of the shadow point and object point, and intersects the projected image of the light source (e.g., Kee et al.,2013). 2This analysis assumes that all of the shadows in the scene are cast by a single
Subjects rapidly identified the presence or absence of the tar-get cube, suggesting that the human visual system can process
complex visual properties, such as lighting direction, at a preattentive stage of processing. This remarkable ability to Fig. 1 Example of using the shadow-based analysis technique.aThe
lines connecting the corresponding points of the shadows and objects intersect at a single point (yellow dots), indicating that the shadows are consistent with a single light source.bThe same scene is shown with a
[image:3.595.139.457.47.617.2]perceive shadow information suggests that such information might also help in the detection of image forgeries. Other research, however, suggests that the visual system discounts shadow information in early visual processing (e.g., Ehinger, Allen, & Wolfe,2016). Essentially, to recognize objects under a wide range of lighting conditions, the visual system priori-tizes extraction of the lighting invariant aspects of a scene and filters out shadow information as“noise.”In support of this suggestion, Ehinger et al. found that people were slower to detect changes to shadows than changes to objects even when the shadow changes altered the meaning of the scene. As such, it remains possible that observers will not make use of shadow information to help them to detect image forgeries.
When considering people’s potential ability to make use of shadow information in a given task, it is also important to appreciate that the visual system must determine which shadows are cast by which objects—the shadow correspon-dence problem (Dee & Santos,2011; Mamassian,2004). For stimuli that consist of simple geometric shapes with right-angle features and well-defined shadow regions, matching an object point with its corresponding shadow point can be relatively straightforward—and, accordingly, such stimuli al-low for a reasonably accurate estimation of the lighting direc-tion. Yet it is often extremely challenging to match shadow points with corresponding object points in real-world scenes. For example, research suggests that the ability to estimate lighting direction does not generally extend to more complex real-world or computer-generated scenes; although there might be a point at which lighting inconsistencies do become noticeable (Ostrovsky, Cavanagh, & Sinha, 2005; Tan, Lalonde, Sharan, Rushmeier, & O’Sullivan, 2015). Furthermore, it is not known whether the visual system auto-matically picks up on discrepancies in lighting direction and generates a signal that these should be attended (e.g., the way a single red item among green items might call attention to itself due to a local contrast difference; Lovell, Gilchrist, Tolhurst, & Troscianko,2009; Rensink & Cavanagh,2004).
In sum, studies have yet to determine whether people can identify consistent and inconsistent shadows in complex scenes when there are a number of well-defined points be-tween objects and corresponding shadows that, theoretically, make it possible to determine the location of the light source. In the first series of experiments, we aimed to answer this question.
Experiment 1
Method
Subjects and design
A total of 102 subjects (M= 25.5 years,SD= 9.0, range: 14–57 years; 60 men, 39 women, three chose not to disclose their gender) completed the task online. A further four
subjects were excluded from the analyses: three had missing response-time data for at least one response on the task, and one experienced technical difficulties. There were no geo-graphical restrictions, and subjects did not receive payment for taking part, but they did receive feedback on their perfor-mance at the end of the task (this was the case for all experi-ments reported in this paper). The design was within subjects, with each person viewing four computer-generated images, half of which had consistent shadows, and half of which were manipulated to show inconsistent shadows. We measured peo-ple’s accuracy in determining whether an image had consistent or inconsistent shadows. A precision-for-planning analysis revealed that 81 subjects would provide a margin of error that is 0.25 of the population standard deviation with 95% assur-ance3 (Cumming, 2012,2013); this analysis applies to all experiments reported here. All research in this paper was ap-proved by the Psychology Department Research Ethics Committee, working under the auspices of the Humanities and Social Sciences Research Ethics Committee (HSSREC) of the University of Warwick. All participants provided in-formed consent.
StimuliTo create five different outdoor city scenes, we used a 3-D cityscape model fromturbosquid.comand 3-D animation software (Maya®,2016, Autodesk, Inc.).4To represent a real-world outdoor environment lit by the sun, each scene was illuminated by a single distant-point light source.5Each scene included a target object—a lamppost—and its corresponding shadow. To ensure subjects could use the shadow-based anal-ysis technique outlined in the introduction, we included other nontarget objects with corresponding shadows. Recall that when a scene is illuminated by a single source, all of the shadows must be consistent with that light; if any shadow is inconsistent with the light source, then the scene is physically impossible (Farid,2016; Kee et al.,2013). We rendered each of the five 3-D scenes to generate TIF image files with a resolution of 960 × 720 pixels. For each scene, the light was in front of the camera, but not actually visible within the im-age. To ensure that the shadows in the 2-D images were phys-ically accurate, and therefore representative of the shadows that people experience in the real world, we rendered the im-ages with raytraced shadows. Raytracing is a type of shadow rendering that calculates the path of individual light rays from the light source to the camera; it produces physically accurate shadows that are like shadows in the real world (Autodesk,
3
A 95% level of assurance indicates that with 81 subjects we will achieve a margin of error no longer than the target of 0.25 on 95% of occasions (Cumming,2014).
4The rendering parameters for each scene and the link to the 3-D cityscape
model are available upon request.
5We used an extremely distant point light that for practical purposes acts like a
2016). These five scenes comprised our original, consistent image set—each illuminated by a single source and thus con-taining only consistent shadows.
To create the inconsistent-shadow scenes, we rendered each of the five scenes two more times: once with the light moved to the left of its original position (−800 m on the hor-izontal axis) and once with the light moved to the right of its original position (+800 m on the horizontal axis).6The scene layout remained identical across each version of the scene, yet the three different light positions—original, left, and right— meant that each version had a different shadow configuration. For each of the five scenes, we selected a single lamppost and its corresponding shadow to manipulate. The manipulation process involved three stages completed using GNU Image Manipulation Program® (GIMP, Version 2.8). First, we re-moved the target lamppost’s shadow in the original version of the scene. Second, we cut the shadow of that same target lamppost from the version of the scene with the light moved left of the original position. Third, we overlaid this shadow onto the original version of the scene. We then repeated stages two and three for the version of the scene with the light moved right of the original position (see Fig. 2). We exported the images as PNGs, which is a lossless format. We repeated this manipulation process for the other four scenes.
Overall, we had three versions of each of the five city scenes to give a total of 15 images. The original version of each scene was used to create ourconsistentshadow image set. The two manipulated versions of each scene were used to create ourinconsistentshadow image set. The fifth city scene was used as practice (further details on the practice described shortly).
ProcedureSubjects were told to assume that “each of the scenes is illuminated by a single light source, such as the sun.”Subjects were given a practice trial before being present-ed with the four city scenes in a random order. Subjects saw two consistent shadow scenes and two inconsistent shadow scenes; however, they were unaware of this 50:50 ratio. For each scene, to cue subjects’attention to the target lamppost, they were first shown an almost entirely grayed-out image with only the target lamppost fully visible and highlighted within a red ellipse. After 4 s, the full scene became visible. We also added a small yellow dot on the base of the target lamppost to ensure subjects did not forget which lamppost to consider. Subjects were asked,“Is the lamppost’s shadow con-sistent or inconcon-sistent with the shadows in the rest of the scene?”They were given unlimited time to select between (a)“Consistent,”(b)“Inconsistent.”They were then asked to rate their confidence in their decision using a 100-point
Likert-type scale, from 0 (not at all confident) to 100 (extremely confident).
After completing the shadow task, subjects were asked a series of questions about their demographics, interest in 6The horizontal and vertical axes are defined as the image plane, and thezaxis
is the optical axis of the camera. To give a sense of scale, the width of the road in the scene is 14.3 m, and the lamppost height is 11.2 m.
[image:5.595.307.545.50.572.2]photography, video gaming experience, and whether they had experienced any technical difficulties while completing the experiment (see Table6in Appendix A for exact questions). Finally, subjects received feedback on their performance.
Results and discussion
For all experiments, we calculated the mean and median re-sponse time per image and report these in Table7in Appendix A. For all experiments, we followed Cumming’s (2012) rec-ommendations and calculated a precise estimate of the actual size of the effects.
Overall accuracy Can people identify whether scenes have consistent or inconsistent shadows? Overall, a mean 61% of the scenes were correctly classified. Given that there were only two possible response options, chance performance is 50%, thus subjects scored a mean 11 percentage points better than chance. This difference equates to subjects’performance being a mean 22% better than would be expected by chance alone. Subjects showed a limited ability to discriminate be-tween consistent (75% correct) and inconsistent (46% correct) shadow scenes, discrimination (d') = 0.41, 95% CI [0.22, 0.59].7These findings offer further empirical support for the idea that people have only limited sensitivity to lighting in-consistencies (e.g., Farid & Bravo,2010; Ostrovsky et al.,
2005). Thus it appears that subjects did not use the informa-tion available within the scene to work out the answer objec-tively. Furthermore, they showed a bias towards accepting the shadow scenes as consistent response bias (c) = 0.29, 95% CI [0.20, 0.38]. Presumably, our subjects had a relatively conser-vative criterion for judging that shadows were inconsistent with the scene light source and typically accepted them as consistent.
Image metrics and individual factorsNext, we tested whether people’s accuracy on the shadow task was related to the dif-ference between the position of the projected light source for the scene and the projected light source for the inconsistent shadow. To achieve this, we calculated the shortest distance between the projected light position for the scene and a line connecting the target lamppost with its inconsistent shadow. In addition, we checked whether two properties of the image itself affected people’s accuracy on the task: (1) whether the light position had moved left or right of the original light position, and (2) the location of the scene light source. Furthermore, to determine whether individual factors played a role in identifying consistent and inconsistent shadows, we gathered subjects’demographic data and details about their interest in photography and video gaming. On the shadow
task, we also asked subjects to rate their confidence for each of their decisions and recorded their response time.
We conducted exploratory analyses to determine how each factor influenced subjects’performance by running two gen-eralized estimating equation (GEE) analyses—one for the in-consistent shadow scenes and one for the in-consistent shadow scenes. Specifically, we conducted a repeated-measures logis-tic regression with GEE because our dependent variables were binary with both random and fixed effects (Liang & Zeger,
1986). The results are shown in Table1.
The distance between the scene light source and inconsis-tent shadow constraint did not predict accuracy on the task. This result suggests that people either are not aware that they can use this geometrical image-based technique for objective-ly verifying the authenticity of shadows or that they make errors when trying to apply this technique. For example, the shadow correspondence problem (Dee & Santos, 2011; Mamassian, 2004) might limit the extent to which subjects were able to accurately estimate the position of the scene light source. Video-game playing was the only variable in the mod-el that had an effect on the likmod-elihood of responding correctly. Those who play video games frequently (at least once or twice a week) were more likely to correctly identify inconsistent shadow scenes than those who do not. At first glance, this finding seems consistent with previous research showing that video gamers outperform non-video-gamers across a range of perceptual measures (for a review, see Green & Bavelier,
2012). Yet a more recent review of these studies highlights a number of methodological flaws in the research (Simons et al.,
2016). These flaws, along with the exploratory nature of the analysis in the current study, limit the extent to which we can draw any firm conclusions about the effect of video gaming on visual tasks.
For the consistent shadow scenes, the distance of the projected light source from the scene had a small effect on the likelihood of responding correctly. Scenes in which the projection of the light onto the image plane was closer to the center of the image were more likely to be identified as con-sistent than scenes in which the light was further from the center. Subjects might have been better able to determine the accuracy of shadows in a scene when the light source was more readily available to use as a guide. Perhaps, then, our subjects were able to make use of the shadow-based analysis technique, but only when it was relatively easy to calculate the location of the projected light source.
For each of the four scenes in our experiment, the projec-tion of the light source was beyond the image plane. Therefore, applying the geometric shadow-based analysis technique with our stimuli required people to use information outside of the image plane. It is possible that this is a difficult task to perform perceptually and that, instead, people tended to more frequently rely on in-plane image cues. We tested this suggestion by running a second GEE analysis for the 7
inconsistent shadow scenes. In this second analysis, we exam-ined whether a new variable measuring the rotation, in de-grees, between the consistent shadow position and the incon-sistent shadow position (computed on the image plane) was related to accuracy on the task. We included this angle differ-ence measure in the second GEE analysis in place of the variable that measured the distance between the scene light source and inconsistent shadow constraint. All other variables in the model remained the same.
As shown in Table2, this time two variables had an effect on the likelihood of responding correctly. First, replicating the result
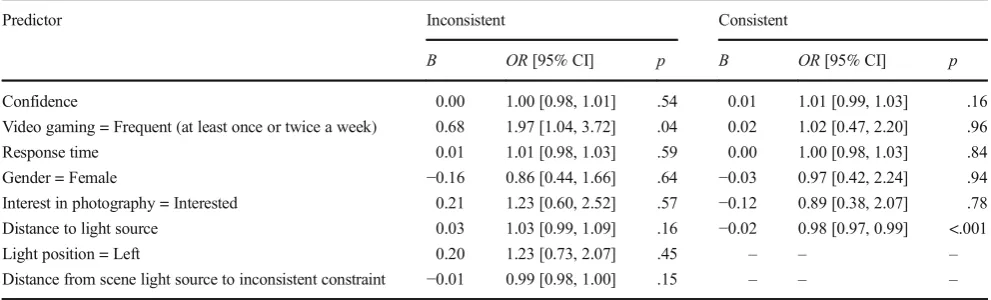
[image:7.595.50.546.70.220.2]of the first model, those who play video games frequently were more likely to correctly identify inconsistent shadow scenes than those who do not. Second, inconsistent shadows positioned fur-ther from the correct position were more likely to be associated with accurate responses than inconsistent shadows positioned closer to the correct position were. This finding suggests that there might be a discernible point at which the inconsistent shad-ow becomes different enough from its correct position to make the inconsistency noticeable—lending support to the notion of a perceptual threshold for detecting lighting inconsistencies (Lopez-Moreno, Sundstedt, Sangorrin, & Gutierrez,2010; Tan Table 1 Results of the GEE binary logistic-regression models to determine variables that predict accuracy in the shadow task
Predictor Inconsistent Consistent
B OR[95% CI] p B OR[95% CI] p
Confidence 0.00 1.00 [0.98, 1.01] .54 0.01 1.01 [0.99, 1.03] .16 Video gaming = Frequent (at least once or twice a week) 0.68 1.97 [1.04, 3.72] .04 0.02 1.02 [0.47, 2.20] .96 Response time 0.01 1.01 [0.98, 1.03] .59 0.00 1.00 [0.98, 1.03] .84 Gender = Female −0.16 0.86 [0.44, 1.66] .64 −0.03 0.97 [0.42, 2.24] .94 Interest in photography = Interested 0.21 1.23 [0.60, 2.52] .57 −0.12 0.89 [0.38, 2.07] .78 Distance to light source 0.03 1.03 [0.99, 1.09] .16 −0.02 0.98 [0.97, 0.99] <.001
Light position = Left 0.20 1.23 [0.73, 2.07] .45 – – –
Distance from scene light source to inconsistent constraint −0.01 0.99 [0.98, 1.00] .15 – – –
Note.CI = confidence interval.Band odds ratios (OR) estimate the degree of change in accuracy associated with one unit change in the independent
variable. An odds ratio of 1 indicates no effect of the independent variable on accuracy; values of 1.5, 2.5, and 4.0 are generally considered to reflect small, medium, and large effect sizes, respectively (Rosenthal,1996). The category order for factors was set to descending to make the reference level zero. The reference groups are video-game playing = infrequent (never/less than once a month/about once a month/a couple of times a month); gender = male; interest in photography = not interested; light position = right. Response time, confidence, distance of light source from the scene, and angle difference were added as continuous variables. The three subjects who chose not to disclose their gender were excluded from these analyses, leaving a total sample ofn= 99. The light position and distance from scene light source to inconsistent constraint predictor variables were not applicable in the consistent shadow scenes.
Table 2 Results of the follow-up GEE binary logistic regression model to determine variables that predict accuracy in the shadow task
Predictor Inconsistent
B OR[95% CI] p
Confidence 0.00 1.00 [0.98, 1.01] .50
Video gaming = Frequent (at least once or twice a week) 0.74 2.09 [1.08, 4.01] .03
Response time 0.00 1.00 [0.98, 1.03] .71
Gender = Female −0.19 0.82 [0.42, 1.61] .57
Interest in photography = Interested 0.18 1.19 [0.57, 2.48] .64
Distance to light source 0.00 1.00 [0.99, 1.01] .68
Light position = Left 0.17 1.18 [0.70, 2.00] .54
Angle difference 0.03 1.03 [1.00, 1.05] .04
Note.CI = confidence interval.Band odds ratios (OR) estimate the degree of change in accuracy associated with one unit change in the independent
[image:7.595.51.544.491.643.2]et al.,2015). In other words, our subjects appeared to hold a basic understanding of where an object’s shadow must cast to be con-sistent with the light source, but their understanding was imprecise.
Overall, subjects were slightly more likely to identify the inconsistent shadows when the angle difference from the cor-rect shadow location was larger compared with when it was smaller. Yet the experimental design meant that there were only eight inconsistent shadow scenes and thus only eight angle differences to examine. In Experiments 2a and 2b, to more precisely estimate the perceptual threshold for identify-ing lightidentify-ing inconsistencies, we asked subjects to rotate a tar-get shadow to the position that they thought was consistent with the lighting of the scene.
Experiments 2a and 2b
The results of Experiments 2a and 2b largely replicate those of Experiment 1, except using a different experimental paradigm. Thus, for brevity, we present full details of Experiments 2a and 2b in Appendix B and summarize the findings here.
In Experiment 2a, subjects were able to change the shadow rotation 360° about the base of the target lamppost; their task was to place the shadow in the position that they believed to be consistent with the other shadows in the scene. Even with this high level of control over the shadow position, subjects were willing to rotate the shadow to a relatively wide range of positions that were inconsistent with the scene lighting—51% of the shadows were posi-tioned between−10° and +10° of the consistent position, 95% CI [46%, 56%]. Although there were differences by scene, overall a mean 20% more shadows were positioned to the left than to the right of the correct location, Mdiff 95% CI [12%, 28%].
In Experiment 2b, subjects could both rotate the shadow and change the size of the shadow. The results were similar to those in Experiment 2a, with 46% of shadows positioned between ±10° of the consistent position, 95% CI [41%, 51%]. Replicating Experiment 2a, collapsed across the four scenes, subjects positioned 16% more of the shadows to the left of the correct position than to the right, Mdiff 95% CI [7%, 25%]. In sum, allowing subjects to adjust the size of the target shadow in Experiment 2b made vir-tually no difference to the pattern of results.
Overall, the results from Experiments 2a and 2b indicate that subjects frequently make imprecise judgements about where shadows must be positioned to be consistent with a single light source. It is important to note, however, that each target shadow in Experiments 2a and 2b was simply the correct one for the given scene rotated around the base of the object. That is, the manipulations were made on the image plane rather than in the 3-D environment. As such, incorrect shadows were also inconsistent with the casting
object in terms of sizes and angles between the lamp and the pole parts of the object/shadow. Therefore it is possible that being able to change the scale of the target shadow did not prevent subjects using the shape of the shadow as a cue. If so, our results might still overestimate people’s ability on the task. To examine this possibility, in Experiment 3, using the 3-D environment, we generated different versions of the target shadow that were inconsis-tent with the scene light source in terms of both orientation and shape. Importantly though, in Experiment 3, each in-consistent shadow option was physically plausible with respect to a single light source (albeit not the scene light source) in terms of its size and angle.
Experiment 3
Method
Subjects and designA total of 114 subjects (M= 25.2 years, SD = 8.4, range: 14–52 years; 48 women, 62 men, four chose not to disclose their gender) completed the task on-line. Five additional subjects were removed because they experienced technical difficulties. We used a within-subjects design.
We developed a program in HTML to randomly select one of the 21 versions of the scene to display. As well as this randomly selected version, subjects were able to scroll through a sequence of another 10 consecutive versions of that same scene—crucially, the sequence always included the con-sistent version. To illustrate, consider, for example, that the program randomly selects Version 1, the subject would be able to scroll through Versions 1 to 11 of the scene. Or, to consider another example, if the program randomly selects Version 15,
then the subject will be able to scroll through Versions 5 to 15 of the scene. Having generated the sequence, the program randomized which of the 11 versions to display first, thus ensuring that subjects did not always start at the extreme end of a sequence. Subjects used the left and right arrow keys on the keyboard to scroll through the 11 versions.
ProcedureThe procedure was the same as in Experiment 1, with one exception: Subjects scrolled through the 11 versions of each scene rather than deciding whether the shadows in each scene were (a) “Consistent”or (b)“Inconsistent.”We asked subjects to select the version of the scene in which the shadow of the target lamppost was consistent with the other shadows in the scene.
Results and discussion
Overall accuracy
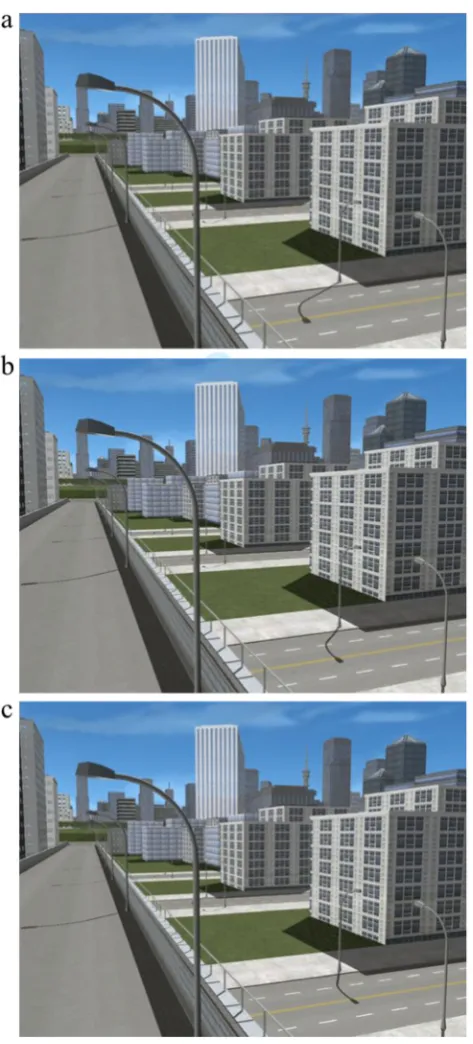
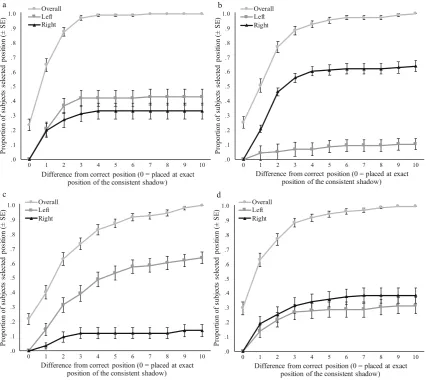
Subjects’performance on the shadow task can be clas-sified in different ways. Taking a conservative approach, we defined an accurate response to be only when subjects selected the (single) consistent version of the scene. Collapsed across the four scenes, the consistent version was selected a mean 25% of the time, 95% CI [21%, 29%]. Given that there were 11 possible response options in the task chance performance is 9%, thus subjects scored a mean 16 percentage points better than chance, 95% CI [12%, 20%]. This difference equates to subjects’ performance being a mean 178% better than would be expected by chance alone. Taking a more lenient approach and defining an accurate response by including one ver-sion either side of the consistent shadow position—that is, when versions 10, 11, or 12 were selected—a mean 55% of shadows were positioned correctly, 95% CI [50%, 59%]. Replicating the findings from Experiments 2a and 2b (see Appendix B), Fig. 4 shows that subjects were least accurate for Scene 3, with a mean 40% selecting Versions 10, 11, or 12, 95% CI [31%, 49%]. In contrast to the previous experiments, however, subjects were most accurate for Scene 1, with a mean 65% selecting Versions 10, 11, or 12, 95% CI [56%, 74%]. There is no immedi-ately obvious reason as to why subjects did relatively well on Scene 1 in Experiment 3. Speculatively, it is possible that the shape of the target shadow in Experiments 2a and 2b actually made the inconsistent positions seem more plausible rather than less plausible in Scene 1.
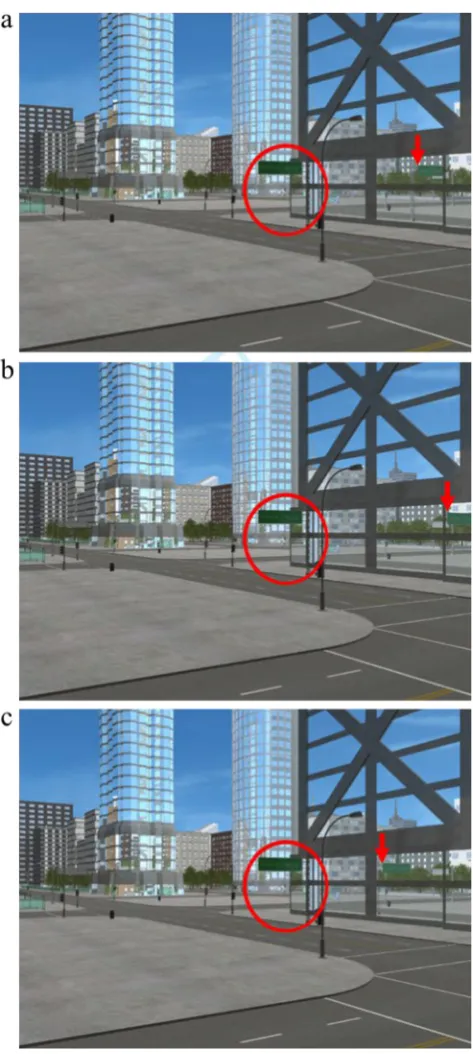
Preference for shadows to the left or rightIn contrast to the results of Experiments 2a and 2b (see Appendix B), collapsing across all four scenes, the shadows were equally likely to be positioned to the left or to the right of the correct location, Mdiff = 0%, 95% CI [−8%, 7%]. Yet as Fig.4shows, there was still variation by scene. In line with our previous Fig. 3 Example versions of Scene 3.aVersion 4, inconsistent.bVersion
[image:9.595.52.289.48.571.2]experiments, subjects were more likely to position the target shadow left of the correct position in Scene 3. And again, in Scene 2, subjects were more likely to position the target shad-ow right of the correct position. This time, in both Scenes 1 and 4, a similar proportion of subjects selected a target shadow to the left of its correct location as to the right.
Overall, the pattern of results across our four shadow experiments was largely consistent. Most importantly, the experiments suggest that people have a limited ability to identify consistent and inconsistent shadows. This finding is somewhat surprising considering that subjects viewed scenes in which there was sufficient information to deter-mine the answer objectively. Next, we consider the extent to which people make use of reflections to identify authen-tic and manipulated scenes.
Part 2: Reflections
Shortly after the November 2015 Paris terrorist attacks, a doc-tored photo depicting an innocent man—Veerender Jubbal—as one of the attackers circulated online and in newspapers (Butterly,2015; Rawlinson,2015). Although many major news outlets were fooled by the image, the manipulation left several prominent clues that the image was a fake. Crucially, when Jubbal photographed his reflection, he was standing straight-on to the mirror, which means that the camera used to capture the photo must also be visible in the reflection. In the authentic version of the photo, the iPad® used to capture the photo can be seen clearly in the reflection (Jubbal,2016). Yet in the manip-ulated version of the image, the forgers replaced the iPad®with a Qur’an, thus making it a geometrical impossibility for the image Fig. 4 Cumulative proportion of responses made by each version of the
scene for (a) Scene 1, (b) Scene 2, (c) Scene 3, and (d) Scene 4. The light-gray line with circle markers shows the overall proportion of responses made by each inconsistent version of the scene—these are cumulative, and therefore a difference of 1 includes subjects selecting Versions 10, 11, or 12 of the scene. The black line with triangle markers shows the
[image:10.595.85.515.52.432.2]to have been captured. Detecting this basic inconsistency in the geometry of the reflection could have prevented an innocent man from becoming a suspect. To what extent, then, can people use reflections to help to identify whether photos are authentic or manipulated? We explore this question next.
A small number of studies have explored what people un-derstand about mirror reflections8(Bertamini, Spooner, & Hecht,2003; Bianchi & Savardi,2012; Hecht, Bertamini, & Gamer, 2005; Lawson, 2010; Lawson & Bertamini, 2006; Muelenz, Hecht, & Gamer,2010). In one study using a bird’s-eye-view diagram of a room, subjects predicted when a target would first become visible in a mirror (Croucher, Bertamini, & Hecht,2002). In one scenario, for example, sub-jects indicated the point at which a character who walks across the room on a path parallel to the surface of a mirror on the opposite wall would first see their reflection in that mirror. Across a range of these scenarios, subjects made consistent early errors, predicting that the character would be able to see their reflection before reaching the edge of the mirror (a phys-ically impossible occurrence). These findings suggest that people’s understanding of reflection is limited and biased.
Yet, if people have such a limited understanding of reflec-tions, why can they make effective use of mirrors in everyday life—for instance, when driving or checking their appearance? One possibility is that when using real mirrors the availability of perceptual information allows people to use them effective-ly. Typically, such information is not available in experimental reflection tasks (Bertamini et al.,2003; Croucher et al.,2002; but see Lawson & Bertamini,2006), so people might rely on perceptual biases instead. For example, Muelenz et al.’s (2010) findings suggest that people hold a perceptual outward bias that causes them to mentally rotate the mirror reflection of the world to make it more orthogonal (at a right angle) with respect to their line of sight. As a result, the mirror reflection appears further away from the observer than it would in reality.
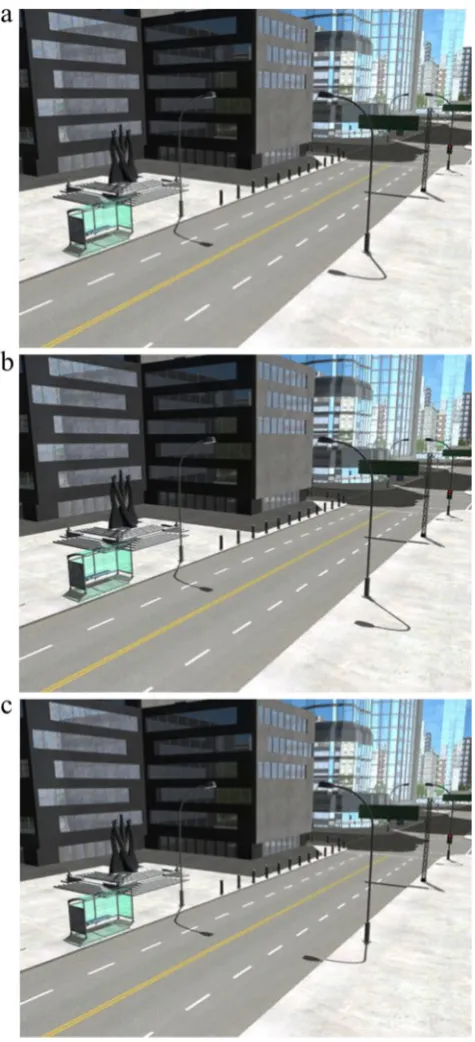
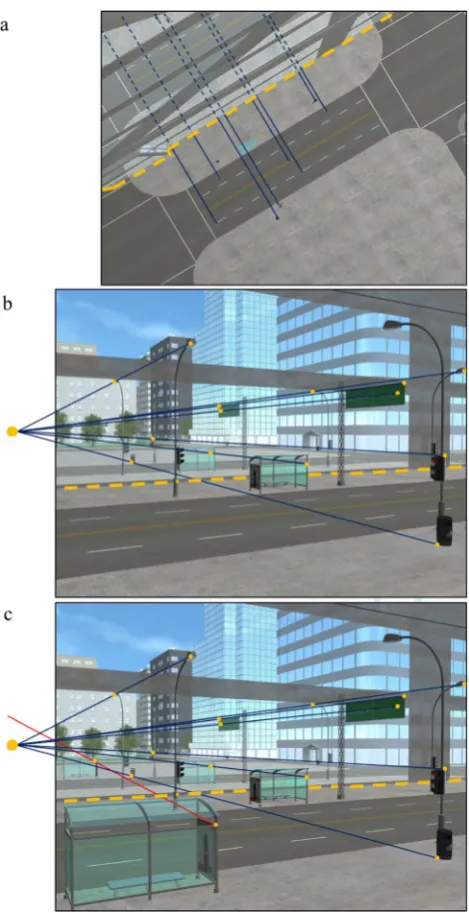
In 2-D scenes, one piece of information that might prove useful and help to override reliance on the outward bias is the reflection vanishing point (Montague,2013). Reflections ad-here to a basic law of optical physics: A smooth surface will reflect the light at the same angle that it hits the surface (Hecht & Zajac,1974; Ronchi,1970). As shown in Fig.5a, a result of this optical constraint means that, from a bird’s-eye view, imaginary parallel lines connect points on the real object in front of the mirror with the same points on the object’s reflec-tion behind the mirror (Farid,2016; O’Brien & Farid,2012). Owing to linear perspective projection, when viewing that same scene but from the viewpoint shown in Fig.5b, the lines that connect object points and their corresponding points in
the reflection will converge to a single point—the reflection vanishing point. Consequently, a geometric-based analysis can be used to objectively verify where the reflection of an 8Although there are two types of reflection, in this paper we focus on specular
reflection—the reflection of light from a smooth surface, such as a flat mirror or window.
[image:11.595.308.543.49.506.2]object in the world should appear in a mirror. Furthermore, adding fake reflections into a photo, or manipulating a photo that contains reflections, can create inconsistencies that can be identified using geometric-based analysis. If a line connecting a point on an object and its corresponding point in the reflec-tion does not intersect the reflecreflec-tion vanishing point, it high-lights an inconsistency (O’Brien & Farid,2012). As shown in Fig.5c, the bus stop’s reflection is inconsistent with the reflec-tion vanishing point that is consistent with the rest of the scene, indicating that some manipulation has occurred. This reasonably simple analysis based on the geometric relation-ship between objects and their reflections is used in digital image forensics to help identify fakes (O’Brien & Farid,
2012). Although this analysis uses reflections and the reflec-tion vanishing point, it works using the exact same geometric constraint as with shadow analysis.
What is still unknown, however, is whether people can identify the presence of consistent and inconsistent reflections in complex scenes when there is sufficient information avail-able that, theoretically, makes it possible to determine the lo-cation of the reflection vanishing point.
Experiment 4
Method
Subjects and designA total of 799subjects (M= 26.6 years, SD= 10.8, range: 13–68 years, 39 men, 38 women, two chose not to disclose their gender) completed the study online. Five additional subjects were removed: four experienced technical difficulties, and one had missing response time data for at least one response on the task. We used a within-subjects design.
StimuliWe created five different outdoor city scenes from the same 3-D cityscape model that was used to create the shadow scenes in Experiments 1–3. All scenes were rendered as TIF files at a resolution of 960 × 720 pixels. Each of the five scenes included a flat, smooth reflective surface (part of a building frontage). In each scene, the target object was a street sign placed adjacent to the reflective surface so that the sign and its reflection were both visible. To ensure that subjects could use geometric analysis to locate the reflection vanishing point, we made a number of other nontarget objects and their corresponding reflections visible in the scene. The scenes were rendered without shadows (by using ambient lighting, but no directional light) to ensure that we did not provide subjects with any additional cues that would influence their
ability on the reflection task. These five scenes were the orig-inals with consistent reflections.
To create our inconsistent reflection scenes, we began by rendering each scene two more times; once with the street sign moved forward relative to the original street sign position (+7 m on the axis that is parallel to the reflection plane) and once with the street sign moved backward relative to the original street sign position (−7 m on the axis that is parallel to the reflection plane; see Fig.6). We then manipulated the images using GNU Image Manipulation Program® (GIMP, Version 2.8). First, we removed the street sign’s reflection in the orig-inal scene, importantly, the origorig-inal street sign itself remained in the scene. Second, we cut the reflection of the street sign from one of the other scenes with the street sign moved for-ward or backfor-ward. We then overlaid this reflection onto the original scene (see Fig.7for an example of the consistent and inconsistent versions of a scene).
Overall, we produced three versions of each of the five city scenes (15 images in total). The original, nonmanipulated ver-sion of each of these scenes was used to create our consistent reflection image set. The two manipulated versions of each scene were used to create our inconsistent reflection image set. Subjects saw two consistent-reflection and two inconsistent-reflection images presented at random, but always in a differ-ent city scene. The fifth city scene was used as a practice.
ProcedureWe used the same procedure as Experiment 1, with the following changes: (1) We cued subjects’attention to the target street sign on which they needed to base their response, and (2) we asked,“Is the street sign’s reflection consistent or inconsistent with the other reflections in the scene?”
Results and discussion
Overall accuracy Overall, a mean 50% of the scenes were classified correctly, with chance performance being 50%. Subjects’ability to distinguish between consistent (42% cor-rect) and inconsistent (58% corcor-rect) reflections was not reli-ably greater than zero, d'= −0.01, 95% CI [−0.23, 0.21]. Furthermore, subjects showed a bias toward saying that reflec-tions were inconsistent,c =−0.15, 95% CI [−0.25, -0.06]. These results indicate that subjects found it extremely difficult to determine whether the reflection of the target object was consistent or inconsistent with the other reflections in the scene. Furthermore, the results suggest that subjects did not make use of the geometrical information in the scene to com-pute the reflection vanishing point and objectively determine the answer. Instead, it is possible that subjects had incorrect beliefs about reflections and perhaps relied on these to make a subjective judgement about the consistency or inconsistency of the reflections in the scene (see, e.g., Bertamini et al.,2003; Croucher et al.,2002).
9Data cleaning resulted in the removal of five subjects, leaving the final
Image metrics and individual factorsWe checked whether three properties of the image itself affected people’s accuracy on the task. One image property was simply whether the re-flection had moved forward or backward relative to the con-sistent reflection position (see Fig.7). The second image prop-erty was the distance from the center of the image to the reflection vanishing point. The third image property was an angle measurement—the rotation, in degrees, from the scene’s reflection vanishing point to the reflection vanishing point for the target object and its inconsistent reflection. In addition, to determine whether individual factors played a role in identi-fying consistent and inconsistent reflections, we included the same individual factors as used in the GEE models in Experiment 1.
We conducted exploratory analyses to check how each fac-tor influenced subjects’ performance by running two GEE analyses—one for the inconsistent reflection scenes and one for the consistent reflection scenes. The results are shown in Table3.
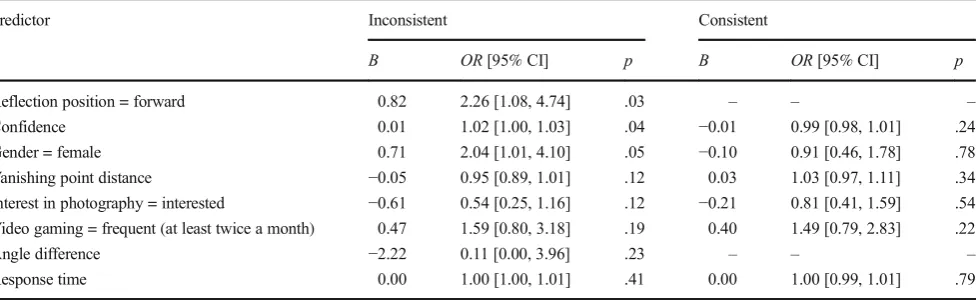
Three variables had an effect on subjects’ability to accurately identify inconsistent reflection scenes: reflection position, confi-dence, and gender. Scenes in which the reflection was moved forward from its consistent position were more likely to be iden-tified as inconsistent compared with scenes in which the reflec-tion was moved backward from its consistent posireflec-tion. Indeed,
the inconsistent reflections that appeared further away rather than closer to the observers’viewpoint were more likely to be incor-rectly accepted as consistent. One possibility is that this result is simply an effect of perspective projection from the 3-D world to the 2-D image. Although the street sign was moved equally in the forward and backward conditions in the 3-D environment, due to perspective projection, the same change in the 3-D environment produces a larger change in the foreground than in the back-ground of the 2-D image. Thus, it follows that people might be more sensitive to changes in the foreground than in the background.
We also found a small effect of confidence, such that more confident responses were slightly more likely to be associated with accurate responses than were less confident responses. Finally, females were slightly more likely to correctly identify inconsistent reflection scenes than males were.10The results of the GEE analysis for the consistent scenes revealed that none of the variables had an effect on subjects’ ability to accurately identify consistent reflection scenes.
In Experiment 4, subjects correctly classified a mean 50% of the scenes indicating their performance was no better than Fig. 6 Example showing the movement of the original street sign and its reflection forward and backward parallel to the reflection plane.
10Given the plausibly small effect size, and also because we did not replicate
[image:13.595.82.513.48.374.2]expected by chance alone. These results suggest that people have an extremely limited ability to identify when the reflections
within a scene are consistent versus inconsistent; this is despite the fact that each scene contained sufficient information to deter-mine the answer objectively. There are at least two reasons, how-ever, for why it might have been too difficult to make use of the reflection vanishing points in Experiment 4. First, the scenes’ reflection vanishing point was located a mean 1,386 pixels from the image center (image resolution 960 × 720 pixels), a distance that might have been sufficiently large to make it difficult to use this information. Second, in the inconsistent scenes, the mean angle difference between the target object’s reflection vanishing point and the reflection vanishing point for the rest of the scene was just 1°. Perhaps these two factors made it too difficult for subjects to use the geometrical information and locate the reflec-tion vanishing point. For these reasons, and because relatively little research has examined people’s perception of reflections, we conducted a further experiment with new stimuli. For the new stimuli we decreased the distance of the reflection vanishing point from the center of the image and increased the angle differ-ence from the scene reflection vanishing point to the vanishing point for the target object and its inconsistent reflection.
Experiment 5
Method
Subjects and designA total of 97 subjects (M= 25.5 years, SD = 9.0, range: 15–57 years, 58 men, 36 women, three chose not to disclose their gender) completed the study online. Eight additional subjects were excluded from the analyses because they experienced technical difficulties. The design was identical to that of Experiment 4.
Stimuli We created the stimuli following the procedure in Experiment 4, with two exceptions. First, we changed the viewing perspective to bring the reflection vanishing point closer to the center of the image—the mean distance was 660 pixels (cf. Experiment 4: 1,386 pixels). Second, to in-crease the angle difference between the original, consistent reflection and the manipulated, inconsistent reflection, we moved the street sign 10 m on the zaxis (cf. Experiment 4: 7 m). The resulting mean angle difference between the reflec-tion vanishing point for the inconsistent reflecreflec-tions and the reflection vanishing point for the rest of the scene was 3.5° (cf. Experiment 4: 1°; see Fig.8for an example of the consis-tent and inconsisconsis-tent versions of a scene).
Procedure The procedure was identical to that used in Experiment 4.
Results and discussion
Overall accuracyOverall, subjects correctly classified a mean 73% of the reflection scenes (cf. Experiment 4: 50%). Fig. 7 Example of the consistent and two inconsistent versions of a
[image:14.595.52.289.48.576.2]Subjects showed a reasonably good ability to discriminate between consistent (72% correct) and inconsistent (75% cor-rect) reflection scenes,d'= 0.91, 95% CI [0.72, 1.10]. Unlike in Experiment 4, these results suggest that subjects have some ability to identify consistent and inconsistent reflections. Perhaps, then, subjects make use of the reflection vanishing point to objectively judge the consistency of the reflections in a scene, but only in instances where the vanishing point is relatively easy to determine. In addition, in contrast to Experiment 4, subjects did not show a bias toward saying that reflections were inconsistent,c=−0.03, 95% CI [−0.12, 0.07]. This finding offers some support for our suggestion that peo-ple might only rely on perceptual biases to make judgements about reflections when there is a lack of information available to make a more informed decision.
Individual factors and image metricsAs in Experiment 4, we conducted two exploratory GEE analyses—one for the in-consistent and one for the in-consistent reflection scenes. Preliminary analyses revealed a variance inflation factor of 11.8 for the angle difference variable, suggesting that this variable was correlated with one or more of the other predictor variables, therefore we removed the angle differ-ence variable from the analyses. The results of the GEE analyses are shown in Table 4. Replicating our finding from Experiment 4, more confident responses were slightly more likely to be associated with accurate responses than less confident responses were. There was also an effect of distance from the center of the image to the reflection vanishing point; scenes in which the reflection vanishing point was closer to the image were more likely to be iden-tified as inconsistent compared with scenes in which the
reflection vanishing point was further from the image. This time, however, we did not find an effect of reflection po-sition or gender.
Considering the consistent reflection scenes, the GEE analysis revealed that only one variable had an effect on accuracy—the distance of the reflection vanishing point. As with the inconsistent scenes, when the reflection vanishing point was closer to the center of the image the scenes were more likely to be identified as consistent com-pared with when it was further from the center. It appears, then, that people might be able to make use of the geomet-rical information provided in the scenes to objectively judge the validity of the reflections when the reflection vanishing point is closer to the center of the image.
That said, another possibility is that moving the incon-sistent reflections further from the conincon-sistent position in Experiment 5 than in Experiment 4 made it more visually apparent when the reflections were consistent versus in-consistent. If so, perhaps even based on a visual inspection of the scene, the correspondence between the object and its reflection did not match people’s subjective expectation of how it should look—including for the backward inconsis-tent reflections.
[image:15.595.56.545.70.220.2]So why did subjects perform better on the reflection task in Experiment 5 than in Experiment 4? Given that we made two changes to the stimuli between Experiments 4 and 5, there are two possible reasons. One possibility is that cre-ating scenes with the reflection vanishing point closer to the center of the image made it easier for people to use geometric analysis to work out the answer. A second pos-sibility is that the bigger physical distance between the consistent and inconsistent reflection position made it Table 3 Experiment 4. Results of the GEE binary logistic models to determine variables that predict accuracy in the reflection task
Predictor Inconsistent Consistent
B OR[95% CI] p B OR[95% CI] p
Reflection position = forward 0.82 2.26 [1.08, 4.74] .03 – – – Confidence 0.01 1.02 [1.00, 1.03] .04 −0.01 0.99 [0.98, 1.01] .24 Gender = female 0.71 2.04 [1.01, 4.10] .05 −0.10 0.91 [0.46, 1.78] .78 Vanishing point distance −0.05 0.95 [0.89, 1.01] .12 0.03 1.03 [0.97, 1.11] .34 Interest in photography = interested −0.61 0.54 [0.25, 1.16] .12 −0.21 0.81 [0.41, 1.59] .54 Video gaming = frequent (at least twice a month) 0.47 1.59 [0.80, 3.18] .19 0.40 1.49 [0.79, 2.83] .22
Angle difference −2.22 0.11 [0.00, 3.96] .23 – – –
Response time 0.00 1.00 [1.00, 1.01] .41 0.00 1.00 [0.99, 1.01] .79
Note.CI = confidence interval.Band odds ratios (OR) estimate the degree of change in accuracy associated with one unit change in the independent
easier to make a subjective judgement about the consisten-cy or inconsistenconsisten-cy of the reflections in the scene. To check which explanation best accounts for people’s better
performance in Experiment 5, we ran a further experiment in which we changed only one variable. In Experiment 6, the scene reflection vanishing point remained the same as in Experiment 5, but we decreased the distance between the inconsistent and the consistent reflection position to match the distance in Experiment 4.
Experiment 6
Method
Subjects and designA total of 120 subjects (M= 30.9 years, SD = 13.7, range: 14–77 years, 53 men, 62 women, five chose not to disclose their gender) completed the study online. A further 10 subjects were excluded from the anal-yses because they experienced technical difficulties. The design was identical to that of Experiments 4 and 5.
StimuliThe stimuli remained the same as in Experiment 5 with one exception: We decreased the distance that we moved the street sign reflection from its consistent position when creating the inconsistent scenes. In Experiment 5, we moved the street sign 10 m on the z axis relative to the original street sign position; this time we moved it the same distance as in Experiment 4 (7 m). The resulting mean angle difference between the reflection vanishing point for the inconsistent reflections and the reflection vanishing point for the rest of the scene was 2.4° (cf. Experiment 5: 3.5°).
Procedure The procedure was identical to that used in Experiments 4 and 5.
Results and discussion
[image:16.595.53.289.46.568.2]Overall accuracyOverall, subjects correctly classified a mean 62% of the reflection scenes (cf. Experiment 4: 50%; Experiment 5: 73%). Subjects showed a fairly limited ability to discriminate between consistent (68% correct) and incon-sistent (55% correct) reflection scenes,d' = 0.46, 95% CI [0.27, 0.65]. Our results show that subjects in Experiment 6 correctly classified a mean 24% more of the reflection scenes as consistent or inconsistent than subjects in Experiment 4, a difference of 12 percentage points. This difference in perfor-mance suggests that the position of the reflection vanishing point might influence people’s ability to distinguish between consistent and inconsistent reflection scenes. Yet subjects in Experiment 6 correctly classified a mean 15% fewer of the scenes as consistent or inconsistent than subjects in Experiment 5, a difference of 11 percentage points, indicating that the extent of the inconsistency might also have an effect on people’s performance. In line with this suggestion, in Experiment 5 the inconsistent reflections were positioned Fig. 8 Example of the consistent and two inconsistent versions of a
further from the consistent position than in Experiment 6, and we did not find evidence of a response bias. Yet in Experiment 6, subjects showed a bias toward accepting the reflection scenes as consistent, c = 0.12, 95% CI [0.04, 0.21]. Taken together, these results suggest that people might have a relatively conservative criterion for judging that the reflections in a scene are inconsistent. As such, it is possible that people have a perceptual threshold for detecting reflection inconsistencies—that is, there is a point at which the inconsistent reflections are close enough to the consistent position that people will find it extremely difficult to detect the inconsistency; instead, they simply accept the reflection as consistent.
Image metrics and individual factors Table 5 shows that none of the variables had a significant effect on subjects’ ability to accurately identify consistent reflection scenes. Only one variable had an effect on subjects’ ability to accurately identify inconsistent reflection scenes: Replicating Experiment 4, we found an effect of reflec-tion posireflec-tion. Scenes in which the reflecreflec-tion was moved forward of its consistent position were more likely to be identified as inconsistent than scenes in which the reflec-tion was moved backward. This result might simply be an effect of perspective projection: The same change in the 3-D environment produces a larger change in the foreground than in the background of the 2-D image,
Table 5 Experiment 6. Results of the GEE binary logistic models to determine variables that predict accuracy in the reflection task
Predictor Inconsistent Consistent
B OR [95% CI] p B OR [95% CI] p
Reflection position = forward 1.13 3.10 [1.84, 5.23] <.001 – – – Confidence 0.01 1.01 [0.99, 1.02] .42 0.01 1.01 [1.00, 1.03] .12 Gender = female 0.21 1.23 [0.65, 2.31] .52 −0.34 0.71 [0.32, 1.57] .40 Vanishing point distance −0.09 0.91 [0.81, 1.03] .13 −0.08 0.93 [0.81, 1.06] .28 Interest in photography = interested −0.03 0.97 [0.52, 1.79] .92 0.46 1.59 [0.82, 3.10] .17 Video gaming = frequent (at least twice a month) 0.36 1.43 [0.75, 2.73] .28 0.39 1.47 [0.71, 3.06] .30 Response time 0.00 1.00 [0.99, 1.01] .59 −0.01 0.99 [0.98, 1.00] .15
Note.CI = confidence interval.Band odds ratios (OR) estimate the degree of change in accuracy associated with one unit change in the independent
variable. An odds ratio of 1 indicates no effect of the independent variable on accuracy; values of 1.5, 2.5, and 4.0 are generally considered to reflect small, medium, and large effect sizes, respectively (Rosenthal,1996). The category order for factors was set to descending to make the reference level zero. The reference groups are reflection position = back; video-game playing = infrequent (never/less than once a month/about once a month); gender = male; interest in photography = not interested. Response time, confidence, and reflection vanishing point distance were added as continuous variables. The five subjects who chose not to disclose their gender were excluded from these analyses, leaving a total sample ofn= 115. The reflection position predictor variable was not applicable in the consistent reflection scenes.
Table 4 Experiment 5. Results of the GEE binary logistic models to determine variables that predict accuracy in the reflection task
Predictor Inconsistent Consistent
B OR[95% CI] p B OR[95% CI] p
Reflection position = forward 0.04 1.05 [0.53, 2.08] .90 – – – Confidence 0.02 1.02 [1.01, 1.04] .002 −0.01 0.99 [0.97, 1.01] .35 Gender = female −0.40 0.67 [0.29, 1.57] .36 −0.43 0.65 [0.28, 1.53] .33 Vanishing point distance −0.17 0.84 [0.71, 1.00] .04 −0.21 0.81 [0.71, 0.93] .002 Interest in photography = interested 0.08 1.08 [0.47, 2.48] .85 −0.12 0.89 [0.42, 1.90] .76 Video gaming = frequent (at least twice a month) −0.35 0.70 [0.30, 1.64] .42 0.77 2.16 [0.98, 4.76] .06 Response time 0.00 1.00 [0.98, 1.02] .88 0.00 1.00 [0.99, 1.01] .89
Note.CI = confidence interval.Band odds ratios (OR) estimate the degree of change in accuracy associated with one unit change in the independent
and thus people are more sensitive to changes in the foreground than in the background.
Our finding that there was an influence of reflection position in Experiments 4 and 6, but not in Experiment 5, suggests a perceptual threshold for detecting when reflections in a scene are inconsistent. Put simply, in Experiment 5, when the inconsistent reflections were moved 10 m from the consistent position, we did not find a reliable effect of reflection position on subjects’ ability to identify the inconsistent scenes. Yet in Experiments 4 and 6 when the inconsistent reflections were moved a smaller distance (7 m) from the consistent position, we did find a reliable effect of reflection posi-tion on performance. These findings suggest that there might be a point at which the inconsistent reflection be-comes different enough from its consistent position to make the inconsistency noticeable.
That said, it is important to note that adjusting the distance of the inconsistent reflections from the original position also changes the angle difference between the scene reflection vanishing point and the reflection vanishing point for the in-consistent reflection—as the distance increases, so does the angle difference. Thus, we are not able to isolate the two factors and test them individually. Although our results appear to support the notion of a perceptual threshold in people’s ability to subjectively determine the validity of the reflections based on a visual inspection of the scene, we cannot rule out an alternative explanation. Instead, it remains possible that changes to the angle difference between the scene reflection vanishing point, and the reflection vanishing point for the inconsistent reflection affects people’s ability to use the geo-metric information in the scene.
To establish whether the angular difference or the vanishing point distance was more strongly associated with accuracy on the reflection task, we combined the data from Experiments 4, 5, and 6 (N= 296) and calculated the mean angular difference and the mean vanishing point distance. For each subject, we calculated the number of correct responses on the inconsistent trials—0, 1, or 2.
We ran an ordinal logistic regression with two inde-pendent variables: (1) the mean angular difference from the scene’s reflection vanishing point to the reflection vanishing point of the target object and its inconsistent reflection, and (2) the mean distance from the center of the image to the reflection vanishing point. Our results revealed that both of these variables had an effect on the likelihood of responding correctly. First, an increase in the angular difference was associated with an increase in the number of correct responses (OR = 2.14, 95% CI [1.53, 3.00]). Second, although only a small effect, an
increase in distance to the vanishing point was associated with an increase in the number of correct responses (OR = 1.05, 95% CI [1.01, 1.08]). At first glance this effect of vanishing point distance seems somewhat surprising— intuitively, a vanishing point closer to the center of the image would be easier to determine than one that is located further away. Therefore, perhaps subjects did not make use of the reflection vanishing point when de-ciding whether the reflections in each scene were consis-tent or inconsisconsis-tent. An accurate reconstruction of the reflection vanishing point offers an objective technique for verifying the (in)consistency of the reflections in a scene. Nonetheless, this reconstruction is a perceptually challenging task that requires accurately locating numer-ous object and corresponding reflection points as well as mapping these corresponding points as lines that extend beyond the image plane. Accordingly, our findings sug-gest that when deciding whether the reflections in a scene were consistent or inconsistent, subjects tended to rely on the appearance of the in-plane image cues rather than attempting to determine the reflection vanishing point.
In summary, across three experiments we examined people’s ability to identify whether scenes contained con-sistent or inconcon-sistent reflections. The results of Experiment 4 suggest that people have an extremely lim-ited ability to identify when reflections in a scene are consistent or inconsistent. Yet, in Experiment 5, when we brought the reflection vanishing point closer to the center of the image and also moved the inconsistent re-flections further from the consistent position, subjects’ performance on the task improved. Moreover, in Experiment 6 we kept the vanishing point position the same as in Experiment 5, but decreased the distance be-tween the inconsistent and the consistent reflection posi-tion to match the distance in Experiment 4. Subjects then correctly classified fewer of the consistent and inconsis-tent scenes than in Experiment 5, but more than in Experiment 4. Thus, it seems that people’s understanding of how reflections should appear in images is not straightforward, but rather might depend on various fac-tors, including the location of the reflection vanishing point and the extent of the inconsistency.
General discussion
depended to some degree on the size of the inconsistency. Given the ubiquity of image manipulation, it is important to consider what our results reveal about how people process visual information. In doing so, we aim to highlight other possible avenues for improving people’s ability to distinguish between real and fake images.
The current findings add to our theoretical understand-ing of how the visual system processes information. Although people seemingly experience a detailed and coherent picture of the world, the striking finding that people are slow to detect even large changes that occur during a real or simulated eye blink suggests that this is not the case (e.g., Pashler, 1988; Simons, 1996; Simons & Levin, 1997). Why, then, do people have the impres-sion of observing a richly detailed and coherent world? From the standpoint of coherence theory, this impression is the result of a visual system that generates a sparse and incomplete representation of the scene whereby most parts are represented only at a preattentive level (Rensink, 2000, 2002). This incomplete representation is achieved via a low-level subsystem that involves an automatic and continual processing of the visual scene to generate simple visual elements without the awareness of the observer. According to coherence theory, a limited-capacity attentional subsystem can form a subset of vi-sual elements into a coherent and detailed object representation—this is the basis of conscious perception. Owing to a finite attentional capacity, these detailed, conscious representations are only created for the objects needed for the task at hand. The attentional subsystem is guided via a combination of low-level factors (e.g., sa-lience of individual elements) and high-level factors (e.g., knowledge) to create representations of the appro-priate objects at the approappro-priate time. Together, these subsystems can provide the impression that perceptions are stable and highly detailed, even though a complete representation of the scene is never constructed.
Furthermore, previous research has shown that when people take an effortful approach to attend to the details of a scene, aspects such as shadows and reflections rare-ly receive attention (Ehinger et al.,2016; Rensink, 2002; Rensink & Cavanagh, 2004; Sareen, Ehinger, & Wolfe,
2015). As such, researchers have suggested that shadow and reflection information is typically processed by the low-level visual system that rapidly identifies and then discounts these features (Rensink & Cavanagh, 2004; Sareen et al., 2015). Indeed, this insensitivity to shadow and reflection information can account for our finding that, even when cued to the target object and its shadow, people struggled to make an accurate subjective judgement
about whether or not these aspects of the scene were consistent or inconsistent. Specifically, if people discard information about shadows and reflections at an early stage of visual pro-cessing, then it follows that they will not have an opportunity to learn how these aspects should appear. Yet when we looked more closely at the results of our shadow and reflection ex-periments, we found that the extent of the inconsistency influ-enced people’s performance. That is, under the current exper-imental conditions, people were more likely to detect incon-sistent shadows and reflections when they were positioned further from the correct position. As such, our results fit with the notion of a perceptual threshold for detect-ing lightdetect-ing inconsistencies based on cues within the image plane (Lopez-Moreno et al., 2010; Tan et al.,
2015).