warwick.ac.uk/lib-publications
A Thesis Submitted for the Degree of PhD at the University of Warwick
Permanent WRAP URL:
http://wrap.warwick.ac.uk/117205
Copyright and reuse:
This thesis is made available online and is protected by original copyright. Please scroll down to view the document itself.
Please refer to the repository record for this item for information to help you to cite it. Our policy information is available from the repository home page.
PARTIAL CHARGING IN PLUG-IN ELECTRIC
VEHICLES
Sina Shojaei
A thesis submitted in fulfilment of the requirements for the
degree of Doctor of Philosophy in Engineering
University of Warwick
Ambient conditions can have a significant impact on the temperature of the battery of electrified vehicles. In hot geographical locations, high battery temperatures can be experienced when the vehicle is parked and cooling is absent. This has three negative implications for the vehicle performance attributes: first, it accelerates the ageing mechanisms of the battery and leads to short battery lifetime; second, it necessitates inhibition of the battery power as a safety measure and leads to low traction in electric vehicles or poor fuel economy in hybrid electric vehicles; third, it increases the battery cooling load which reduces the cooling power available to the cabin and leads to poor passenger thermal comfort.
Eliminating the high battery temperatures that result from exposure to hot ambient conditions requires a comprehensive battery cooling strategy; one in which the battery can be cooled when the vehicle is driven or when parked. In the current state of the art battery cooling strategy, cooling is only available when the vehicle is driven and when it is plugged in. Practical concerns such as the associated energy consumption have discouraged battery cooling when the vehicle is parked and not plugged in (key-off). Since passenger vehicles typically experience long key-off intervals, the existing battery cooling strategies are insufficient in hot ambient conditions.
The main contribution of this research is proposing the application of key-off battery cooling and developing an underpinning methodology for evaluating the benefits of key-off cooling in a plug-in hybrid electric vehicle. Key-off cooling is defined as an optimal control problem and solved in view of the 24-hour duty cycle of the vehicle evaluated by a representative model. This new methodology enables applying key-off cooling based on the requirements of one or more of the attributes of battery lifetime, thermal comfort and fuel economy, enabling consideration of these attributes in applying battery cooling in an optimal manner. The results show that while the effectiveness of key-off cooling depends on the duty cycle of the vehicle, it generally improves the battery lifetime and benefits the thermal comfort and the fuel economy attributes.
i
List of Figures ... ix
List of Tables... xvi
Nomenclature ... xix
List of Acronyms ... xxiii
Aknowledgements ... xxiv
Peer-reviewed Publications ... xxv
Declaration ... xxvi
Chapter 1 INTRODUCTION ... 1
Motivation ... 1
Contribution to knowledge ... 4
Organisation of the thesis ... 5
Chapter 2 BACKGROUND ... 7
Design considerations in PHEVs ... 7
2.1.1 Energy management in PHEVs ... 10
2.1.2 Energy efficiency of PHEVs ... 13
2.1.3 Charge patterns... 15
Battery technologies ... 16
2.2.1 High-level design requirements ... 17
2.2.2 Basic technical definitions [99,103] ... 19
2.2.3 Ageing of Lithium-ion batteries ... 20
2.2.4 Battery cooling requirements ... 28
Automotive AC systems ... 31
ii
Effect of hot ambient conditions on cabin and battery temperatures ... 37
Performance attributes affected by the high cabin temperature ... 40
3.2.1 Energy efficiency ... 40
3.2.2 Thermal comfort... 41
3.2.3 Battery lifetime... 42
3.2.4 Mitigation methods ... 42
Performance attributes affected by the high battery temperature ... 45
3.3.1 Energy efficiency ... 45
3.3.2 Thermal comfort... 46
3.3.3 Battery lifetime... 46
3.3.4 Mitigation methods ... 48
3.3.5 Requirement for key-off cooling ... 51
3.3.6 Partial charging and the implication of key-off cooling ... 52
Research question... 53
Summary ... 54
Chapter 4 RESEARCH METHODOLOGY ... 55
High-level assumptions ... 56
4.1.1 Vehicle type ... 56
4.1.2 The duty cycles ... 56
4.1.3 Evaluation of the duty cycles ... 59
System simulation ... 59
4.2.1 Model development ... 60
4.2.2 Evaluation of the performance attributes ... 61
Application of optimisation methods ... 62
iii
Summary ... 63
Chapter 5 THE SUBSYSTEM MODELS ... 65
The target vehicle ... 65
The powertrain subsystem ... 67
5.2.1 The vehicle dynamics ... 68
5.2.2 The driveline ... 69
5.2.3 The electric machine ... 70
5.2.4 The engine ... 70
5.2.5 The battery (electrical model) ... 71
5.2.6 The control logic ... 72
5.2.7 Verification of the powertrain model ... 73
The cabin subsystem ... 79
5.3.1 Key features of the original cabin model ... 80
5.3.2 Modifications to the model ... 81
5.3.3 Verification of the cabin model ... 82
The battery cooling subsystem ... 86
5.4.1 The battery (thermal model)... 87
5.4.2 The coolant circuit... 89
5.4.3 Simulation results ... 89
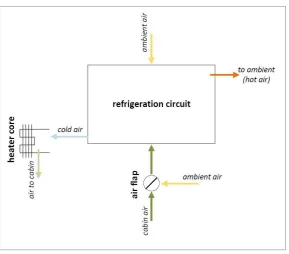
The AC subsystem ... 91
5.5.1 The air handling unit ... 91
5.5.2 The refrigeration circuit ... 92
5.5.3 Steady-state verification of the refrigeration circuit model ... 101
5.5.4 Transient verification of the refrigeration circuit ... 102
Integration of the thermal subsystem models... 106
iv
Summary ... 111
Chapter 6 THE PHEV MODEL ... 113
PHEV assumptions and modifications of the HEV subsystem models ... 113
6.1.1 The electric machine and the powertrain control rules ... 114
6.1.2 The Battery Pack ... 115
Model Integration ... 118
Drive cycle simulation ... 119
6.3.1 WLTC ... 119
6.3.2 S06 ... 120
6.3.3 ARTEMIS ... 121
6.3.4 NEDC ... 122
6.3.5 Energy efficiency over different drive cycles ... 123
6.3.6 Heat Generation over different drive cycles ... 124
Estimation of the battery lifetime ... 126
Summary ... 127
Chapter 7 SIMULATION OF THE PHEV IN HOT CLIMATE CONDITIONS ... 128
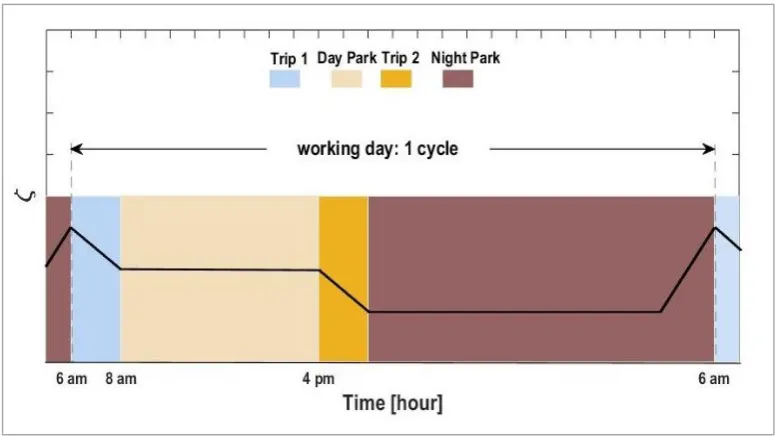
Defining 24-hour duty cycles for the PHEV ... 128
7.1.1 The usage scenario ... 128
7.1.2 The drive cycles ... 129
7.1.3 The ambient conditions ... 130
7.1.4 The pattern of charge ... 131
Simulation results: the duty cycles with US06 trips ... 132
7.2.1 Calculation of the PHEV performance attributes... 137
7.2.2 Simulation results: alternative duty cycles ... 144
v Strategies for improving PHEV performance attributes in hot geographical
locations ... 152
7.3.1 Key-off cooling ... 152
7.3.2 Partial charging ... 160
7.3.3 Summary ... 161
Chapter 8 DEFINING KEY-OFF COOLING AS AN OPTIMAL CONTROL PROBLEM ... 163
Optimal control of key-off cooling for reducing Day Park capacity loss .... 163
Solution for arbitrary initial and final conditions ... 166
8.2.1 Effect of the initial SoC... 169
8.2.2 Effect of charge limitation ... 170
8.2.3 Discussion ... 175
Summary ... 176
Chapter 9 OPTIMAL CONTROL OF KEY-OFF COOLING IN VIEW OF THE DUTY CYCLEv ... 177
Formulating the control of key-off cooling in view of the vehicle duty cycle ... 177
Scenarios for controlling key-off cooling ... 184
Solution for the duty cycle with US06 trips ... 185
9.3.1 Scenario 9-I: Control of key-off cooling for improving fuel economy ... 186
9.3.2 Scenario 9-II: Control of key-off cooling for improving battery lifetime ... 187
9.3.3 Scenario 9-III: Control of key-off cooling based on the trade-off between fuel economy and battery lifetime ... 189
vi 9.3.6 Scenario 9-VI: Control of key-off cooling for improving battery lifetime
and thermal comfort ... 193
9.3.7 Scenario 9-VII: Control of key-off cooling based on a trade-off between fuel economy, battery life, and thermal comfort ... 194
9.3.8 Discussion ... 197
Solution for the duty cycle with NEDCx2 trips ... 200
Applicability of key-off cooling to other drive cycles ... 207
Summary ... 209
Chapter 10 INTEGRATING KEY-OFF COOLING WITH PARTIAL CHARGING ... 212
Integrated control of partial charging and key-off cooling ... 212
Solution for the duty cycle with US06 Trips ... 218
10.2.1 Scenario 10-II: Control of partial charging and key-off cooling for improving battery lifetime... 219
10.2.2 Scenario 10-III: Control of partial charging and key-off cooling based on the trade-off between fuel economy and battery lifetime ... 222
10.2.3 Scenario 10-VI: Control of partial charging and key-off cooling based on battery lifetime and thermal comfort... 224
10.2.4 Scenario 10-VII: Control of partial charging and key-off cooling based on fuel economy, battery lifetime and thermal comfort ... 225
10.2.5 Discussion ... 228
Solution for the duty cycle with NEDCx2 trips ... 231
Summary ... 236
Chapter 11 Discussion ... 238
Generality of the proposed methodologies ... 238
vii
Realisation of the method... 245
Limitations of the research ... 246
11.3.1 Neglecting the electric energy consumed for key-off cooling ... 246
11.3.2 Neglecting the effect of temperature on battery voltage ... 247
11.3.3 Simple battery ageing calculation ... 247
Future work ... 248
Chapter 12 CONCLUSIONS ... 250
Contributions to knowledge ... 250
12.1.1 Optimal control of key-off cooling ... 250
12.1.2 Integration of partial charging and key-off cooling ... 251
12.1.3 General observations from the analyses presented in this thesis .... 251
Conclusions ... 254
REFERENCES ... 256
Appendix 1 Additional model parameters ... 284
A1.1 Range Rover HEV model parameters ... 284
A1.1.1 Powetrain subsystem ... 284
A1.1.2 AC subsystem ... 287
A1.2 The PHEV model parameters ... 289
A1.2.1 The powertrain subsystem ... 289
A1.3 Chevy Volt and BMW i8 parameters ... 290
Appendix 2 Considerations related to the formulation of the optimal control problem in chapter 8... 291
A2.1 Choosing the time interval for control of key-off cooling ... 291
A2.2 Choosing the states represented in the DP state grid ... 292
viii A3.1.1 Scenario 9-III: Control of key-off cooling based on the trade-off
between fuel economy and battery lifetime ... 296
A3.1.2 Scenario 9-IV: Control of key-off cooling for improving thermal comfort ... 297
A3.1.3 Scenario 9-V: Control of key-off cooling based on the trade-off between fuel economy and thermal comfort ... 298
A3.1.4 Scenario 9-VI: Control of key-off cooling for improving battery life and thermal comfort ... 299
A3.2 Integrated optimisation of partial charging and key-off cooling... 300
A3.2.1 Scenario 10-II: Control of partial charging and key-off cooling for improving battery lifetime... 300
A3.2.2 Scenario 10-III: Control of partial charging and key-off cooling based on the trade-off between fuel economy and battery lifetime ... 301
A3.2.3 Scenario 10-VI: Control of partial charging and key-off cooling based on battery lifetime and thermal comfort... 302
Appendix 4 Introduction to optimal control, Dynamic Programming, and Simulated Annealing ... 304
A4.1 The optimal control problem [1] ... 304
A4.1.1 Solving the optimal control problem ... 306
A4.1.2 Realisation of the control strategy in xEVs ... 307
... 307
ix Figure 2-3. Overlap of energy management and powertrain operating modes in a
PPHEV ... 11
Figure 2-4 Schematics of a LiFePO4 battery cell [100] ... 19
Figure 2-5. Recreated from [126]: (a) capacity loss after 20 weeks stroage, and (b)
capacity loss after 1400 Ah cycling (20% DoD around 75% SoC) of 3Ah
Panasonic NCR18650PD battery cells ... 26
Figure 2-6. Recreated from [31]: heat paths to automotive batteries ... 29
Figure 2-7. Schematic of a typical liquid-based battery cooling system with a
low-temperature radiator and a chiller ... 31
Figure 2-8. High level schematic a typical automotive AC system ... 32
Figure 2-9. Recreated from [159] : schematics of a vapour compression
refrigeration circuit. The high temperature and the low temperature sides are denoted as 𝑇𝐻 and 𝑇𝐶 respectively. ... 34
Figure 4-1. Structure of the duty cycles and the approximate variations in battery
SoC ... 58
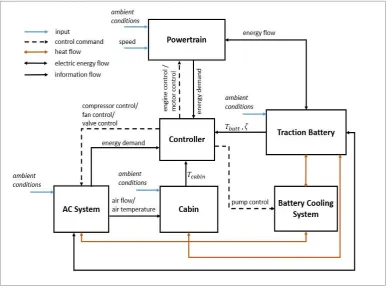
Figure 4-2. Proposed methodology: block diagram of the PHEV model ... 60
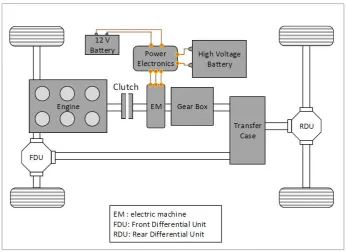
Figure 5-1. Layout of the subsystems in the target vehicle (the passenger cabin is
not shown) ... 66
Figure 5-2. Architecture of the powertrain subsystem ... 67
Figure 5-3. Zero-order equivalent electric circuit model of a battery cell ... 71
Figure 5-4. Verification of the the powertrain model (final 200 seconds of the
results) (a) engine angular velocity, (b) electric machine angular velocity, (c)
engine torque, (d) electric machine torque and (e) SoC. Annotation- blue: test, red:
x and (e) SoC of the battery. ... 77
Figure 5-6. Verification of the powertrain model: (a) vehicle speed, (b) engine
speed, (c) electric machine speed, (d) engine torque, (e) electric machine torque
... 79
Figure 5-7. The thermal network of the cabin model as provided by the industrial
partner ... 80
Figure 5-8. Thermal network of the modified cabin model ... 81
Figure 5-9. Schematics of a typical climatic chamber ... 83
Figure 5-10. (a) vehicle speed (b) cabin, vent and battery temperature during the
pull down test ... 84
Figure 5-11. Variations in the average cabin temperature during hot soak test ... 85
Figure 5-12. Calibration and validation of cabin model against (a) pull-down test,
(b) soak test. (Annotations- blue line: test results, red line: simulation results) .. 86
Figure 5-13. Layout of the battery cooling circuit ... 87
Figure 5-14. Simulation results of battery cooling subsystem model (a) battery
temperature, (b) pump velocity, (c) coolant temperature ... 91
Figure 5-15. Layout of the refrigeration cycle of the target vehicle ... 92
Figure 5-16. Heat exchanger base element: An array of this element is formed to
represent the heat exchanger ... 93
Figure 5-17. Linear regression result for calibrating Nusselt number in
air-refrigerant heat exchanger models (a) evaporator (b) condenser. Annotations- blue:
test data, red: simulation results ... 97
Figure 5-18. Verification of the heat exchanger models: evaporator (left) and
condenser (right) (a) heat flow, (b) refrigerant pressure loss, (c) air side pressure
loss ... 98
Figure 5-19. Verification of heat transfer model in internal flow heat exchangers
against test data (a) IHX (b) chiller. ... 99
Figure 5-20. Verification of the refrigeration circuit model against test rig
measurement: (a) coolant temperature at chiller outlet, (c) average evaporator air
temperature, (d) compressor inlet pressure, (e) compressor outlet pressure.
xi battery cooling flag and (c) compressor speed ... 104
Figure 5-22. Integrated refrigeration and coolant circuits as assumed for transient
verification ... 105
Figure 5-23. Verification of refrigeration and battery cooling circuit models.
Temperature of (a) evaporator air, (b) condenser air, (c) coolant at battery inlet.
Annotations: test result are plotted in blue and simulation results are plotted in
red ... 106
Figure 5-24. Integration of thermal subsystem models ... 107
Figure 5-25. Simulation results of thermal submodel (a) cabin temperature, (b)
battery temperature, (c) evaporator and vent air temperature, (d) coolant
temperature, (g) air flow rate onto evaporator and condenser, (h) coolant flow rate
... 111
Figure 6-1. Electrical architecture of the battery pack ... 115
Figure 6-2. Integration of the subsystem models in Simulink ... 119
Figure 6-3: Simulation results over 3 WLTC cycles: (a) drive cycle and distance,
(b) electric machine and engine speed, and (c) SoC ... 120
Figure 6-4. Simulation result over US06: (a) drive cycle, (b) electric machine and
engine speed, and (c) SoC ... 121
Figure 6-5. Simulation results over Artemis: (a) drive cycle, (b) electric machine
and engine speed, and (c) SoC ... 122
Figure 6-6. Simulation results over NEDC: (a) drive cycle, (b) a electric machine
and engine speed, and (c) SoC ... 123
Figure 6-7. Comparison of (a) temperature rise and (b) heat generation in battery
between different drive cycles ... 125
Figure 6-8. The capacity loss data used for battery lifetime calculation (a) effect
of temperature and SoC after storage for 50 weeks, and (b) effect of temperature
after 1250 charge-discgarge cycles. Data derived from the dataset in [126] ... 126
Figure 7-1. 24-hour speed profile of the vehicle ... 129
Figure 7-2. (a) air temperature, (b) solar irradiance, and (c) humidity in Phoenix,
xii Figure 7-4. Profiles of (a) cabin and battery temperature and (b) battery SoC is
Seattle winter with US06 trips ... 135
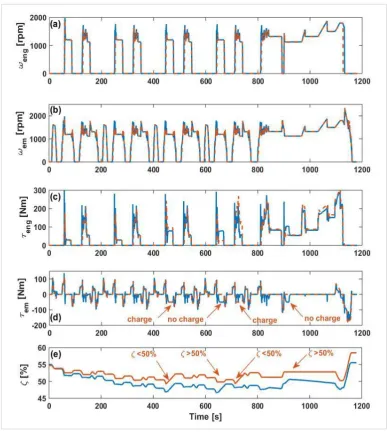
Figure 7-5. Simulation results - (a) vehicle speed, (b) engine torque, (c) battery
SoC and (d) temperature of cabin and battery over the duty cycle comprising of
Phoenix summer climate and US06 trips ... 138
Figure 7-6. Effect of key-on cooling load of the battery on the thermal conditions
of the cabin after hot soak (Trip 2) (a) absolute cabin and vent temperatures, (b)
temperature error. ... 142
Figure 7-7. Duty cycle simulation result for the vehicle operating in Phoenix
summer with different drive cycles: (a) WLTC, (b) Artemis, (c) US06, (d)
NEDCx2. Left hand side: the daily profile of battery temperature (in blue) and
SoC (in red). Right hand side: comparison between engine torque in Trip 1 (in
blue) and Trip 2 (in red) ... 145
Figure 7-8. Breakdown of the ratio of energy flows (trip 2 to trip 1) for the vehicle
operating in Phoenix summer... 150
Figure 7-9. After-run key-off cooling (a) temperature profile (b) seasonal capacity
loss (c) daily energy requirement for 1% reduction of capacity loss ... 153
Figure 7-10. Key-off cooling after 12 pm (a) temperature profile (b) summer
capacity loss, (c) daily energy requirement of key-off cooling for 1% reduction in
seasonal capacity loss ... 155
Figure 7-11. Key-off cooling of battery enabled for the duration of Day Park (a)
temperature profile (b) summer capacity loss (c) daily energy requirement of
key-off cooling to achieve 1% reduction in capacity loss per season ... 156
Figure 7-12. Effect of pre-cooling the battery on thermal comfort. Figure shows
temperature of (a) cabin (b) vent air and (c) battery ... 157
Figure 7-13. Effect of pre-cooling the battery in Day Park on torque of engine in
Trip 2 ... 158
Figure 7-14. Effect of pre-cooling the battery on (a) discomfort index, (b) fuel
consumption over Trip 2 of the duty cycle (c) energy requirement per degree of
xiii Figure 8-1. Structure of the state grid used with the DP algorithm ... 165
Figure 8-2. Reachable and unreachable battery temperature states. The state values
are marked at steps of 4× Δ𝑡 for clarity. ... 166
Figure 8-3. The scope of the analyses (a) in Chapter 7, (b) in this chapter. The
vehicle state values shown are related to the duty cycle with US06 trips... 167
Figure 8-4. Optimum trajectory of (a) cooling flag, (b) battery temperature, and (c)
SoC ... 168
Figure 8-5. Effect of SoC on optimal control of key-off cooling (a) battery
temperature trajectory, (b) SoC trajectory ... 170
Figure 8-6. Battery temperature trajectory with optimal key-off cooling in
scenarios with limited available charge. (a)-(d) refer to scenarios 4 – 7 defined in
Table 8-3, respectively. ... 172
Figure 8-7. Effect of initial temperature on suitability of after-run cooling strategy.
(a) temperature trajectory, (b) SoC trajectory. Annotation- blue: scenario 8, red:
scenario 9 ... 175
Figure 9-1. The scope of the analyses in (a) Chapter 7, (b) Chapter 8, and (c) in
this chapter. The vehicle state values shown are related to the duty cycle with US06
trips. ... 181 Figure 9-2. Maps of the terminal cost terms on 𝑥𝑣(𝑡𝐷𝑝𝑟𝑘) (a) fuel consumption
in Trip 2, (b) capacity loss in Trip 2, (c) discomfort index (d) capacity loss in Night
Park. The maps displayed are related to 𝑇𝑐𝑎𝑏𝑖𝑛𝑡𝐷𝑝𝑟𝑘 = 60°𝐶. Fuel consumption
and capacity loss maps represent seasonal values. Note that the axes of (c) and (d)
are rotate 90 degrees for higher clarity. ... 184
Figure 9-3. Result of baseline scenario for duty cycle in Phoenix summer with
US06 trips ... 186
Figure 9-4. Solution of equation (9-6) with US06 trips and 𝜆 = {1, 0, 0}. (a) daily
battery temperature, (b) daily SoC, (c) engine torque in Trip 2, and (d) cabin
temperature in Trip 2 ... 187
Figure 9-5. Solution of equation (9-6) with US06 trips and 𝜆 = {0,1, 0}. (a) daily
battery temperature, (b) daily SoC, (c) engine torque in Trip 2, and (d) cabin
xiv temperature in Trip 2 ... 190
Figure 9-7. Solution of equation (9-6) with US06 trips and λ={0,0,1}. (a) daily
battery temperature, (b) daily SoC, (c) engine torque in Trip 2, and (d) cabin
temperature in Trip 2 ... 191
Figure 9-8. Solution of equation (9-6) with US06 trips and λ={0,0.5,0.5}. (a) daily
battery temperature, (b) daily SoC, (c) engine torque in Trip 2, and (d) cabin
temperature in Trip 2 ... 193 Figure 9-9. Objective planes of equation (9-6) with US06 trips and (a) 𝜆3 = 0 and
(b) 𝜆1 = 0. The dotted lines indicate the achievable boundary of the objective
planes. The dahsed lines approximate the pareto front. The red square marks the
solution achieved with 𝜆 = {0.33, 0.33,0.33}. ... 195
Figure 9-10. Result of optimising key-off cooling of the battery for
λ={0.33,0.0.33,0.0.33}. (a) daily battery temperature, (b) daily SoC, (c) engine
torque in Trip 2, and (d) cabin temperature in Trip 2 ... 196
Figure 9-11. PHEV simulation results assuming baseline control strategies and
operation in Phoenix summer with two daily trips on the NEDCx2... 200 Figure 9-12 Objective planes of (9-6) NEDCx2 trips and (a) 𝜆3 = 0, (b) 𝜆2 = 0, and (c) 𝜆3 = 0. Annotations: the dotted lines indicate the achievable boundary of
the objective space. The red square marks the solution of (9-6) achieved with 𝜆 =
{0.005, 0.8,0.195}. ... 203
Figure 9-13. Solution of equation (9-6) with NEDCx2 trips and λ= {0.2, 0.7, 0.1}.
(a) daily battery temperature, (b) daily SoC, (c) engine torque in Trip 2, and (d)
cabin temperature in Trip 2 ... 204
Figure 10-1. The scope of the analyses in (a) Chapter 7, (b) Chapter 8, (c) Chapter
9, and (d) this chapter. The vehicle state values shown are related to the duty cycle
with US06 trips. ... 215
Figure 10-2. Flow chart of the process used for solving equation (10-5) ... 217
Figure 10-3. Progress of the integrated partial charging and key-off cooling
optimisation- The figure is relate to 𝜆 = 0, 1, 0. (a) ζ𝑚𝑎𝑥 in iterations of the
xv Figure 10-4. Solution of equation (10-5) for the duty cycle with US06 trips and
λ={0,1,0}. (a) daily battery temperature, (b) daily SoC , (c) engine torque in Trip
2, and (d) cabin temperature in Trip 2... 222
Figure 10-5. Solution of equation (10-5) for the duty cycle with US06 trips and
λ={0.5,0.5,0}. (a) daily battery temperature, (b) daily SoC , (c) engine torque in
Trip 2, and (d) cabin temperature in Trip 2 ... 223
Figure 10-6. Solution of equation (10-5) for the duty cycle with US06 trips and
λ={0,0.5,0.5}. (a) daily battery temperature, (b) daily SoC , (c) engine torque in
Trip 2, and (d) cabin temperature in Trip 2 ... 224 Figure 10-7. Objective planes of equation (10-5) with US06 trips and (a) 𝜆3 = 0 and (b) 𝜆1 = 0 The dotted lines indicate the achievable boundary of the objective
planes. The dahsed lines approximate the pareto front. The red square marks the
solution achieved with 𝜆 = {0.2,0.5,0.3}. ... 227
Figure 10-8. Solution of equation (10-5) for the duty cycle with US06 and
λ={0.2,0.5,0.3}. (a) daily battery temperature, (b) daily SoC, (c) engine torque in
Trip 2, and (d) cabin temperature in Trip 2 ... 228 Figure 10-9. Objective planes of equation (10-5) with NEDCx2 trips and (a) 𝜆3 = 0 and (b) 𝜆1 = 0. Annotations- The dotted lines indicate the achievable boundary
of the objective planes. The dahsed lines approximate the pareto front. The red
square marks the solution achieved with 𝜆 = {0.005, 0.8,0.195}. ... 232
Figure 10-10. Solution of equation (10-5) for the duty cycle with US06 and
𝜆 = {0.005, 0.8,0.195}. (a) daily battery temperature, (b) daily SoC, (c) engine
xvi Table 2-2. Charger specifications [15,50,81,82] ... 15
Table 2-3. Battery pack level requirement for a mid-size cross-over PHEV [4] . 17
Table 2-4. Effect of storage conditons on the capacity loss of a number of Li-ion
cells. Annotations. 𝑇 : temperature , 𝜁 : SoC, H: High, L : low ... 24
Table 2-5. Effect of charge throughput and temperature on the capacity loss of a
number of Li-ion cells. Data is related to cycling at 1C with 80% DoD, unless
otherwise stated. ... 25
Table 3-1. Reference hot soak conditions ... 38
Table 3-2. Rating of US locations from hottest to coldest, based on the data in
[197,198] ... 38
Table 3-3 Summary of literature investigating the sensitivity of battery lifetime to
ambient conditions ... 50
Table 5-1. Specifications of Range Rover HEV (provided by the industry partner)
... 66
Table 5-2. Parameters used in controlling the powertrain operating modes (as
provided by the industry partner) ... 73
Table 5-3. Conditions of powertrin characterisation test ... 74
Table 5-4. The parameters used in the cabin model as provided by the industry
partner ... 81
Table 5-5. Climate chamber conditions for pulldown and hot soak ... 83
Table 5-6. Parameters of the battery thermal model (provided by the industry
partner) ... 89
Table 5-7. Geometry specifications of the evaporator (provided by the industry
partner) ... 94
Table 5-8. Conditions and measurements in one evaporator characterisation test
case ... 95
Table 5-9. Boundary conditions of the refrigeration cycle characterisation test 101
xvii Table 6-1. Comparing the specifications of the battery and powertrain subsystem
in Range Rover HEV (modelled in Chapter 5) and the future-model Range Rover
PHEV ... 114
Table 6-2. Parameters used in the PHEV powertrain control rules ... 114
Table 6-3. Assumtions of the PHEV battery ... 115
Table 6-4. Battery performance in Chevy Volt, BMW i8 and Range Rover PHEV
... 118
Table 6-5. Energy consumption metrics over different drive cycles ... 124
Table 6-6. Effect of drive cycle on the temperature and internal heat generation of
the battery ... 125
Table 7-1. Summary of duty cycle assumptions ... 132
Table 7-2. Comparion of battery and cabin temperatures for different locations
and seasons ... 136
Table 7-3. SoC change and fuel consumption over two US06 trips for different
locations and seasons. Values are related to one day operation under each condition
... 139
Table 7-4. Battery capacity loss and lifetime calculations in Phoenix (trips on the
US06) ... 141
Table 7-5. Battery capacity loss and lifetime calculations in Seattle (trips on the
US06) ... 141
Table 7-6. Thermal discomfort index across difffererent climate conditions .... 143
Table 7-7. Summary of simulation results over different drive cycles and across
various climates ... 148
Table 7-8. Battery lifetime for different PHEV duty cycles ... 149
Table 8-1. Effect of optimised key-off cooling on the battery (in Day Park) .... 169
Table 8-2. Scenarios for investigating the effect of SoC on optimal key-off cooling
... 169
Table 8-3. Scenarios for investigating the effect of charge limitation on key-off
cooling strategy ... 171
Table 8-4. Effect of optimised key-off cooling on the battery in scenarios with
xviii Table 9-1. Scenarios for optimisation of key-off cooling ... 185
Table 9-2. Summary of results for different solutions of equation (9-6) for the duty
cycle with US06 trip... 199
Table 9-3. Summary of results for different solutions of equation (9-6) for the duty
cycle with NEDCx2 trips ... 206
Table 9-4. Effect of trip drive cycle on the effectiveness of key-off battery cooling
for improving battery lifetime ... 208
Table 9-5. Comparison of battery temperature and SoC in Day Park for scenarios
9-II with different drive cycle assumptions ... 208
Table 9-6. Effect of trip drive cycle on the effectiveness of battery pre-cooling for
improving thermal comfort ... 209
Table 10-1. Scenarios for integration of partial charging and key-off cooling .. 218
Table 10-2. Summary of results for different solutions of equation (10-5) for the
duty cycle with US06 trips ... 230
Table 10-3. Summary of results for different solutions of equation (10-5) for the
xix
𝐹𝐴 aerodynamic resistance (vehicle) 𝑁
𝐹𝑅𝑅 rolling resistance (tyres) 𝑁
𝑀 vehicle mass 𝑘𝑔
v vehicle speed 𝑚
𝑠
𝐶𝐷 vehicle drag coefficient 𝐶𝐷
𝐴 vehicle frontal area 𝑚2
𝜌 density (air) 𝑘𝑔
𝑚3
𝜏𝑤 wheel torque Nm
𝜏𝑒𝑚 electric machine torque Nm
𝜏𝑒𝑚,𝑚𝑎𝑥 maximum electric machine torque (motoring) Nm
𝜏𝑒𝑛𝑔 engine torque Nm
𝜏𝑒𝑛𝑔,𝑚𝑎𝑥 maximum engine torque (wide-open throttle) Nm
𝜏𝑙𝑜𝑠𝑠 torque loss (gears) Nm
𝜏𝑑 torque demand at gearbox input Nm
𝜔𝑤 wheel speed 𝑟𝑎𝑑
𝑠
𝜔𝑒𝑚 electric machine speed 𝑟𝑝𝑚
𝜔𝑒𝑛𝑔 engine speed 𝑟𝑝𝑚
𝐼𝑤 wheel assembly rotational inertia 𝑘𝑔. 𝑚2
𝐽𝑔 gear inertia 𝑘𝑔. 𝑚2
𝐽𝑒𝑚 electric machine inertia 𝑘𝑔. 𝑚2
xx
Notation Description Unit
𝑃𝑒𝑚,𝑚𝑒𝑐ℎ electric machine mechanical power 𝑊
𝑃𝑒𝑚 electric machine electric power 𝑊
𝑃𝑐𝑜𝑚𝑝,𝑚𝑒𝑐ℎ AC compressor mechanical power 𝑊
𝑃𝑐𝑜𝑚𝑝 AC compressor electrical power 𝑊
𝑉 battery voltage (cell) V
𝑉𝑏𝑎𝑡𝑡 battery voltage (pack) V
𝑉𝑜𝑐 open-circuit voltage (cell) V
𝑖 battery current (cell) 𝐴
𝑖𝑏𝑎𝑡𝑡 battery current (pack) 𝐴
𝑅0 battery internal resistance (cell) 𝛺
𝑃𝑐𝑒𝑙𝑙 battery power (cell) 𝑊
𝑃𝑏𝑎𝑡𝑡 battery power (pack) 𝑊
𝑇𝑐𝑎𝑏𝑖𝑛 average cabin air temperature °C
𝑇𝑐𝑎𝑏𝑖𝑛,𝑚𝑎𝑥 maximum cabin temperature °C
𝑇𝑣𝑒𝑛𝑡 cabin vent temperature °C
𝑇𝑏𝑎𝑡𝑡 battery temperature (bulk) °C
𝑇̅𝑏𝑎𝑡𝑡 average battery temperature °C
𝑇𝑏𝑎𝑡𝑡,𝑚𝑎𝑥 maximum battery temperature °C
𝑄̇𝑎𝑚𝑏 heat transfer between battery and ambient 𝑊
𝑄̇𝑐𝑙𝑛𝑡 heat transfer between battery and coolant 𝑊
𝑄̇𝑐𝑎𝑏𝑖𝑛 heat transfer between battery and cabin 𝑊
𝑄̇𝑔𝑒𝑛 internal heat generation of battery (pack) 𝑊
𝒞𝑏𝑎𝑡𝑡 battery heat capacity
𝑘𝐽 𝐾
𝒸𝑐𝑜𝑜𝑙𝑎𝑛𝑡 coolant specific heat capacity
𝑘𝐽 𝑘𝑔𝐾
𝑅𝑎𝑚𝑏 thermal resistance between battery and ambient 𝑊𝐾
𝑅𝑐𝑜𝑜𝑙𝑎𝑛𝑡 thermal resistance between battery and coolant
𝐾 𝑊
𝑅𝑐𝑎𝑏𝑖𝑛,𝑖𝑛𝑡 thermal resistance between battery and cabin interior
xxi
Notation Description Unit
𝑅𝑐𝑎𝑏𝑖𝑛,𝑤𝑎𝑙𝑙 thermal resistance between battery and cabin wall
𝐾 𝑊
ℎ̅𝑎𝑤 average heat transfer coefficient air side of evaporator/condenser 𝑚𝑊2𝐾
ℎ̅𝑤𝑟
average heat transfer coefficient refrigerant side of evaporator/condenser
𝑊 𝑚2𝐾
𝐴𝑎𝑤 heat transfer area on air side of evaporator/condenser 𝑚2
𝐴𝑟𝑤 heat transfer area on refrigerant side of heat evaporator/condenser 𝑚2
𝑄̇𝑤𝑎 heat transfer on air side of heat evaporator/condenser 𝑊
𝑄̇𝑤𝑟 heat transfer on air side of heat evaporator/condenser 𝑊
𝑁𝑢 Nusselt number –
𝑅𝑒 Reynolds number –
𝑃𝑟 Prandtl number –
𝑆𝐻 refrigerant superheat K
𝑆𝐶 refrigerant subcool K
𝑚̇𝑟𝑒𝑓 refrigerant flow rate 𝑘𝑔𝑠
𝑝𝑟𝑒𝑓 refrigerant pressure Pa
𝑇𝑟𝑒𝑓 refrigerant temperature K
hr. relative humidity (air) %
𝜂𝑣𝑜𝑙 AC compressor volumetric efficiency –
𝜂𝑖𝑠𝑒𝑛 AC compressor isentropic efficiency –
𝝎𝒄𝒐𝒎𝒑 AC compressor speed or 𝑟𝑝𝑚𝐻𝑧
ζ state of charge (Sock) %
𝜁𝑚𝑎𝑥 maximum Sock (level of battery charge) %
𝜁𝑚𝑎𝑥∗ optimum maximum Sock (optimum level of charge) %
ζ̅ average of SoC %
n number of charge-discharge cycles of battery –
Δ𝐶𝑠𝑡𝑜𝑟 storage capacity loss %
Δ𝐶𝑐𝑦𝑐 cycling capacity loss %
∆𝐶 total capacity loss %
𝑣𝑓𝑢𝑒𝑙 fuel consumption (fuel consumed) L
𝐼𝑑𝑖𝑠𝑐𝑜𝑚𝑓 discomfort index –
xxii
Notation Description Unit
𝐷𝑝𝑟𝑘 Day Park (phase of the duty cycle) –
𝑇𝑟𝑝2 Trip 2 (phase of the duty cycle) –
𝑁𝑝𝑟𝑘 Night Park (phase of the duty cycle) –
[Δ𝐶]𝑇𝑟𝑝1 total capacity loss in Trip 1 %
[Δ𝐶]𝐷𝑝𝑟𝑘 total capacity loss in Day Park %
[Δ𝐶]𝑇𝑟𝑝2 total capacity loss in Trip 2 %
[Δ𝐶]𝑁𝑝𝑟𝑘 total capacity loss in Night Park %
[𝑣𝑓𝑢𝑒𝑙]𝑇𝑟𝑝1 consumed fuel in Trip 1 L
[𝑣𝑓𝑢𝑒𝑙]𝑇𝑟𝑝2 consumed fuel in Trip 2 L
𝑡𝑇𝑟𝑝1 time at end of Trip 1 s
𝑡𝐷𝑝𝑟𝑘 time at end of Day Park s
𝑡𝑇𝑟𝑝2 time at end of Trip 2 s
𝑡𝑁𝑝𝑟𝑘 time at end of Night Park s
𝜏𝑒𝑛𝑔 engine torque Nm
𝑥𝑏 state (vector) of the battery: [𝑇𝑏𝑎𝑡𝑡, 𝜁]′ –
𝑥𝑣 state (vector) of the vehicle: [𝑇𝑐𝑎𝑏𝑖𝑛, 𝑇𝑏𝑎𝑡𝑡, 𝜁]′ –
𝑢 key-off cooling flag trajectory –
𝑢∗ optimum trajectory of key-off cooling flag –
J total cost minimized in optimal control problems –
h terminal cost (used in the definition of cost functions) –
xxiii
BEV battery electric vehicle
PHEV plug-in hybrid electric vehicle
PPHEV parallel plug-in hybrid electric vehicle
AER all-electric drive range
AC air conditioning (system)
SoC state of charge
DoD depth of discharge
CD charge depleting (mode of powertrain operation)
CS charge sustaining (mode of powertrain operation)
Enol end of life (of the battery)
DP Dynamic Programming method
xxiv when there was seemingly no hope. Andrew spent numerous hours on reviewing
and proofreading this thesis and my papers. I am thankful to them both.
I am grateful to Professor Paul Jennings who gave me the opportunity to work
within his group, persuaded me to register for this degree, and supported me when
writing this thesis affected my work.
This research benefited from the support and the sound technical knowledge of Dr
Simon Robinson of Jaguar Land Rover. Simon also facilitated my access to the
data that enabled this research.
My journey as a PhD student started in 2011 at Aston University, with the support
of Dr Dani Strickland. Although I moved to Warwick soon afterwards, Dani had
an important role in shaping my thought process, and I am grateful to her.
I struggle to even begin to thank my parents. When you read this, know that I am
sorry for not being with you as much as I liked to in the last five years. That
xxv Management Optimisation, in: SAE Tech. Pap., 2015. doi:10.4271/2015-01-0331.
S. Shojaei, S. Robinson, A. McGordon, J. Marco, Passengers vs. Battery: Calculation of Cooling Requirements in a PHEV, in: SAE Tech. Pap., 2016. doi:10.4271/2016-01-0241.
S. Shojaei, A. McGordon, S. Robinson, J. Marco, P. Jennings, Developing A Model for Analysis of the Cooling Loads of a Hybrid Electric Vehicle by Using Co-Simulation of Verified Submodels, Proc. Inst. Mech. Eng. Part D J. Automob. Eng. (2017) 954407017707099. doi:10.1177/0954407017707099.
xxvi degree. The thesis is presented in accordance with the regulations of Warwick
University.
Sina Shojaei
xxvii To my parents, Nasrin and Behrouz, for their endless love;
To my sister, Saman, for her kindness and all the laughter we share;
1
Motivation
With mounting evidence that global warming is posing a fundamental threat to
humankind and other species in the near future, stringent reductions in greenhouse
gas emissions is indispensable. CO2, which is the most abundant long-lived
greenhouse gas, is a combustion product of fossil fuels [1]. Therefore, to reverse
global warming, the dependency of different industries and human activities on
fossil fuels should be reduced [2]. Finding economically viable and
environmentally friendly alternatives for fossil fuels has been a research priority
for over three decades [3].
The transportation sector is responsible for over 14% of the global greenhouse gas
(GHG) emissions, a share that is projected to increase to 50% by 2030 [4]. In 2016,
the transportation sector was responsible for over 25% of the total GHG emissions
in the European Union (EU) countries, over 70% of which was due to road
transport [5]. Electrification of road vehicles, combined with de-carbonization of
power plants, is most likely the only way for eliminating the environmental impact
of road transport [6]. As a result, battery electric vehicles (BEVs) have attracted
significant attention over the last decade. Currently, the transition from
conventional vehicles (CVs) to BEVs is slowed by the immaturity of the battery
technology, which has significant shortcomings in delivering the following three
essential requirements [7,8]:
1. sufficient energy density in light, and inexpensive packs;
2. fast charge time, comparable to the refueling of CVs;
3. sufficient lifetime under real-life usage conditions.
Research has shown that the above shortcomings lead to range anxiety which is
2 battery technologies are a major research priority in road transport. As the battery
technology continues its development, plug-in hybrid electric vehicles (PHEVs)
which combine the characteristics of BEVs and CVs are deemed as a step in the
right direction towards cleaner and greener transportation [11]. BEVs and PHEVs,
are referred to as plug-in electric vehicles or PEVs, in that plugging these vehicles
to the grid is the main mechanism of charging their battery, distinguishing them
from other types of electrified vehicles (xEVs).
Stringent legislation has had a significant role in encouraging the automotive
manufacturers to invest in the development of PEVs. The EU standards require the
fleet average emissions of 95 grams of CO2 per kilometre for all new cars by 2021
[12]. Similar targets are currently in place in the US under the corporate average
fuel economy (CAFE) standard [13]. As a result, while only 14 PEV models were
available from 8 major automotive manufacturers in 2013, 59 PEV models were
available in 2017, as all major automotive manufacturers offer PEVs as part of
their model range [14]. Electrification is already showing tangible benefits; it has
been estimated that in 2012, light duty PEVs in the US saved over 6 million gallons
of fuel [15]. The global sales of PEVs are rapidly growing, having increased by
80% in 2015 compared to 2014 [16,17]. In the US, the annual sales of PEVs are
expected to exceed 1.2 million vehicles by 2025, reaching more than 7 per cent of
the annual vehicle sales in that country [10], while in the UK, all new cars are
required to have EV operating mode by 2040 [18].
Ageing of battery cells, defined as the irreversible reduction of their energy storage
capacity and power [20,21], is a major challenge for electrification of road vehicles
[22]. Lithium-ion cells, which are believed to be the most promising choice for
automotive applications [23,24] have ageing mechanisms that are sensitive to real
world usage conditions [25]. Cycling ageing (ageing due to the conditions of
charge-discharge cycles) accelerates at high temperature, as well as with high
depth of discharge, and high charge-discharge rates [26,27]. Storage ageing
3 to high battery temperature [31] that can reach as high as 65°C [32]. It is generally
agreed that some form of battery cooling system is necessary for modern BEVs
and PHEVs [33]. Battery cooling is traditionally a ‘key-on’ function, that is, it is
only applied when the vehicle is switched on [34]. However, in hot geographical
locations, the heat gain from the ambient environment can heat the battery to
extreme temperatures [35,36]; a phenomenon that cannot be prevented with
key-on cooling key-only. Since passenger vehicles are typically parked for most of their
lifetime, markedly short battery lifetime has been observed in hot geographical
locations [32,35].
The observation of short battery lifetime in hot geographical locations indicates
the need for extending battery cooling beyond a key-on function by enabling
battery cooling even when the vehicle is parked. When the vehicle is plugged in,
the ‘free’ energy of the charger can be used to cool the battery, a strategy that is
often referred to as ‘plugged-in cooling’ or ‘stand-by cooling’ [32,35,37–41].
Alternatively, the energy of the battery can be used for cooling in the more
common scenario that the parked vehicle is not plugged in (‘key-off cooling’).
However, two critical concerns have discouraged the consideration of key-off
cooling in the past. First, using the energy of the battery for cooling reduces the
all-electric range (AER) of the vehicle. Second, discharging the battery for
key-off cooling increases cycling ageing and can adversely affect the battery lifetime.
Therefore, further research is necessary to exploit the potential benefits of key-off
cooling while avoiding the above concerns.
Reducing the average SoC of the battery through optimized partial charging is
another method that has been used to improve the battery lifetime [42–45]. The
method typically involves using a priori knowledge of the energy requirement of
the vehicle and charging the battery only as much as the vehicle will consume until
it is plugged-in next time, eliminating the excess charge. Partial charging has been
4 should be charged enough to support an extended operation, which leaves a limited
excess battery charge. The previous studies in this area ignored the benefit of lower
SoC relative to lower temperature, and considered controlling the level of charge
independent of controlling cooling, even when plugged-in cooling was available.
When key-off cooling is to be enabled, understanding the benefit of maintaining a
low SoC through partial charging relative to the benefits of key-off cooling
(maintaining a low temperature) becomes critical due to two considerations. First,
partial charging affects the battery charge that can be allocated to key-off cooling.
Second, in the presence of uncertainty in the timing of trips, key-off cooling
generally poses a lower risk to the vehicle range compared to partial charging. This
is because an early trip start will reduce the need for key-off cooling but closes the
window of opportunity for sufficiently charging the battery for the following trip.
Further research in this area is required to better establish the relative benefit of
key-off cooling and partial charging.
Contribution to knowledge
This research, for the first time, studies the application of key-off cooling as well
as its integration with partial charging. Specifically, the following research
question is investigated:
‘How can the ultimate benefits of key-off cooling and partial charging be evaluated
for a PEV operating in hot climate conditions?’
The research offers the following key contributions to knowledge:
1. Developing a methodology for establishing the ultimate benefits of key-off battery cooling;
2. Considering the implications of battery cooling strategy for passenger thermal comfort
5 5. Developing a methodology for optimising the combination of level of charge and key-off cooling that benefits the fuel economy and passenger thermal comfort while maximising the battery lifetime
6. Elevating battery thermal management (battery cooling) to a supervisory-level function
This research was carried out as part of the energy efficiency workstream of the
High Value Manufacturing (HVM) Catapult project (2012- 2017) in partnership
with Jaguar Land Rover. The scope and the methodology of the research were
defined in alignment with HVM Catapult objectives as well as the strategic
priorities of the industry partner.
Organisation of the thesis
The thesis is organised as follows:
Chapter 2 provides the necessary background information for the remainder of this
thesis, including an overview of the design and the energy management
requirements in PHEVs, a brief introduction to traction battery technologies, as
well as a short review on the design of automotive air conditioning systems.
Chapter 3 reviews the previous research on the impact of hot climate conditions
on PEVs, and possible methods for mitigating this impact. This review highlights
the gap in the current knowledge of key-off cooling and partial charging of PEV
batteries, raising the research question that is addressed in this thesis.
Chapter 4 presents the methodology chosen to investigate the research question,
including the key assumptions about the vehicle in addition to explaining the
6 purpose of this research.
Chapter 6 explains the process of developing a vehicle model from a set of high
level assumptions and the subsystems models developed in Chapter 5. The vehicle
model is simulated over a set of standard drive cycles and its basic operation
metrics are discussed.
Chapter 7 discusses the result of simulating the vehicle model over a set of
24-hour duty cycles that include mild and hot climate conditions. The variability of
some key performance attributes of the vehicle with ambient conditions is
determined from the simulation results. Analysing the simulation results indicates
the potential benefits of key-off (battery)cooling and partial charging.
Chapter 8 focuses on defining key-off cooling as an optimal control problem and
describing the selected solution approach. The chapter also provides some initial
analysis of the factors affecting the solution of this control problem.
Chapter 9 expands the key-off cooling control problem defined in chapter 8 by
proposing a methodology for solving the problem in view of the 24-hour vehicle
duty cycle. The solution of this problem is discussed for different duty cycles
considering different scenarios to evaluate the implications of key-off cooling for
different performance attributes of the vehicle.
Chapter 10 proposes a methodology for integrated optimisation of partial charging
and key-off cooling. The benefits of this methodology are discussed for two
vehicle duty cycles, while various scenarios are considered to analyse possible
implications for different performance attributes of the vehicle.
Chapter 11 discusses the generality of the proposed methodology including its
applicability to alternative assumptions about the vehicle type and usage scenarios.
7
Introduction
This chapter provides the necessary background information for this research. In
Section 2.1, the high-level considerations related to the design and operation of
PHEVs are reviewed. In Section 2.2 the design requirements of the battery of
PHEVs and other types of electrified vehicles are reviewed. In addition, the
operational principles of the Lithium-ion battery technology including the
mechanisms of ageing in these batteries and their cooling requirements are
discussed. In Section 2.3, the key aspects of the design and operation of typical
automotive air conditioning systems are explained.
Design considerations in PHEVs
Electrified vehicles or xEVs are the class of vehicles in which some part of the
traction torque is delivered by an electric machine in conversion of electrical
energy from an on-board source to mechanical energy [46,47]. xEVs therefore
differ from CVs in which the entirety of the traction torque is the product of
combustion of fuel in an engine [48,49]. The source of the electrical energy in
xEVs is typically a battery, although capacitors and super-capacitors can be also
used [50].
In addition to having one or more electric machines, xEVs can have a full-size
engine, or the engine can be downsized or removed1, depending on the emphasis
on electric traction, also referred to as the degree of electrification [51].
Accordingly, four types of xEVs can be identified2 [47,52]
1 A hydrogen fuel cell can be potentially used instead of the engine, forming a fuel cell electric
vehicle (FCEV), or it can be used alongside a battery to form a fuel cell hybrid electric vehicle FCHEV [49]. However, the fuel cell technology is currently under-developed [8].
2 CVs with start-stop technology are occasionally referred to as micro-hybrids and included in this
8
hybrid electric vehicles (HEVs),
plug-in hybrid electric vehicles (PHEVs),
battery electric vehicles (BEVs)
In MHEVs and HEVs1, the battery charge is mainly replenished from the power
of the engine (engine charging) [50,53], while plugging the vehicle to the grid is
the main charging mechanism in PHEVs and BEVs [54], although PHEVs also
benefit from engine charging [53]. The plug-in feature enables application of
larger batteries and more powerful electric machines in PHEVs, making the battery
the primary energy source [55]. From this point of view, PHEVs and BEVs are
similar, and are collectively referred to as plug-in electric vehicles (PEVs).
While BEVs are seen as the long-term focus of the automotive industry, most
technology road maps and policy trends indicate that PHEVs will dominate the
xEV market for at least the next decade [56–58]. PHEVs typically have one or
more electric machines and an engine, each of which can operate independently.
From this point of view, PHEVs are similar to HEVs. Based on the existence of a
mechanical link between the wheels and the engine or the electric machine, the
powertrain architecture in PHEVs (and HEVs) can be categorised as series,
parallel, combined series-parallel, and through-the-road [47,59]. Figure 2-1 shows
the parallel architecture.
1 The main difference between MHEVs and HEVs is that the electic machine of MHEVs cannot
9 The main feature of parallel architecture is that both the engine and the electric
machine can provide traction torque to the wheels. Some form of coupling, such
as a friction clutch, creates a mechanical connection from the driveline to the
engine and the electric machine. This architecture can deliver the following 5
operating modes [52,60,61]:
1. Electric drive mode (EV mode): the vehicle is driven by the electric machine,
while the engine is off and de-coupled from the driveline1. This mode is often
referred to as “zero-emission” drive
2. Motor assist mode: (hybrid mode): The engine acts as the primary source of
traction torque while it is assisted by the electric machine to meet high torque
demands
3. Engine charge mode: Electricity is generated from the power of the engine to
charge the battery. If the engine can provide traction torque, it drives the
vehicle.
4. Conventional drive mode: the vehicle is driven by the engine, like a
conventional vehicle, and the electric machine is not used.
1 ‘Driveline’ refers to the shafts and gearings that transfer torque from the propeller (engine or
10 vehicle, subsequently regenerating the kinetic energy of the vehicle in form of
electricity which will be stored in the battery. Therefore, electric braking is
often referred to as ‘regenerative braking’. Electric braking is often blended
with mechanical (friction) braking, thus the term ‘hybrid braking’ mode is also
common.
2.1.1Energy management in PHEVs
The common strategy for controlling the powertrain of PHEVs is the
charge-depleting-charge-sustaining (CD-CS) strategy [62–64]. In this strategy, the vehicle
is initially propelled by the electric machine, depleting a considerable part of the
battery charge. This is referred to as the charge depleting (CD) mode. Once the
battery SoC drops below a certain threshold, the vehicle switches to the charge
sustaining (CS) mode, in which both the engine and the electric machine are used
to propel the vehicle, maintaining a near-constant SoC. Figure 2-2 shows the
idealised SoC profile in the CD-CS strategy. The SoC window of the CD mode is
determined based on the durability of the battery, and the trade-off between fuel
economy, weight, cost, and lifetime [65,66]. The advantage of the CD-CS strategy
is that it is simple to realise in real-time, however, it does not lead to maximum
fuel economy [62,67]. The ideal alternative to this strategy is to blend the use of
the engine and the electric machine throughout the travelled distance so that each
one can be used at their respective highest efficiency points. However, this is not
11 It is important to note that the CD and CS energy management modes encompass
the operating modes of the powertrain described previously. For example, in a
plug-in parallel hybrid electric vehicle (PPHEV), electric drive, regenerative
braking, and mechanical braking will all likely occur during the CD mode. In
addition, if the power demand of the drive cycle exceeds the power (torque)
capability of the electric machine while the vehicle is in CD mode, the engine will
start (motor assist). However, once such periods of high power demand have
passed, the CD mode will resume, assuming the battery SoC is still in the CD
window [62]. Figure 2-3 illustrates how different powertrain and energy
management modes overlap.
[image:42.595.137.485.513.719.2]12 while demonstrating similar attributes of maximum acceleration and speed both in
the CS and the CS operating modes [55,70]. This means that PHEVs need
relatively large batteries and powerful electric machines that allow extended CD
operation [66]. It also means that a PPHEV will require a full size engine that can
propel the vehicle normally as it charges the battery during the CS operation [71].
This can be inferred from Table 2-1 which compares the specifications of the
battery pack and the engine of some commercially available xEVs.
Table 2-1 Battery and engine speecifications in some commercially available xEVs based on publically available informtaion from model year 2016
Type Make and Model
Battery Specifications
Engine Power Energy
[kWh]
Voltage [V]
Power [kW]
MHEV Infiniti QX60 0.6 144 15 2.5 L 170 𝑘𝑊
HEV
BWM Series 5 1.4 317 40 3.0 L 253 𝑘𝑊
Range Rover 1.6 270 35 3.0 L 192 𝑘𝑊
PHEV
Chevrolet Volt 16.7 370 110 1.5 L 62 𝑘𝑊
Mercedes s-500 8.8 400 85 3.0 L 244 𝑘𝑊
BEV
Nissan Leaf 24 360 80 n/a*
Chevrolet Bolt 60 350 160 n/a*
Tesla Model S 85 355 310 n/a*
* not applicable
Another implication of the above requirement is that subsystems, such as the air
conditioning (AC) subsystem, which are typically powered by the engine in CVs
and HEVs, should be electrified in PHEVs to minimise the operation of the engine
13
2.1.2Energy efficiency of PHEVs
The energy efficiency of a vehicle is defined as the amount of energy required to
drive the vehicle over a certain distance. It depends on factors such as the pattern
of driving, the ambient temperature, and the source of energy [73,74]. Regulatory
authorities such as the European Commission (EC) or the U.S. Environmental
Protection Agency (EPA) have issued standard procedures for measuring the
energy efficiency (and emissions) of different vehicles [75,76]. Typically, the
vehicle is placed in a test cell at controlled temperature. A chassis dynamometer
is then used to mimic driving over pre-defined speed profiles, known as drive
cycles.
In current EC test procedure, the measurements are based on driving the vehicle
over the New European Drive Cycle (NEDC) at 25°C [76]. The current EPA
procedure (the supplementary federal test procedure or SFTP) [77] includes five
drive cycles : the FTP-75, the HWFET, the US06, the SC03, and the UDDS. The
first three drive cycles are run at 75°F (24°C). The SC03 and the UDDS drive cycle
are used to measure the effect of operating the AC and heating systems on energy
efficiency, and are carried out at 95°F (35°C) and 20°F (-7°C), respectively.
Energy efficiency (and emissions) are measured in these five tests for city and
highway parts of the drive cycles. The measurements are weighted and reported
separately or as a combined number according to established EPA procedures
[77,78].
In CVs and non-plug-in xEVs that have fuel as their single source of energy, the
test process is straightforward. In these vehicles, energy efficiency is commonly
quoted as miles travelled per gallon of fuel (mpg), or as Litres of fuel required to
travel 100 kilometres [76]. The existence of two energy sources in a PHEV
necessitates the process outlined below:
The test is first carried out with a fully charged battery, so the vehicle operates
in CD mode during the test. The test continues until the end of the drive cycle,
14 for the assumed drive cycle (and ambient conditions). The distance travelled in
CD mode is the AER of the vehicle for the assumed drive cycle (and ambient
conditions) [79].
The test is then repeated with a fully discharged battery. The fuel consumption
of the vehicle is calculated in a similar manner to non-plug-in xEVs. This gives
the CS fuel efficiency (economy) of the vehicle.
In the EPA test procedure, the CD energy efficiency and CS fuel economy are
calculated for all drive cycles and quoted as an average value. Furthermore, to
enable comparison with other vehicle types, an overall fuel economy figure is
calculated by converting the electric energy consumption in CD mode to
equivalent fuel consumption and calculating the CD equivalent fuel economy [80].
15
2.1.3Charge patterns
Design standards of PEVs charging stations are still evolving. Currently, three
types of charging stations are identified based on the power that they draw from
the grid, as summarised in Table 2-2.
Table 2-2. Charger specifications [15,50,81,82]
Type Voltage [V] Current rating [A]
Level 1 120 12-15
Level 2 240 12-80
Level 3 400-450 50-220
A comprehensive study carried out by the Idaho National Laboratory in 2015 [83]
provides a clear insight into the charging patterns of plug-in xEVs. In this research,
2400 Nissan Leaf BEVs and 1800 Chevrolet Volt PHEVs were monitored as they
were used across the U.S. All vehicles were equipped with level 1 charger cables
while level 2 chargers were installed at home for all users. In addition, level 2 and
level 3 chargers were installed in a variety of locations, including workplaces,
stores, restaurants, gas stations, etc. to allow observation of charging patterns. The
following key observations were reported:
1. Most vehicles are charged at home. 84% of all Leaf charges and 87% of all Volt
charges were at home. Also, more than half of all vehicles were charged at home
in 95% of the time. Of all the vehicles, 13% were never charged away from
home, while 69% of them were charged away from home up to 30% of the time.
2. On average, the Leafs were charged 1.1 times per day. The Volts were charged
1.5 times per day, in line with their lower AER.
3. Most Leafs were plugged-in with significant charge left in the battery. The
Volts were almost fully discharged before being plugged-in, in line with the
16 4. On a working day, 57% of the Volts and 65% of the Leafs were charged once,
at home.
5. Level 1 charges were preferred. Among the vehicles charged away from home,
63% only used level 1 chargers, while 36% used level 1 or level 2 chargers.
Less than 1% of the vehicles used level 3 chargers.
Apart from the charger type, there are two strategies for charging a PEV,
‘opportunity charging’ and ‘timed charging’ [9,43,58]. In opportunity charging,
the vehicle is plugged in and charging is started whenever a charger is available.
In timed charging, the vehicle is plugged-in at a certain time, or electronic control
is used schedule charging. These strategies have different practical implications
for the vehicle and the users. With opportunity charging, the vehicle will be ready
to drive (in EV mode) more frequently [43]. On the other hand, timed charging
enables making use of low cost electricity in time-regulated systems and avoiding
higher load on the grid at peak demand hours [84]. More importantly, charging
can be scheduled to start just in time for the trips, so that the battery can remain at
a low SoC for an extended period of time. This is referred to as ‘just-in-time
charging’ and has been shown to enable significant improvements in the battery
lifetime compared to opportunity charging [85].
Battery technologies
In this section, the key aspects of the xEV battery technologies pertinent to the
scope of this research are reviewed, focusing on PHEVs. In Section 2.2.1, the
high-level battery design requirements and the importance of the Lithium-ion (Li-ion)
technology are discussed. In Section 2.2.2, the basic technical terms related to the
operation of typical batteries are defined. In Section 2.2.3, the ageing phenomenon
in Li-ion batteries is explained while Section 2.2.3 explains the cooling
17
2.2.1High-level design requirements
The most significant barrier to the commercialization of PEVs is the battery, due
to its high cost, low durability, large volume, slow charging rate, and the associated
safety concerns [86,87]. In 2008, a consortium led by the U.S. Department of
Energy established the requirements for commercialization of PHEVs and
identified a set of design targets for a PHEV battery for model-year 2016 [66].
These targets are listed in Table 2-3. Recent analyses show that battery
technologies have developed at a fast rate, leading to a rapid decrease in the unit
cost of PEVs batteries [58,88]. In other areas such as durability, the battery
technology currently underperforms [28,89]. The economic success of PEVs
against CVs necessitates more aggressive development of the technology [22],
especially considering the recent fall in the global oil price [90] and the continued
improvements in the ICE technologies [91,92].
Table 2-3. Battery pack level requirement for a mid-size cross-over PHEV [4]
Specification Target
Reference equivalent electric range 40 miles
Available Energy for CD mode 11.6 kWh *
Available Energy for CS mode 0.3 kWh
lifetime (at 35°C) 15 years
cycle life (one full cycle per day) 5,000 cycles
Production price (100,000 units/year) $ 3400
Maximum weight 120 kg
Technology readiness 2016
*sized for a vehicle with energy efficiency of 350Wh/mile
Common battery packs are built up of multiple battery modules which are units
formed of several battery cells that are electrically connected and packaged
together. Battery packs also encompass the battery management system (BMS)
and electronic harnesses [93]. When thermal management is considered, relevant
components such as heat sinks or cooling plates are also packaged in the battery
![Figure 2-2. Re-created from [63] : Typical PHEV energy management modes](https://thumb-us.123doks.com/thumbv2/123dok_us/9434080.450004/42.595.137.485.513.719/figure-created-typical-phev-energy-management-modes.webp)
![Figure 2-4 Schematics of a LiFePO4 battery cell [100]](https://thumb-us.123doks.com/thumbv2/123dok_us/9434080.450004/50.595.143.475.214.456/figure-schematics-lifepo-battery-cell.webp)