warwick.ac.uk/lib-publications
Manuscript version: Author’s Accepted Manuscript
The version presented in WRAP is the author’s accepted manuscript and may differ from the published version or Version of Record.
Persistent WRAP URL:
http://wrap.warwick.ac.uk/131579
How to cite:
Please refer to published version for the most recent bibliographic citation information. If a published version is known of, the repository item page linked to above, will contain details on accessing it.
Copyright and reuse:
The Warwick Research Archive Portal (WRAP) makes this work by researchers of the University of Warwick available open access under the following conditions.
Copyright © and all moral rights to the version of the paper presented here belong to the individual author(s) and/or other copyright owners. To the extent reasonable and
practicable the material made available in WRAP has been checked for eligibility before being made available.
Copies of full items can be used for personal research or study, educational, or not-for-profit purposes without prior permission or charge. Provided that the authors, title and full
bibliographic details are credited, a hyperlink and/or URL is given for the original metadata page and the content is not changed in any way.
Publisher’s statement:
Please refer to the repository item page, publisher’s statement section, for further information.
Terrorist Attacks, Analyst Sentiment,
and Earnings Forecasts
∗Carina Cuculiza, Constantinos Antoniou, Alok Kumar, and Anastasios Maligkris
October 29, 2019
Abstract – We examine whether exogenous and extremely negative events such as terrorist
attacks and mass shootings influence the sentiment and forecasts of sell-side equity analysts. We find that analysts who are local to these attacks issue forecasts that are relatively more pessimistic than the consensus forecast. This effect is stronger when the analyst is closer to the event and located in a low-crime region. Impacted analysts are also relatively more pessimistic around the one- and two-year anniversaries of the attacks. Collectively, these findings indicate that exposure to extreme negative events affects the behavior of information intermediaries and the information dissemination process in financial markets.
Keywords: Analyst sentiment, forecast accuracy, extreme events, terrorist attacks.
JEL classification: G14, G40.
∗Please address all correspondence to Carina Cuculiza, Department of Finance, Miami Herbert
1
Introduction
Earnings forecasts of sell-side analysts are a useful source of information for investors.1
How-ever, the analyst literature in finance and accounting suggests that investors should use this
information cautiously since analyst forecasts can be biased (e.g., Klein (1990); De Bondt and
Thaler (1990); Zhang (2006); Williams (2013); Dehaan et al. (2017)). In particular, analysts
may be systematically optimistic or subject to the attribution and overconfidence biases (e.g.,
Easterwood and Nutt (1999); Hilary and Menzly (2006); Bergman and Roychowdhury (2008);
Walther and Willis (2013)). Analysts’ biased forecasts could also reflect their career incentives
(e.g., Lim (2001); Hong and Kubik (2003); Ke and Yu (2006); Firth et al. (2013)).
In this paper, we extend this growing analyst bias literature and examine whether
expo-sure to extremely negative events that are exogenous and unrelated to financial markets shock
analysts’ “sentiment” and influence their earnings forecasts. Our study is motivated by the
psychology literature, which finds that people exposed to extreme negative events, such as
ter-rorist attacks and mass shootings (henceforth, “terter-rorist attacks” or “attacks”), become more
pessimistic in their risk assessments in unrelated domains (e.g., Lerner and Keltner (2001);
Lerner et al. (2003)). The impact of these events is stronger among individuals located closer
to the event.2
Motivated by these earlier findings, we posit that sell-side equity analysts located near
terrorist attacks will issue relatively more pessimistic earnings forecasts following these events,
compared with non-local analysts that issue forecasts for the same firm.3 Further, analysts for
who the extreme negative events are more salient will exhibit stronger reactions. And systematic
forecast shifts could have an impact on their forecast accuracy.
To test these hypotheses, we obtain the dates and locations of terrorist attacks and mass
shootings from the Global Terrorism Database (GTD) and Mother Jones’ Magazine mass
shoot-ing database for the 1994–2016 period. We estimate a series of regression models where the
dependent variable compares the one-quarter ahead earnings forecast of analystifor company
j at time tand the existing consensus forecast for the same firm at that particular time. Our
key independent variable is Exposure, a dummy variable that indicates whether analyst i is
affected by the attack. In particular, it is equal to one if the distance between the location of an
analyst and the location of the attack is less than 100 miles and if the forecast is issued during
1
See Kothari (2001); Ramnath et al. (2008); Zhang (2008); Chen et al. (2010); Grinblatt et al. (2016), among others.
2
See, for example, Vlahov et al. (2002); Galea et al. (2002); Hughes et al. (2011).
3Given the known optimism bias among analysts (e.g. Lin and McNichols (1998); Hong and Kubik (2003);
the 30-day period following the attack, and zero otherwise.4 Our key prediction is that the
coefficient estimate on Exposure will be positive and statistically significant, indicating that
analysts who are more exposed to these extreme and negative events are relatively more likely
to issue pessimistic forecasts compared to the consensus.
In our regression specifications, we include controls for several analyst and brokerage
charac-teristics, as well as various fixed effects. Specifically, we augment our models with analyst fixed
effects to exclude the possibility that our results are driven by analysts who are systematically
pessimistic. We include time (year-quarter) fixed effects to remove any time trends and firm
fixed effects to control for common information about firm earnings that could be available to
all analysts.
The empirical results are consistent with our hypotheses. We find that affected analysts are
8.70% more likely to issue forecasts that are below the consensus. We obtain similar results
when we estimate logit and probit models. These findings are consistent with our view that
proximity to a terrorist attack can negatively affect analysts’ sentiment, which in turn can
induce them to issue relatively more pessimistic forecasts.
Next, we examine whether events that are potentially more salient influence analyst
senti-ment more strongly. We use two proxies to measure event salience. First, we use the distance
between an analyst and the event. We conjecture that analysts who are located closer to an
event will be affected more strongly than analysts located farther away. Second, we utilize
state-level data on murder rates. This choice is motivated by the evidence in the psychology
lit-erature, which suggests that individuals exhibit a stronger emotional reaction to violence when
they have lower prior exposure to such stimuli (e.g., Anderson and Dill (2000)).5 Consistent
with these studies, we hypothesize that analysts located in states with lower murder rates will
issue relatively more pessimistic forecasts than analysts located in states with higher murder
rates.
Consistent with this conjecture, we find that analysts located within a 100-mile radius are
8.50% more likely to issue pessimistic forecasts than analysts who are more than 100-miles away.
Further, we find that treated analysts in low murder-rates states are 9.20% more likely to issue
pessimistic forecasts than treated analysts in high murder-rate states. These results suggest
that sentiment-related biases are stronger if the extreme event is more salient.
To gather additional support for our salience conjecture, we examine analyst forecasts around
event anniversaries. Various ceremonies are often held around the same date and location of
4
We use hand-collected data to measure the distance between the locations of the terrorist attacks and the locations of the brokerage houses where analysts are employed.
5To conduct this test, we use state-level data on murder rates obtained from the FBI’s Uniform Crime
terrorist attacks to commemorate the victims; thus, we examine whether affected analysts
become more pessimistic around the anniversaries of terrorist attacks. This hypothesis is based
on the observation that anniversary ceremonies can remind local individuals of the negative
sentiment they experienced following an attack. Remembering these negative and extreme
events could affect their current sentiment (Shahrabani et al., 2009).
In line with our hypothesis, we find that treated analysts are more pessimistic around the
one- and two-year anniversaries of terrorist attacks. Analyst pessimism diminishes over time
and becomes statistically insignificant after three years. These anniversary findings provide
additional support for our main conjecture and suggest that memories of terrorist attacks affect
analyst sentiment and make their forecasts relatively more pessimistic. These results also allow
us to rule out alternative explanations for our findings, as it is hard to imagine what other
economic events would occur exactly on the anniversary of terrorist events and influence analyst
behavior.
We also study if terrorist attacks can influence the forecast accuracy of affected analysts. It
is difficult to hypothesizeex-ante whether treated analysts would be more or less accurate after an event. On the one hand, the limited attention literature suggests that analysts near terrorist
attacks and mass shootings may be more distracted. Since attention is a scarce resource,
analysts could limit the amount of time they spend on their individual forecasts (Hirshleifer
and Teoh, 2003; Peng and Xiong, 2006; Hong and Stein, 2007; DellaVigna and Pollet, 2009),
resulting in more inaccurate forecasts (Dong and Heo, 2016). On the other hand, due to treated
analysts’ higher pessimism levels, they may issue forecasts that are systematically lower than the
consensus. Since prior studies suggest that relatively more pessimistic analysts (i.e., relatively
more conservative analysts) provide more efficient forecasts, treated analysts, on average, could
be more accurate (Hugon and Muslu, 2010; Jiang et al., 2016).
We find that treated analysts are more accurate than the average analyst. This effect is
also significant in economic terms. For instance, the coefficient on Exposureis larger than the
coefficient onAll Star, which suggests that the impact of extreme events on forecast accuracy
is at least as large as the improvement in accuracy that can be attributed to being an all-star
analyst.
In the next set of tests, we investigate if investors regard as probable that treated analysts
are more accurate. Since previous studies suggest that earnings forecasts are a potential useful
source of information for investors, we analyze whether there is a stronger price reaction to
treated analysts’ forecast revisions. We find that investors do not anticipate for treated analysts
These results are robust to an alternative dependent variable definition, several sub-sample
tests, and the inclusion of various fixed effects. Specifically, our conclusions are unchanged if
we (i) use a continuous dependent variable, (ii) exclude the 9/11 attacks from our sample (the
most significant events during our time period), (iii) exclude all analysts who reside in the state
of New York (about 50% of the analysts), (iv) restrict our sample to sunny and cloudy months,
and (v) perform sensitivity analysis in our 30-day post-attack window. We also perform a
placebo test, where we randomize the location of the terrorist attacks, and we do not find any
significant results.
In additional tests, we ensure our results are robust to several alternative explanations and
confirm that our findings reflect the impact of attack-induced analyst pessimism. First, we
examine whether pre-existing trends in analyst pessimism influence our findings. We find that
prior to the attacks, affected analysts do not differ in their forecasts. Second, we test whether
analyst pessimism is driven by the current economic conditions in their home state, which in a
few cases might also be impacted by terrorist attacks. We repeat our analysis using a state’s per
capita Gross State Product (GSP) and unemployment rate as control variables. Our findings
are robust to the inclusion of these variables.
Our next test analyzes whether treated analysts issue pessimistic forecasts because they have
superior information and have a better understanding of how terrorist events affect some firms,
as opposed to an adverse effect on their sentiment. We do so by recognizing that terrorist attacks
could have differential impact across industries. For example, earnings of airlines may be more
sensitive to attacks, relative to other sectors like agriculture. It is possible that affected analysts,
who directly observe the effect of these attacks, are better able to understand how these attacks
could influence some companies more than others and adjust their forecasts appropriately. If our
results are driven by analysts’ superior information rather than their attack-induced pessimism,
our findings should be concentrated among companies with operations that are more likely to
be affected by terrorist attacks. We do not find support for this alternative hypothesis. In fact,
treated analysts are more likely to issue pessimistic forecasts for firms in industries that are less
sensitive to terrorist attacks.
Further, a possible explanation as to why treated analysts are more accurate could be that
they issue more bold forecasts, regardless of the direction (upward or downward), which are
known to be more accurate (Clement and Tse, 2005). However, if their greater accuracy is
driven by attack-induced pessimism, they would be more likely to issue downward bold revision
forecasts but not upward bold revision forecasts. We find support for this latter hypothesis.
more likely to issue downward bold revision forecasts but not upward bold revision forecasts.
These findings contribute to several strands of sell-side analysts and terrorism related
lit-erature in finance, accounting, and economics. First, we extend the litlit-erature that analyzes
the economic implications of terrorist attacks. Previous studies examine both the micro- and
macro-economic implications of terrorist attacks.6 In particular, Dai et al. (2018) suggest that
CEOs employed by firms located near terrorist attacks receive a terrorist attack premium. Wang
and Young (2019a) find that following a terrorist attack, retail investors reduce their stock
mar-ket participation and trading activity. Even the aggregate risk aversion is inversely related to
terrorist activity, where flows to risky assets decrease as the number of terrorist attacks increase
(Wang and Young, 2019b). We extend this literature and show that terrorist attacks can affect
financial markets through its impact on sell-side equity analyst sentiment, and subsequently,
their forecasts.
Second, we complement the literature that examines whether analyst forecasts are affected
by market-driven sentiment (Hribar and McInnis, 2012) or behavioral biases, such as
represen-tativeness (De Bondt and Thaler, 1990), conservatism (Zhang, 2006), availability (Bourveau
and Law, 2016), overconfidence (Hilary and Menzly, 2006), depression (Dehaan et al., 2017),
and limited attention (Dong and Heo, 2016). Our economic setting allows us to identify the
impact of analyst mood on forecasting behavior more precisely. In particular, we are able to
compare forecasts issued by analysts located close to a terrorist attack with the forecasts of
analysts located farther away, for the same firm and at the same time.
In a related paper, Bourveau and Law (2016) demonstrate that analysts who just
experi-enced a life-threatening weather event, Hurricane Katrina, become more risk averse because
they associate tasks involving risk and uncertainty with their recent experience of the natural
disaster. Consequently, affected analysts are more pessimistic than other analysts who did not
experience the storm. Our work differs from this study in several ways. First, we identify an
alternative channel through which non-economic events can affect analyst forecasts.
Specifi-cally, we document a sentiment-based mechanism, whereas Bourveau and Law (2016) rely on
the availability heuristic. Our evidence suggests that analysts are still willing to take risks
since they are more likely to issue downward (i.e., pessimistic) bold forecasts (Sapienza, 2010).
Second, our empirical methodology provides a more robust setting to examine whether extreme
negative events can affect analysts sentiment, and subsequently, their behavior. Our sample
contains more than 90 events that span 22 years. Therefore, our results are immune to the
6
potential biases and noise associated with a single treatment event. In particular, we are able
to show that our findings are not driven by a specific time period or a particular set of treated
analysts.
Further, our economic setting allows us to separate the economic-based effects from
sentiment-based effects.7 Because the direct economic costs for most of the attacks in our sample are quite
small, such economic motives are less likely to be relevant.8 Additionally, we are able to
per-form cross-sectional tests and illustrate more precisely the subtle ways that sentiment-inducing
events influence analysts’ behavior. For example, we show that the effects are stronger for more
salient events or when analysts reside in low crime-rate states.
In another related study, Dehaan et al. (2017) study whether unpleasant weather, such as
clouds, wind, and rain, can affect how market participants respond to information. They focus
on sell-side equity analysts and analyze if local unpleasant weather can affect their response to
earnings announcements. Our results complement these findings by showing that analysts also
become pessimistic after terrorist attacks. The distinction between weather-induced pessimism
and attack-induced pessimism is important as the psychology literature suggests that
weather-related events and attack-weather-related events can have different effects on individuals’ mood (Peek
and Sutton, 2003). For example, the nature of terrorism is clandestine and criminal and the
goal of the perpetrator is to shock and terrify the masses (Juergensmeyer, 2017). Therefore,
they typically have both short- and long-term consequences on a person’s mental and physical
health (Peek and Sutton, 2003). In contrast, unpleasant weather is unlikely to generate lasting
psychological consequences (Howarth and Hoffman, 1984; Peek and Sutton, 2003; Denissen
et al., 2008).
Beyond the analyst literature, our paper complements studies that examine the effects of
significant “life events” on financial decisions. Recent work shows that traumatic early-life
experiences have permanent effects on the decisions of corporate managers and sell-side analysts
(Clement and Law, 2014; Bernile et al., 2017). In addition, extreme negative events experienced
later in life exert a short-term effect on the decisions of mutual fund investors and corporate
managers (Wang and Young, 2019b; Antoniou et al., 2017). We extend this literature by showing
that terrorist attacks and mass shootings have a short-term impact on analyst forecasts.
Lastly, we contribute to the literature that analyzes whether market participants can display
7
The direct economic cost of Hurricane Katrina was very large, especially for the residents of Louisiana; thus, it is possible that economic motives play a role in this setting. For example, Lim (2001) shows that, in equilibrium, analysts may issue optimistic forecasts to gain management access in the long term, accepting an immediate cost due to lower accuracy. If Louisiana-based analysts experienced a shock to their wealth due to hurricane Katrina and became more risk averse, then the immediate cost of optimism may increase, thus inducing these analysts to become less optimistic.
8The only events in our sample that are comparable to Hurricane Katrina in terms of economic costs are the
behavioral biases. For example, Goetzmann et al. (2014) show that weather-induced mood
influences the decisions of institutional investors. Shu et al. (2017) suggest that bereavement
due to parental loss influences the trades and profitability of mutual fund managers. We show
that exposure to extreme negative events influences the behavior of relatively-sophisticated
information intermediaries, and thus, affects the information dissemination process in financial
markets.
The rest of the paper is organized as follows. In Section 2, we develop our main testable
hypotheses. In Section 3, we describe the data sources and define the key variables. In Section
4, we discuss the main empirical findings and, in Section 5, we presents results from various
robustness tests. Section 6 examines potential alternative explanations for our findings and
Section 7 concludes with a brief summary.
2
Hypotheses Development
The affect heuristic (Slovic et al., 2007) suggests that salient events not only have negative effects
on people’s sentiment, but that they can also spillover and lead to pessimistic assessments of
risks in unrelated domains. For example, experimental evidence in psychology shows that,
individuals who read a sad newspaper article are subsequently more likely to assign a higher
probability to unrelated negative future events (Johnson and Tversky, 1983). Consistent with
these findings, recent studies show that terrorist attacks and mass shootings can influence the
general risk perceptions of individuals (Benzion et al., 2009), since they exert a strong negative
impact on their sentiment (e.g., Galea et al. (2002); Lerner et al. (2003); Fischhoff et al. (2005);
Hughes et al. (2011)). The impact of these extreme negative events on individual sentiment is
stronger when a person is closer to an event (e.g., Fischhoff et al. (2005); Benzion et al. (2009);
Shahrabani et al. (2009)).
Motivated by this evidence in the psychology literature, we conjecture that:
H1: Sell-side equity analysts located closer to a terrorist attack will issue more pessimistic earnings forecasts for a firm, compared to the prevailing consensus for the same firm at the same time.
It is important to mention that, ex-ante, it is not clear whether analysts should be affected by non-economic, extreme negative attacks, such as terrorist events. Sell-side analysts are a
relatively sophisticated group of market participants who should be well informed about firm
fundamentals and should be immune to sentiment effects (Hribar and McInnis, 2012).
Our second hypothesis focuses on event salience. Specifically, we investigate whether attacks
geographical distance between an analyst and the terrorist event. We conjecture that analysts
located closer to the event will be affected more strongly compared to analysts located farther
away.
The second proxy is the state-level murder rate. This choice is based on the evidence in the
psychology literature, which finds that people exhibit stronger emotional reactions to violence
when they have limited prior exposure to such stimuli (e.g., Anderson and Dill (2000); Krah´e
et al. (2011)). In line with these findings, we hypothesize that analysts who are located in states
with lower murder rates will react more strongly to the attacks and will issue relatively more
pessimistic forecasts than affected analysts who are located in states with higher murder rates.
These insights motivate our second conjecture:
H2: Affected analysts will issue more pessimistic earnings forecasts when they are located closer to extreme events, especially if they are located in regions with lower murder rates.
In our next hypothesis, we refine the salience conjecture further. This insight is based
on the observations that anniversary ceremonies are often held around the same date and
location of terrorist attacks to commemorate the victims.9 These ceremonies are likely to
remind local individuals of the extreme negative emotions they experienced due to the attacks,
and consequently, may exert a negative influence on their sentiment (e.g., Shahrabani et al.
(2009)).10 In a similar manner, local analysts may experience a negative shock to their sentiment
around the anniversaries of terrorist attacks and become pessimistic. Specifically, we conjecture
that:
H3: Treated analysts will issue more pessimistic earnings forecasts around the anniversaries of terrorist attacks.
In our fourth hypothesis, we examine whether terrorist attacks affect the forecast accuracy
of treated analysts. It is difficult to positex-ante whether treated analysts would become more or less accurate after a terrorist attack. It is possible that analysts near terrorist attacks and
mass shootings become more distracted. Since attention is a scarce resource, they could allocate
less time to analyzing firm information when issuing their forecasts. As a result, the forecasts
of affected analysts may deviate significantly from the consensus, potentially leading to less
accurate forecasts (Hirshleifer and Teoh, 2003; Peng and Xiong, 2006; Hong and Stein, 2007;
DellaVigna and Pollet, 2009; Dong and Heo, 2016).
Alternatively, if a terrorist attack affects an analyst’s mood by increasing her pessimism,
9See, for example, http://edition.cnn.com/2002/US/09/11/ar911.memorial.newyork/,
http://edition.cnn.com/2010/US/11/05/texas.fort.hood.anniversary/,
http://www.usatoday.com/story/news/nation/2013/12/14/newtown-sandy-hook-shooting-anniversary/4022649/, http://edition.cnn.com/2014/04/15/us/boston-marathon-bombing-anniversary/. 10
then she would issue forecasts that are systematically below the consensus. On average, this
systematic downward bias could lead to more accurate forecasts (Hugon and Muslu, 2010; Jiang
et al., 2016).11 To examine these possibilities, our fourth hypothesis posits that:
H4: Pessimism induced by terrorist attacks influence the forecast accuracy of treated ana-lysts, but the direction of this impact cannot be predicted ex-ante.
3
Data and Methods
In this section, we describe our datasets and empirical methodology. We use several data sources,
including the Global Terrorism Database, Mother Jones, Thomson Reuters’ Institutional
Bro-kers Estimate System, Center for Research in Security Prices (CRSP) and COMPUSTAT. To
test our hypotheses, we use OLS, logit, and probit regressions and include controls for a number
of analyst and brokerage characteristics.
3.1 Terrorist Attacks and Mass Shootings Data
We obtain data on terrorist attacks and mass shootings that occurred in the U.S. from January
1994 to December 2016. Specifically, we collect data on terrorist attacks from the Global
Terrorism Database (GTD).12 It is an open-source database that contains systematic data on
terrorist attacks (START 2016).13 We acquire data for mass shootings from Mother Jones,14
a nonprofit magazine that documents mass shootings in the U.S. For each one of the events
during this time period, we obtain their location and date.
Since the GTD includes information on terrorist attacks around the world, we eliminate
any event that has occurred outside of the U.S. Further, we consider only events that caused
human casualties. From the resulting list, we eliminate duplicate events that appear in both
datasets.15 We also exclude events for which there are no affected analysts around the attack
period.
11
Existing studies suggest that the forecasts of relatively more conservative analysts (i.e., relatively more pessimistic analysts) tend to be more accurate. For instance, Hugon and Muslu (2010) find that conservative analysts provide more efficient forecasts. Likewise, Jiang et al. (2016) show that conservative analysts, who are less likely to “hype a stock,” produce forecasts that are more accurate.
12
The data are available at https://www.start.umd.edu/gtd/.
13To consider an event a terrorist attack and to distinguish it from common criminal activities, we apply
the following three criteria as they appear in the GTD: “(i) The act must be aimed at attaining a political, economic, religious, or social goal; (ii) There must be evidence of an intention to coerce, intimidate, or convey some other message to a larger audience (or audiences) than the immediate victims; and (iii) The action must be outside the context of legitimate warfare activities, i.e., the act must be outside the parameters permitted by international humanitarian law (particularly the admonition against deliberately targeting civilians or non-combatants).” Source: https://www.start.umd.edu/gtd/faq/.
14The data are available at
https://www.motherjones.com/politics/2012/12/mass-shootings-mother-jones-full-data/. 15
Table A1 lists the 91 events during the 1994-2016 period that are included in our final
sample. Figure A1 shows their geographical distribution. The attacks do not exhibit any
obvious regional clustering.16
3.2 Analyst Forecasts
We obtain information on quarterly analyst forecasts for U.S. firms traded on the NYSE, AMEX,
or NASDAQ from Thomson Reuters’ Institutional Brokers Estimate System (I/B/E/S). We
exclude from our sample forecasts for firms that have missing price information in the Center
for Research in Security Prices (CRSP) database. We drop forecasts made by unidentified
analysts (i.e., forecasts with an analyst identifier equal to zero) and forecasts for stocks with
reported earnings measured in a currency other than U.S. dollars. Similar to Easton and
Sommers (2007), Malmendier and Shanthikumar (2014), and Jiang et al. (2016), our sample
period starts in 1994, where I/B/E/S data accuracy improves, and extends until 2016.
We follow the analyst literature and filter for potential entry errors by excluding forecasts
with an absolute forecast error greater than one (Lim, 2001; Bernhardt et al., 2006). To mitigate
the influence of outliers, we use forecasts for firms with an average share price greater than
$1 (Chen and Jiang, 2006; Cen et al., 2013; Malmendier and Shanthikumar, 2014). We also
eliminate forecasts for firms that are covered by less than five analysts (Hilary and Hsu, 2013)
to ensure that our consensus measurement is not influenced by firms that are covered by a small
number of analysts. Further, we keep forecasts with a maximum (minimum) horizon of 100 (2)
days from the earnings announcement to minimize the effect of stale forecasts and potential
information leakage (Jegadeesh et al., 2004; Jackson, 2005).
To identify the location of each analyst, we follow Jiang et al. (2016) and use the coordinates
of the city center in which the analysts’ branch office is based as the analyst location. We obtain
the latitude and longitude coordinates from the Gazetteer Files available from the U.S. Census
Bureau.
Our final sample consists of 24,203 forecasts issued by 2,631 analysts for 2,290 firms during
the 1994-2016 period. Figure A2 illustrates the distribution of these forecasts across different
states. Consistent with the findings in Malloy (2005), 51.20% of the analysts in our sample are
located in the state of New York and their forecasts constitute 58.80% of the total number of
forecasts.
16
3.3 Equity Data
We also use CRSP and COMPUSTAT datasets. From CRSP, we obtain monthly stock prices,
returns, and shares outstanding from January 1994 to December 2016. We restrict our sample
to only include common shares by keeping the observations with share codes of 10 or 11. From
COMPUSTAT, we obtain the location of each company’s headquarters.
3.4 Variable Definitions and Econometric Models
To examine whether affected analysts are more likely to issue relatively more pessimistic
fore-casts following a terrorist attack, we use an ordinary least squares (OLS) model. This model
allows us to include a large number of fixed effects without raising an incidental parameters
issue. Our conclusions remain unchanged if we use a logit or a probit estimator. Our OLS
model takes the following form:
P essimismi,j,t = c + β Exposurei,t + γ Xi,j,t + δanalyst+ αf irm + ζtime + εi,j,t (1)
whereiindexes analyst,jindexes firm, andtindexes time (quarter). P essimismi,j,tis a dummy
variable equal to one if the forecast of analyst iis less than the consensus forecast of analysts
who cover the same firmj within a 30-day window after an attack, and zero otherwise.17 The
consensus forecast is equal to the average value of the latest forecasts issued by all unaffected
analysts during the same 30-day period.18
Our main variable of interest, Exposurei,t, is a dummy variable equal to one if an analyst
is located within a 100-mile radius of an attack and if she issued a forecast during the 30-day
period following the terrorist attack, and zero otherwise. We calculate the distance between the
terrorist attacks and the analyst locations using the Haversine formula (Vincenty, 1975).
We control for a number of analyst and brokerage characteristics, indicated in equation (1) as
Xi,j,t. Specifically,F orecast Horizonis the number of days between the forecast date of analyst
ifor companyjand the earnings announcement date of companyjduring the same time period
t. Companiesis the number of companies analystifollows in year t. F irm Experience is the
number of years analystihas covered firmj. General Experience is the number of years since
analyst i’s forecast for company j at timetand the first forecast by analystifor any company
in the I/B/E/S database. To reduce the effect of outliers, we take the natural logarithm of
F irm Experienceand General Experience. Broker Sizeis the number of analysts employed
17
In section 5.1, we show that our results are robust to usingRelative Rank, an alternative continuous depen-dent variable.
by analysti’s brokerage at timet. We includeF emale, a dummy variable equal to one if analyst
iis female, and zero otherwise.19 All Staris a dummy variable equal to one if analystiis ranked
as first, second, third, or runner-up in the Institutional Investor magazine in the previous year,
and zero otherwise.20 We use theAll Star indicator variable to capture an analyst’s ability and
reputation.
In our specification, we also include the variable Distance, defined as the natural logarithm
of the distance between analyst iand firm’sj location.21 An analyst’s distance from a specific
firm may affect their propensity to issue pessimistic forecasts, as analysts who work near the
firms they cover tend to be more accurate (Malloy, 2005). Since analysts tend to specialize
in certain industries, we add Industry, which is the number of two-digit SIC codes analyst i
covers at timet. Lastly, we control for the lagged absolute value of the forecast error (LAFE),
which is analyst i’s absolute forecast error for company j at time t−1, to capture the effect
of her previous forecast accuracy on the current earnings forecast. Overall, our set of controls
aligns with studies by Clement and Tse (2003, 2005), Cohen et al. (2010), and Walther and
Willis (2013).
In addition to these control variables, we include analyst, firm, and time fixed effects, denoted
as δanalyst, αf irm, and ζtime, respectively. The analyst fixed effects capture any systematic
variation in pessimism among analysts. The firm fixed effects control for any firm-specific, time
invariant, unobservable variables that could be driving our results. The time fixed effects are
used to remove any time trends.
3.5 Summary Statistics
We report summary statistics for our sample in Table 1. Panel A contains information on the
number of forecasts, analysts, brokerage houses, and stocks that are included in our dataset. We
also provide information regarding the number of affected analysts per period and the number
of forecasts they issued.22 As expected, the number of affected forecasts is always lower than
the number of total forecasts. However, it is greater than the number of affected analysts, as
some analysts tend to give forecasts for two or more firms during the 30-day period following
an attack. During our sample period, 34.41% of the analysts are treated and 39.57% of the
forecasts are issued by them.
19Kumar (2010) shows that an analysts’ gender can affect their forecasts. 20
The data on analyst gender and all-star status are those used in Kumar (2010) and Jiang et al. (2016). We update their data for our sample period using their method.
21
We obtain the coordinates of firms by matching their ZIP codes with the Gazetteer Files from the U.S. Census Bureau. We drop from our sample firms with missing ZIP codes. To calculate the distance between the firms and the analysts, we use the Haversine formula (Vincenty, 1975).
22
Table 1 also shows the descriptive statistics for the variables in our main specification. We
find that analysts in our sample have 6.71 years of General Experience, a little more than
2 years of F irm Experience, and follow stocks in about 3 industries. F emale and All Star
analysts constitute 13% and 14% or our sample, respectively.
4
Main Empirical Results
In this section, we test our main conjectures. In particular, we analyze whether analysts who
have been exposed to a terrorist attack are more likely to issue relatively more pessimistic
forecasts. We also examine if this effect is stronger when an event is considered to be more
salient. Specifically, we investigate whether this effect diminishes as an analyst’s distance from
an attack increases and if the effect is stronger in states that have lower homicide rates. In
addition, we test if treated analysts are relatively more pessimistic around the anniversaries of
these attacks and if this attack-induced pessimism can affect their forecast accuracy. We then
investigate the market’s reaction to treated analysts’ forecast revisions.
4.1 Terrorist Attacks and Analyst Pessimism
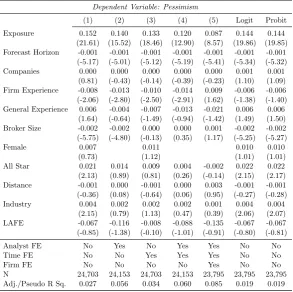
We present our baseline results in Table 2. We report the results from the OLS models in
columns (1) to (5) and results from logit and probit regressions in the subsequent columns. For
the OLS specifications, we include analyst, time, and firm fixed effects sequentially.
Consistent with our main hypothesis (H1), we find that affected analysts (i.e., analysts
who are local to terrorist attacks and issue a forecast during the 30-day period following the
event) are relatively more pessimistic. As shown in column (5), treated analysts are 8.70% more
likely to issue a forecast below the consensus than untreated analysts. Not only is this effect
statistically significant at the 1% level, but it is also economically meaningful, representing
approximately 17.6% (i.e., 0.087/0.494) of the standard deviation of our P essimism variable.
Our first hypothesis is also supported by the results from the logit and probit regression models.
Examining the estimates of our control variables, we find thatHorizon is negatively related to
pessimism, in line with the results in Malloy (2005) and Cowen et al. (2006).
The findings in the section provide strong support for our first hypothesis (H1): affected
analysts who are exposed to terrorist attacks are more likely to issue pessimistic forecasts. It is
important to mention that the consensus forecast could be biased either upward or downward
relative to firm fundamentals (So, 2013). Since in our setting we are using analysts’ consensus
as our benchmark, it is possible that treated analysts are more pessimistic relative to other
both benchmarks. Nonetheless, both of these results suggest that terrorist attacks are associated
with downward biased analyst forecasts, albeit to different degrees.
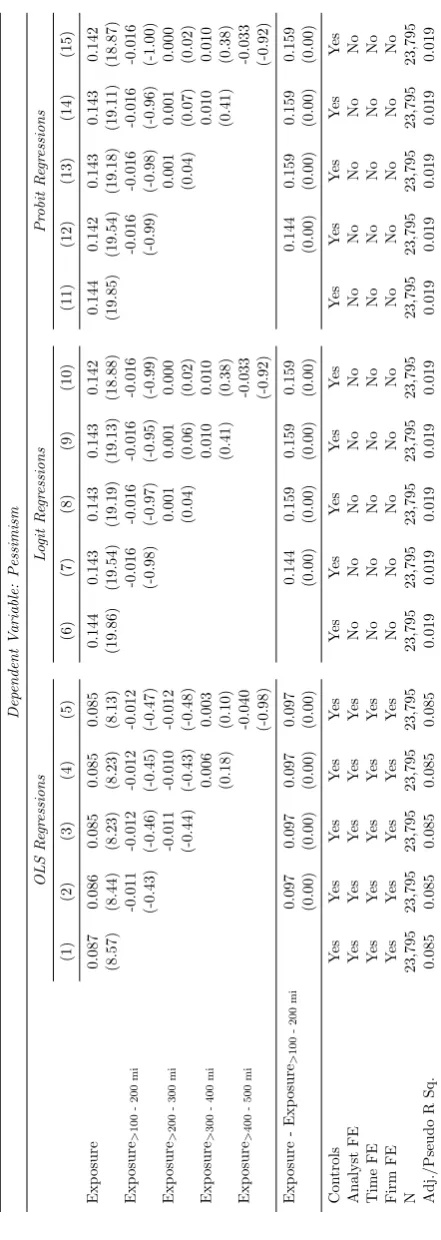
4.2 Event Salience and Analyst Pessimism
Our second hypothesis (H2) states that more salient events will generate more pessimistic
forecasts. To test this conjecture, we use two measures of salience. First, we use the geographical
distance between an analyst and an event. We expect that analysts who are located closer to
the attack will be more pessimistic than analysts who are located farther away from the event
location. The results, shown in Table 3, indicate that analysts who reside within a 100-mile
radius from the event are 8.50% more likely to issue a pessimistic forecast. In contrast, analysts
that reside outside of this radius do not issue pessimistic forecasts. We find similar results
using logit and probit regressions in columns (6) to (15). Additionally, the pessimism levels of
analysts inside and outside the 100-mile radius are consistently statistically different at the 1%
level.23
As our second salience proxy, we utilize the general level of murder rates in an analyst’s home
state. We collect information on the murder rates of each state from the FBI’s Uniform Crime
Reporting Program (UCR).24 We divide each state’s murder rate by its respective population
to obtain a per-capita level of murder activity. The dummy variable Crime is equal to one if
the analyst is located in a state with a murder rate that is below the median in a given year.
We re-estimate our models by interacting Exposure with Crime, where we expect to find a
positive coefficient on the interaction term.
The results in Table 4 are in line with our conjecture. We find that analysts who are located
in states with low murder rates are 9.20% more likely to issue pessimistic forecasts than treated
analysts who reside in states with high murder rates. In addition, these results indicate that the
aggregate effect of being treated and living in a low crime state is 12.90% (i.e., 0.038−0.001 +
0.092). As shown by the last two columns, these findings are robust to using logit and probit
models.
Collectively, the results in this section support our second hypothesis (H2) and show that
events that are likely to be perceived as more salient generate more pessimistic earnings
fore-casts.
23
The average forecast horizons of analysts who reside within and outside a 100-mile radius of the attack locations during the 30-day period following the events are very similar, 37.04 and 37.30 days, respectively. These two values are not statistically different, suggesting that local analysts are unlikely to be more pessimistic because they systematically delay the timing of their forecasts.
24The UCR defines criminal homicide, meaning murder and nonnegligent manslaughter, as “the willful
4.3 Anniversaries of Terrorist Attacks and Analyst Pessimism
In this section, we test our third hypothesis (H3) and examine whether affected analysts become
more pessimistic around the anniversaries of terrorist attacks. To test this conjecture, we
re-estimate our baseline specification one, two, and three years after the attacks. Further, since the
state of New York has experienced several events, including a 9/11 attack, we exclude analysts
located in this state and examine whether our anniversary results hold.
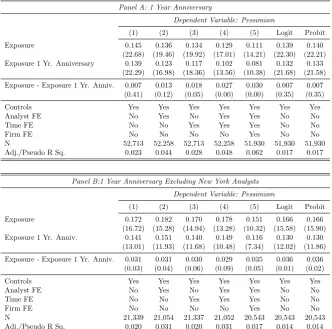
Table 5, Panels A and B report the results for the first anniversaries. We find that after
one year, affected analysts are 8.10% more likely to issue a pessimistic forecast. This effect is
lower than the effect during the year of the attack, which is expected since the shock to the
sentiment of an analyst around the anniversary of the event is likely to be weaker. Similarly,
Panel B suggests that the results are robust to excluding NY analysts from the sample.
In Panels C and D, we conduct the same analysis for the second anniversaries. We find a
significant anniversary effect, as theExposure 2 Y r. Anniversary is positive and statistically
significant throughout all specifications. In Panel C, the Exposure 2 Y r. Anniversary
coeffi-cient is even stronger than theExposure1Y r. Anniversarycoefficient. A possible explanation
for this finding is that in 2003, the Lower Manhattan Development Corporation launched an
international competition (the World Trade Center Site Memorial Competition) to encourage
individuals or teams to submit proposals to design the memorial.25 The awareness created by
this event could have made NY analysts relatively more pessimistic. As shown by Panel D,
when we drop analysts located in NY, analysts’ pessimism decreases monotonically starting the
year of the event until two years after.
Panels E and F show that after three years, the Exposure 3 Y r. Anniversary is not
sta-tistically significant. This evidence indicates that after three years, terrorist events no longer
affect analyst sentiment.26
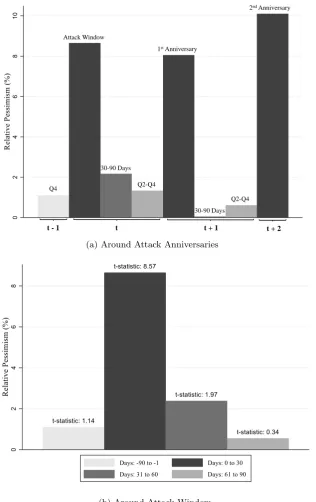
The anniversary effects are evident in Figure 1a, as treated analysts tend to be more
pes-simistic 30 days following the attacks, as well as during the first and second anniversaries.
Importantly, treated analysts are not consistently pessimistic throughout the year, suggesting
that the effect is likely to be driven by analysts remembering these terrorist attacks. For
in-stance, the 1-year anniversary effect tends to be greater than the pessimism levels during the
previous and following quarters. Treated analysts’ pessimism during the 30 days following the
25Source: https://www.cnn.com/2013/07/27/us/ground-zero-memorial-and-rebuilding-fast-facts/
26
second anniversaries is also higher than the effects leading up to the second anniversary.
Over-all, these findings support our third hypothesis (H3) and show that treated analysts become
more pessimistic during the anniversaries of attacks.
4.4 Terrorist Attacks and Forecast Accuracy
However, whether biases improve forecast accuracy or make analysts less accurate is not clear.
Next, we test our fourth hypothesis (H4), which examines whether the attack-induced pessimism
affects analyst accuracy.
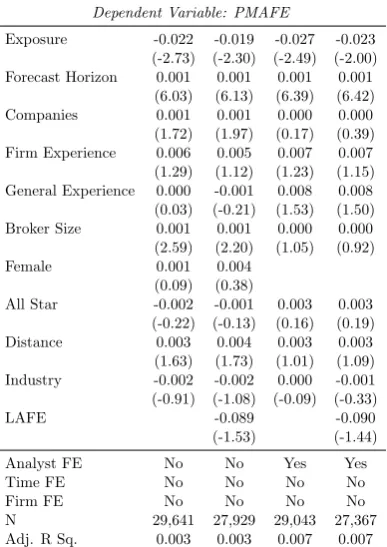
To test this conjecture, we create a performance measure similar to Clement (1999).
Specif-ically, we calculate the proportional median absolute error (PMAFE) to compare an analyst’s
absolute forecast error to the median absolute forecast error of other analysts following the same
firm during the same time period. Specifically, PMAFE is calculated as follows:
P M AF Ei,j,t=
AF Ei,j,t − AF E\j,t
\
AF Ej,t
, (2)
where AF Ei,j,t is the absolute forecast error for analyst i, firmj, at time t and AF E\j,t is the
median absolute error for firm j at time t.27 An advantage of using this measure, as Clement
(1999) suggests, is that it accounts for firm × time fixed effects. A negative value of PMAFE
suggests that an analyst has a better than average performance while a positive value suggests
that an analyst has worse than average performance.
The results from the forecast accuracy regressions in Table 6 indicate that affected analysts
are more accurate than the average analyst. This finding provides novel evidence that in some
cases, behavioral biases can induce an improvement in performance.28 Specifically, our results
show that exogenous events, such as terrorist attacks and mass shootings, improve the forecast
accuracy of affected analysts. The effect on accuracy is not only statistically significant but also
economically significant, since theExposurecoefficient is larger than the coefficient estimate on
All Star indicator. We also find that analysts with shorter horizons are more accurate. These
results are in line with the findings in the analyst literature (Malloy, 2005; Clement and Tse,
2005; Kumar, 2010; Jiang et al., 2016).
Collectively, our results show that exposure to terrorist attacks affect analyst forecast
accu-racy. Treated analysts issue forecasts that are more accurate. These findings are inconsistent
with the limited attention literature, which predicts that analysts who are more distracted
27
See Clement (1999) for more details on this measure.
28Most existing studies find that behavioral biases either do not affect or worsen an analyst’s forecast accuracy
would issue forecasts that are systematically farther away from the consensus and have a lower
forecast accuracy.
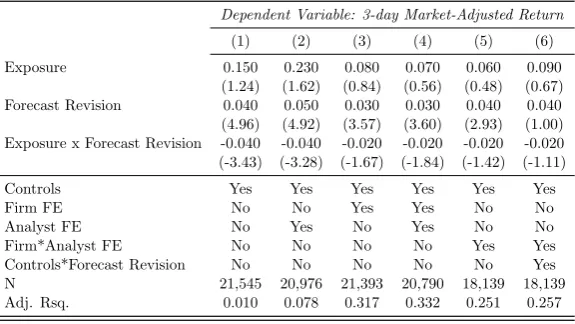
4.5 Market’s Reaction to Forecast Revisions
Since the earnings forecasts of analysts can be a useful source of information for investors, we
examine whether investors anticipate, or regard as probable, that treated analysts are more
accurate. For this test, we follow the methodology of Hirshleifer et al. (2019) and regress a
firm’s returns onF orecast Revision ×Exposure. The dependent variable in the regression is
a firm’s three-day market adjusted excess return centered on the forecast revision date. The
main independent variable is F orecast Revision, which is a measure of the difference between
analyst i’s current forecast for firm j at time t and the forecast issued immediately before the
current forecast, scaled by the standard deviation of forecasts of all analysts who follow firm
j in time t. We control for Friday and fourth quarter effects, in addition to the covariates in
equation (1).29
The estimates in Table 7 show that the coefficient on F orecast Revision is positive and
statistically significant in all columns, except when we include controls interacted byF orecast
Revision. This evidence indicates that the market reaction around the forecast revision is
correlated with the signed magnitude of the forecast revision. However, the interaction term,
F orecast Revision × Exposure is not statistically significant in our strictest specifications.
This finding suggests that the forecasts revisions of exposed analysts do not generate stronger
market reactions, meaning that investors do not anticipate for exposed analysts to be more
accurate.30
5
Robustness Tests
Our baseline results indicate that following a terrorist attack, affected analysts tend to issue
more pessimistic forecasts than analysts who have not been impacted by the event. In this
section, we examine the robustness of these results using a continuous measure of pessimism
29The strictest regression specification includes Analyst×Firm fixed effects. We are unable to include Analyst
×Day fixed effects as they absorb our main independent variable,Exposure.
30Malmendier and Shanthikumar (2014) suggest that large investors are more likely to follow analysts’ forecasts,
and alternative sample and regression specifications.
5.1 Alternative Dependent Variable
The main dependent variable in our analysis, P essimism, is a dummy variable equal to one
when an analyst issues a forecast that is less than the consensus forecast of all unaffected
analysts who cover the same firm during the same 30-day window following the attack date,
and zero otherwise. As an alternative dependent variable, we use a continuous measure of
pessimism,Relative Rank. Since this alternative variable is constructed on the basis of how an
analyst’s pessimism ranks in the distribution of all forecasts for a certain firm during the same
time period, it could be less sensitive to outliers. To construct Relative Rank, we follow Hong
and Kubik (2003) and compute analysti’s forecast error (FE) for firmjat timet.31 We sort all
forecasts for firm j at time tbased on this value.32 A lower ranking value reflects that analyst
iis relatively more pessimistic.33
Table 8, Panel A provides evidence that our results are robust to usingRelative Rankas the
dependent variable. The coefficient in the strictest specification is−0.378 (t-statistic =−6.56), suggesting that analysts who have been exposed to an attack are relatively more pessimistic
and have a lower ranking.
5.2 Excluding 9/11 Attacks
The most significant events in our sample are the attacks that occurred on September 11, 2001.
To ensure that our findings are not solely driven by these attacks, we exclude them from our
sample and re-estimate our baseline specifications. The results in Table 8, Panel B show that our
main independent variable, Exposure, remains positive and statistically significant throughout
all regression specifications. This evidence indicates that our main effect is not driven by the
9/11 attacks.
5.3 Excluding New York Analysts
About 51.20% of the analysts in our sample are located in the state of New York. To confirm
that our results are not driven by analysts located in this state or by attacks that occur in this
area, we exclude all analysts who work in the state of New York and repeat our baseline analysis.
31
The forecast error FE is defined as F orecasted Earningsi,j,t −Actual Earningsj,t
Stock P ricej,t . The stock price is measured
at the end of the previous month in which the forecast is issued. 32
Hong and Kubik (2003) rank analysts using AFE instead of FE. However, since we want to analyze an analyst’s relative pessimism, it is important for us to know whether the forecast error is above or below the actual earnings estimate.
33If two or more analysts were equally pessimistic, we assign the midpoint value of the ranks to all those
Table 8, Panel C shows that even though the statistical significance of the coefficientExposure
is reduced, it remains statistically significant. This evidence suggests that our findings are not
generated by the high concentration of equity analysts in the state of New York.
5.4 Forecasts during Sunny and Cloudy Months
Recent research has examined whether cloud cover can affect investor mood (e.g., Chang et al.
(2008); Bassi et al. (2013); Goetzmann et al. (2014)). Similarly, Dehaan et al. (2017) use
wind and rainfall, along with cloud cover, to show that unpleasant weather can induce analyst
pessimism. To ensure that our results are distinct from weather-induced pessimism, we
re-estimate our baseline specification during Sunny (three months with low cloud cover) and Cloudy
months (three months with high cloud cover). We collect cloud cover data from the Comparative
Climatic Data from the National Centers for Environmental Information (NCEI), which is
overseen by the National Oceanic and Atmospheric Administration (NOAA). The estimates in
Table 8, Panel D show that our results hold during sunny and cloudy months, suggesting that
our findings are unlikely to be driven by weather-induced pessimism.
5.5 Event Window Sensitivity
In our empirical analysis, we use a 30-day window to analyze whether terrorists become more
pessimistic after a terrorist attack. We perform sensitivity analysis on this time-frame and
examine if our results are robust to smaller windows. Table 8, Panel E presents results for
analysts who issued forecasts five days after an event and are located within 100 miles. We find
that even if the number of observations is significantly reduced, treated analysts are more likely
to issue pessimistic forecasts. The magnitude of the estimates are also larger, suggesting that
the effect is stronger when the forecast issue date is closer to the attack date. In untabulated
results, we also find that our results are robust to the choice of a three-day event window.
5.6 Placebo Tests
To further ensure that we are capturing the effect of terrorist attacks on analysts’ mood, we
conduct a placebo test. In particular, for each terrorist attack, we randomize the location.
We expect the Exposure coefficient to be statistically insignificant. Consistent with this
ex-pectation, the results in Table 8, Panel F show that the Exposure coefficient estimate is not
5.7 Firm Characteristics
In this section, we examine whether treated analysts’ pessimistic forecasts are driven by certain
firm characteristics. It is likely that pessimistic forecasts are potentially more likely to be issued
for smaller and relatively more illiquid stocks. In Table A2, we report the average characteristics
of firms for which treated analysts issue pessimistic forecasts and compare them to the average
characteristics of firms for which they issue non-pessimistic forecasts. As shown by the Diff.
column, none of the differences are statistically significant. This evidence suggests that the
pessimistic forecasts are unlikely to be driven by systematic differences in firm characteristics.
5.8 Firm × Time Fixed Effects
Our baseline specification includes firm, time, and analyst fixed effects. For additional
robust-ness, we modify our specification to include firm ×time fixed effects and analyst fixed effects.
Firm×time fixed effects are useful to control for common information about firm earnings that
is available to all analysts. In untabulated results, we find that our results are robust to the
inclusion of these fixed effects.
6
Alternative Explanations: Pessimism or Other Factors?
We conduct several tests to examine the robustness of our findings and entertain alternative
explanations for our results. First, we study whether analysts are pessimistic before an attack.
Second, we analyze whether analyst pessimism is induced by omitted economic variables. We
also investigate whether certain analysts are more pessimistic because they have superior
infor-mation and understand that some companies could be more sensitive to terrorist attacks. Last,
we test if treated analysts are more accurate not due to increased pessimism but because they
are more likely to issue bold forecasts.
6.1 Time Trend in Pessimism
A potential concern with our results is that we are capturing a pre-existing trend in analyst
pessimism rather than the impact of terrorist attacks. Specifically, analysts could already be
pessimistic before the attack as opposed to becoming pessimistic after the event. Ruling out
the existence of this trend is important for our analysis because our hypothesis states that the
differences in analyst pessimism arise due to their exposure to terrorist events and not due to
other variables that could have affected their pessimismex-ante.
the attack until 90 days after the attack. The graph shows that prior to the attacks, analysts
are not pessimistic. This evidence suggests that the pre-existing pessimism hypothesis is not
supported. However, after the attack, treated analysts are relatively more pessimistic for about
30 days. After this time period, their pessimism gradually decreases for another month until it
disappears three months after the attack.
To ensure that the potential differences in pessimism levels of treated and untreated analysts
are not statistically significant, we include an indicator variable, Exposure−90 to−1 days, that
equals one if an analyst issues a forecast 90 days prior to an attack and is located within
100 miles. The results in Table 9, Panel A show that the lagged variables are statistically
insignificant, suggesting that prior to the attacks, there are no significant differences between
treated and untreated analysts. On the other hand, theExposure0 to 30 dayscoefficient is positive
and statistically significant at the 1% level. This evidence indicates that prior to an attack,
there are no significant differences in the pessimism levels of treated and untreated analysts;
however, after an attack occurs, the sentiment of treated analysts changes and they become
relatively more pessimistic.
Taken together, the evidence in Figure 1b and Table, 9 Panel A indicates that the differences
in pessimism levels only exist following the terrorist attacks. Thus, some pre-existing trend in
analyst pessimism does not explain our findings.
6.2 Terrorist Events and State-Level Macroeconomic Conditions
Another possible alternative explanation for our findings could be that terrorist events are
related to the macroeconomic environment of the state in which they occur, which could
subse-quently affect analysts’ risk attitudes and increase their likelihood of issuing pessimist forecasts.
To control for this possibility, we re-estimate our baseline specification and include each state’s
per capita Gross State Product (GSP) and unemployment rate as control variables.34 The
esti-mates reported in Table 9, Panel B indicate that the coefficient on Exposure remains positive
and statistically significant at the 1% level across all model specifications. TheGSP coefficient
is positive and statistically significant in column (5). However, the U nemployment coefficient
is statistically insignificant when we include analyst, time, and firm fixed effects. These findings
suggest that even when we account for a state’s economic environment, treated analysts are
more likely to issue pessimistic forecasts.
34We collect state-level GDP data from the U.S. Bureau of Economic Analysis (BEA) and unemployment data
6.3 Do Affected Analysts Have Superior Information?
In the next set of tests, we examine whether treated analysts issue pessimistic forecasts because
they have a better understanding of how terrorist events affect some industries more than others.
For example, companies that belong to the airline industry could be more sensitive to terrorist
attacks than companies that belong to the agricultural industry. As a result, analysts may
issue information-driven pessimistic forecasts for highly sensitive companies. If we find support
for this alternative story, it would suggest that our results may be driven by treated analysts’
superior information instead of their attack-induced pessimism.
To determine whether our results reflect treated analysts’ superior information or
sentiment-induced pessimism, we first estimate the sensitivity of each industry to terrorist attacks. We
use two interaction terms to condition our main independent variable, Exposure, on whether
a specific company operates in a high- or low-sensitivity industry: Exposure×IndustryLow
and Exposure×IndustryHigh. If our findings are driven by the information channel, then the
coefficient of the interaction term,Exposure×IndustryLow, would be lower than the coefficient
for the interaction term, Exposure×IndustryHigh, suggesting that treated analysts are more
likely to issue pessimistic forecasts for firms that are more sensitive to terrorist attacks.
To estimate the sensitivity of each industry to terrorist attacks, we regress the daily excess
returns of the 48 Fama-French industries on the market excess returns and a dummy variable
that equals one when an attack occurs.35 We use a rolling 12-month window to calculate the
be-tas. The industries with a lower beta (i.e., bottom half) are labeled as low sensitivity industries
and industries with a higher beta (i.e., top half) are labeled as high sensitivity industries.
The results in Table 10 do not support the superior information hypothesis. The coefficients,
Exposure×IndustryLow and Exposure×IndustryHigh, are both statistically significant.
Fur-ther, the coefficient of the interaction term, Exposure×IndustryLow, is systematically higher
than the coefficient for,Exposure×IndustryHigh. More importantly, the difference between the
Exposure×IndustryLow andExposure×IndustryHigh coefficients is positive and statistically
significant throughout all the specifications. This finding indicates that treated analysts are
less likely to issue pessimistic forecasts for industries that are more sensitive to these events,
providing support for the sentiment-induced channel as opposed to the superior information
hypothesis.
6.4 Pessimism Induced Accuracy or Bold Forecasts?
A possible explanation for the higher accuracy of treated analysts could be that they are more
likely to issue both positive and negative bold forecasts, which are known to be associated with
greater forecasts accuracy (Clement and Tse, 2005). However, if their greater accuracy is driven
by sentiment-induced pessimism due to the attacks, then they are more likely to issue downward
bold revision forecasts but not upward bold revision forecasts.
To test for these possibilities, we first analyze whether treated analysts are more likely to
issue bold forecasts. Our first dependent variable is Bold Revision, a dummy variable equal
to one if an analyst issues a forecast that is either above or below the prior consensus as well
as her previous forecast, and zero otherwise. Similar to our baseline specification, we regress
Bold Revision on Exposure and several control variables, identical to those used in equation
(1). Table 11, columns (1) and (2) show that the coefficient on Exposure is negative and
statistically significant, suggesting that analysts who are exposed to the terrorist attacks are
less likely to issue bold forecasts. This evidence suggests that treated analysts are not more
accurate because they systematically issue bold forecasts.
We then test whether they are more likely to issue downward bold forecasts but less
likely to issue upward bold forecasts. In columns (3) and (4), the dependent variable is
Downward Bold Revision, a dummy variable equal to one if an analyst issues a forecast below
the prior consensus and her previous forecast, and zero otherwise. In columns (5) and (6), the
dependent variable is U pward Bold Revision, a dummy variable equal to one if an analyst
issues a forecast above the prior consensus and her previous forecast, and zero otherwise.
Our results show that affected analysts are more likely to issue downward bold revisions
but not upward bold revisions. For instance, the Exposure coefficient in column (4) is 0.040
(t-statistic = 1. 90), while the Exposure coefficient in column (6) is −0.488 (t-statistic =
−27.56). These results also rule-out an alternative explanation where treated analysts are more
likely to wait until after management guidance to revise their forecasts. If this were the case,
they would be more likely to issue both downward and upward bold forecasts.
Overall, the findings from this section suggest that analysts issue more pessimistic forecasts
due to the pessimism induced by the attacks. Consistent with the evidence in prior studies,
this sentiment-induced pessimism makes analysts more accurate (Hugon and Muslu, 2010; Jiang
7
Summary and Conclusions
This paper examines the effects of terrorist attacks and mass shootings on the earnings
fore-casts of sell-side analysts. Specifically, we study whether analysts who are located near such
events tend to experience a negative shock to their sentiment, which can potentially generate a
pessimistic bias in their earnings expectations.
Consistent with our hypothesis, we find that analysts who are located near major terrorist
attacks in the U.S. issue more pessimistic forecasts (relative to the consensus) in the period
following the attacks. These effects are stronger when the event is considered to be more
salient. In particular, attack induced analyst pessimism is greater when an analyst is located
closer to an attack and when the state where an analyst is located has a lower crime rate.
We also find that affected analysts become more pessimistic than the consensus around the
anniversaries of these attacks. Interestingly, treated analysts are more accurate following an
attack. Our market reaction tests suggest that investors do not anticipate for treated analysts
to be more accurate, as their forecast revisions do not lead to stronger market reactions.
Collectively, these results complement the evidence from the existing literature on analysts’
behavioral biases. Our main contribution is to show that the attack-induced pessimism of
treated analysts affects their forecasts and the information dissemination process in financial
markets. In future research, it would be interesting to examine whether the decisions of other
References
Abadie, A. and Gardeazabal, J. (2003). The economic costs of conflict: A case study of the
Basque Country. American Economic Review, 93(1):113–132.
Ahern, K. R. (2018). The importance of psychology in economic activity: Evidence from
terrorist attacks. Technical report, National Bureau of Economic Research.
Amihud, Y. (2002). Illiquidity and stock returns: Cross-section and time-series effects. Journal of Financial Markets, 5(1):31–56.
Anderson, C. A. and Dill, K. E. (2000). Video games and aggressive thoughts, feelings, and
behavior in the laboratory and in life.Journal of Personality and Social Psychology, 78(4):772.
Antoniou, C., Kumar, A., and Maligkris, A. (2017). Terrorist attacks, managerial sentiment, and
corporate policies. Working Paper, Available at SSRN: https://ssrn.com/abstract=2566740.
Arin, K. P., Ciferri, D., and Spagnolo, N. (2008). The price of terror: The effects of terrorism
on stock market returns and volatility. Economics Letters, 101(3):164–167.
Bali, T. G., Brown, S. J., and Tang, Y. (2017). Is economic uncertainty priced in the
cross-section of stock returns? Journal of Financial Economics, 126(3):471–489.
Bandyopadhyay, S., Sandler, T., and Younas, J. (2013). Foreign direct investment, aid, and
terrorism. Oxford Economic Papers, 66(1):25–50.
Barry Johnston, R. and Nedelescu, O. M. (2006). The impact of terrorism on financial markets.
Journal of Financial Crime, 13(1):7–25.
Bassi, A., Colacito, R., and Fulghieri, P. (2013). ’O sole mio: An experimental analysis of
weather and risk attitudes in financial decisions.The Review of Financial Studies, 26(7):1824– 1852.
Becker, G. S., Rubinstein, Y., et al. (2011). Fear and the response to terrorism: An economic
analysis. Working Paper.
Benzion, U., Shahrabani, S., and Shavit, T. (2009). Emotions and perceived risks after the 2006
Israel–Lebanon war. Mind & Society, 8(1):21.
Bergman, N. K. and Roychowdhury, S. (2008). Investor sentiment and corporate disclosure.