warwick.ac.uk/lib-publications
Original citation:Hu, Xiao-Bing, Shi, Peijun, Wang, Ming and Leeson, Mark S.. (2017) Adaptive behaviors can improve the system consilience of a network system. Adaptive Behaviour .
105971231774795.
Permanent WRAP URL:
http://wrap.warwick.ac.uk/99014
Copyright and reuse:
The Warwick Research Archive Portal (WRAP) makes this work by researchers of the University of Warwick available open access under the following conditions. Copyright © and all moral rights to the version of the paper presented here belong to the individual author(s) and/or other copyright owners. To the extent reasonable and practicable the material made available in WRAP has been checked for eligibility before being made available.
Copies of full items can be used for personal research or study, educational, or not-for profit purposes without prior permission or charge. Provided that the authors, title and full bibliographic details are credited, a hyperlink and/or URL is given for the original metadata page and the content is not changed in any way.
Publisher’s statement:
Hu, Xiao-Bing, Shi, Peijun, Wang, Ming and Leeson, Mark S.. (2017) Adaptive behaviors can improve the system consilience of a network system. Adaptive Behaviour . Copyright © The Author(s) 2017. Reprinted by permission of SAGE Publications.
Published version: http://dx.doi.org/10.1177/1059712317747951
A note on versions:
The version presented here may differ from the published version or, version of record, if you wish to cite this item you are advised to consult the publisher’s version. Please see the ‘permanent WRAP url’ above for details on accessing the published version and note that access may require a subscription.
Adaptive Behaviors Can Improve the System Consilience of a Network System
Xiao-Bing Hu1,2,3, Pei-Jun Shi1, Ming Wang1, M.S. Leeson3
1 State Key Laboratory of Earth Surface Processes and Resource Ecology, Academy of Disaster
Reduction and Emergence Management, Faculty of Geographic Science, Beijing Normal University,
Beijing, 100875, China;
2 China-France Joint Research Center of Applied Mathematics for Air Traffic Management, Tianjin Key
Laboratory for Advanced Signal Processing, College of Electronic Information and Automation, Civil
Aviation University of China, Tianjin, 300300, China;
3 School of Engineering, University of Warwick, Coventry, CV4 7AL, UK
Abstract
As a recently reported network property, consilience degree (CSD) indicates how well a network
system integrates its topology and node activities together to serve a specific systemic goal. As is
well-known, many natural and man-made systems are complex networks where, besides network
topology, node activity states also play an important role in determining system performance. For
example, a collaborative project involving friends is more likely to succeed than one involving
enemies, even though the topology of organization network is the same. The concept of CSD can
quantitatively distinguish the difference between the involvement of friends and the involvement
of enemies. This paper reports a simulation study on the adaptive behaviors of nodes based on the
selfish rule and the following-others rule, and the simulation results show that, based on such
adaptive behavior of nodes, a network system will automatically evolve to a high level of system
consilience. The simulation study also demonstrates that a high level of system consilience
resulting from adaptive behavior will contribute to increased system resistance to external
disturbances. The generality of adaptive behaviors in reality implies that CSD is an inherent
attribute of real-world network systems, and therefore, the concept of CSD has significant
application potential in the study of adaptive behavior in network systems.
Keywords: Adaptive Behavior; Complex Network; Consilience; Disturbance.
1. Introduction
Human society is a complex network system (Ostrom, 2009; Ball, 2012). To study various
phenomena within it, the concept of "degree of connectedness" (CND) is often used, which indicates
how many nodes are connected to a given node in a network system (Albert and Barabási, 2002;
Boccaletti et al., 2006). For example, the method of CND distribution is applied to study the
co-authorship between scholars (Newman, 2001), the sexual contacts in a community (Liljeros et al.,
2001), and the collaborations between movie actors (Watts and Strogatz, 1998), and it proves that all of
these human network systems share a feature of scale-free topology, where a few hub nodes have many
links, while most other nodes have very few links. Another famous finding of CND-based study on
human society is that our world is a small one of 6-degree of separation in terms of friendship (Kochen,
1989). Despite of the success of CND-based studies on human society, many complicated societal
phenomena still remain unexplained and there is thus still a demand for new theories and methods for
the study of complex network systems (OECD, 2011; Ball, 2012; Helbing, 2013).
Fig.1 illustrates an example where CND-based theories and methods become of little use. In spite of
exactly the same network topology and human resources, Network System 1, by considering the
similarity in expertise, is more likely to deliver a successful project than Network System 2 according to
our daily common sense. Clearly, CND-based network theories and methods largely fail to quantify or
distinguish the system capability to serve the purpose of delivering a successful project in Fig.1. This
failure of CND is largely because it only focuses on network topology and ignores the nature of the
interconnections between kinds of expertise. Actually, the performance of many real-world network
systems is determined not only by network topology but is also largely dependent on whether the
heterogeneity in nodes activities has been taken into account during the network topology design. In
reality, it is often observed that connecting two nodes with conflictive activities will only degrade
system performance. Therefore, to study real-world social network systems, various node activities, such
as individual fitness (Caldarelli et al., 2002), friendship paradox (Eom and Jo, 2014), social norms and
collaborative expectations (Peyton, 1998), epidemic dynamics (Pastor-Satorras and Vespignani 2001),
and co-evolutionary activities (Nardini et al., 2008; Aoki and Aoyagi, 2012) have been introduced. In
many domains of engineering and technology, for example, neural networks (Daido and Nakanishi
2004), power grids (Blaabjerg et al. 2006), protein networks (Maslov and Sneppen, 2002) and data
mining (Hric et al. 2016; Peel et al. 2017). These case studies clearly show that focusing only on CND
and network topology is not enough to understand real-world network systems. Besides, some general
methods used for investigating assortativity mixing (Newman, 2003; Newman, 2010; Noldus and Van
Mieghem, 2015), dyadic effect (Cinelli et al., 2017; Park and Barabási, 2007) and metadata (Eom and Jo,
2014; Peel et al. 2017) have also proved highly useful to study the importance of integrating network
topology and node activities, and these methods have often been described as parallel concepts to the
concept of CND.
Fig.1. Networks of collaborating people (for the definition and calculation of ACND and ACSD, see Section 2).
We have recently proposed a new, fundamental network property, which we termed the consilience
degree (CSD), which aims to quantitatively measure how well a network system integrates both the
network topology and the node activity states together for a given systemic goal. In essence, CSD was
proposed and positioned as an extension or generalization of CND (CND is just a special case of CSD)
(Hu et al., 2014; Hu et al., 2017). In short, the CSD of a node is not only determined by how many other
nodes it connects to, but also largely dependent of what kind of node activity states those connected
nodes have. If a node is connected to many other nodes which have rather conflictive activity states to its
own, then, although the node will have a large CND value, it will possess a very small CSD value. In
system performance, while connecting two supportive nodes is desirable in terms of a given systemic
goal. For example, in Fig.1, the nodes in those sub-systems of Network System 1 have much larger CSD
values than those of Network System 2. Basically, system consilience, measured by the average CSD
values of all nodes, may describe phenomena in human society, such as consensus of wills, convergence
of opinions, and coordination of activities, which are all beyond the capability of the CND concept (Hu,
et al., 2014; Hu, et al., 2017).
This paper, by investigating the relationship between adaptive behaviors and system consilience,
aims to further demonstrate the usefulness of the CSD concept in studying complex network systems. It
is well known that adaptive behaviors of individuals are common in complex network systems
(Grefenstette, 1992; Ostrom, 2009; Ball, 2012; Shaukat and Chitre, 2016). The hypothesis of this study
is that, if system consilience is related to adaptive behaviors in some sense, then the concept of CSD can
be safely viewed as an inherent attribute of real-world systems, rather than an artificial network property
in theory. The remainder of this paper is organized as follows. Section 2 briefly reviews the
mathematical description of the CSD concept. Section 3 develops a model of adaptive behaviors based
on the selfish rule and the following-others rule. Section 4 conducts a simulation study on system
resistance to external disturbances, followed by some main conclusions to end the paper in Section 5.
2. Mathematical definition of consilience degree (CSD)
Here, based on the original concept of CSD proposed in Hu et al. (2014 and 2017), we give a brief
review of the mathematical description of CSD. Suppose there is a networked system, whose topology is
given by G(V,E), composed of node set V and link set E, where V has NN nodes and E has NE links. Let
the adjacency matrix record all links, i.e., MA(i,j) = 1 means that there is a link between nodes i and j,
and otherwise MA(i,j) = 0. It is known that the degree of connectedness (CND) of node i, indicating how
many other nodes are connected to node i, is mathematically defined as (Albert and Barabási, 2002;
Boccaletti et al., 2006):
NN j
A i
CN M i j
k
1
, (, ). (1)
kCS,i= MA(i,j)´fCS(qi,qj)
j=1
NN
å
, (2)where i [i,1,...,i,NASD] represents the activity state of node i, and NASD≥1 the dimension of that
activity state (in many natural, engineering, or social-ecological systems, nodes have multi-dimensional
activity state); fCS £ fCS(qi,qj)£ fCS is called the "consilience function", determining how the states of
nodes i and j will affect the overall performance if the nodes are connected, and fCS and fCS are the
lower and upper bounds, respectively. In Eq. (2), MA(i,j) represents the network topology, and
) ,
( i j
CS
f introduces the node activities, which are the focus of this study.
In the real world, individual nodes may act differently, but their activities need to serve the same
systemic goal. Through the network topology, nodes interact with each other. When a specific systemic
goal is concerned, the differences in the activities will mean that if some nodes are connected, they may
interact well, whilst some others will conflict with each other if connected. In general, the node activity
state and the consilience function in Eq.(2) can effectively describe such real world situations. For
example, if the similarity in node activities helps performance, then we can define fCS(qi,qj)= fCS
when θi=θj, while if complementarity between node activities is desirable, then we may have
fCS(qi,qj)= fCS when |ij |T, where T is a problem-specific threshold.
The definition of node activity state is often highly problem-dependent. Many factors, such as signal
synchronization, compatibility of facilities, complementarity or similarity of expertise, willingness of
collaboration, social opinion, personal attitude and cultural (dis)similarity usually may be used in the
definition. The consilience function fCS(i,j) may also be of any form depending on the nature of the
system concerned. The definition of node activity state and the design of fCS(i,j) will play a crucial
role in applying CSD to study real-world network systems, and some metadata methods (e.g., Eom and
Jo, 2014; Peel et al. 2017) may provide inspiration.
In this study, for the sake of simplicity, we assume fCS(
q
i,q
j)=cos(q
i-q
j), which gives1 ) , (
1
any pair of connected nodes in the system, CSD becomes exactly CND, i.e., kCS,i kCN,i. From Eq. (1)
and Eq. (2), one may conclude that CSD is an extension of CND, while CND is just a special case of
CSD. Therefore, CSD is a more general, more fundamental network property than CND. Basically, if a
node connects to other nodes that have states more compatible to its own, then the node has a higher
CSD, which may indicate that it has a better capability to integrate available resources in the system.
Such a capability is fundamentally important to the system if it is to achieve a certain systemic goal, but
traditional network properties, such as CND, synchronization, clustering coefficient and robustness, can
barely capture or measure it (Hu et al., 2014; Hu et al., 2017). In real-world network systems, there is
often a "being together – but better not" situation (e.g., the Network System 2 in Fig.1). CND studies
only the first part, the "being together", while CSD completes the picture by disclosing the second part
"but better not".
In the example of Fig.1, despite the fact that the two systems have exactly the same network topology
and human resources, Network System 1, by organizing itself according to the similarity in expertise of
its members, is likely to achieve a better performance than Network System 2. CND based network
theories largely fail to quantify or distinguish the capability of the two network systems to serve a
specific systemic goal, because the CND based network properties of the two systems are exactly the
same, e.g., they have the same average connection degree (ACND). However, if one brings the
functional expertise of the members of the network system into play, which can be measured in terms of
differences in knowledge, skills and style between different experts (see the subplot on the right-hand
side in Fig.1), the average consilience degree (ACSD) calculated based on differences in expertise can
capture and describe the overall performance difference of the two network systems. Thanks to the
concept of CSD, one can quantitatively tell that Network System 1 in Fig.1 will perform better because
it has a larger ACSD. The calculations of ACND and ACSD are as following.
kCN = 1
NN
kCN,i
i=1
NN
å
, (3)kCS = 1
NN i=1kCS,i
NN
When compared with other concepts specifically proposed to study the integration of network
topology and node activity states, for example, assortativity mixing, dyadic effect, metadata, and link
weight, the CSD concept also exhibits some potential.
Basically, dyadic effect and assortativity mixing both describe to what extent the setup of a link is
influenced by the similarity in certain attributes of those two nodes that are connected by the link. In the
study of dyadic effect, the node attribute in question is assumed to be binary-valued (Cinelli et al., 2017;
Park and Barabási, 2007). In the study of assortativity mixing, the value of node attribute could be a
more complicated discrete or scalar quantity. For example, if we define an assortativity coefficient based
on CND (i.e., a node is more likely to connect to another node which has a similar CND to its own), then
the node attribute may have any value within a discrete set {0,1,2,…,NN-1} (Newman, 2003; Newman,
2010; Noldus and Van Mieghem, 2015).
In the study of CSD, a node attribute is called a node activity state, which may have a
multi-dimensional, continuous value. The simulation results of Hu et al. (2017) clearly show that even
though two network systems may have the similar assortativity coefficients, they may have rather
different system consilience levels, which means that CSD may bring extra information. The form of
node activity state in CSD is similar to the vector data used in metadata studies. However, the concept of
metadata itself focuses on node attributes, and it needs to be combined with some topology-oriented
methods, in order to (like dyadic effect and assortativity mixing) study the correspondence, relationship,
dependency and/or correlation between node attributes and network structure (Eom and Jo, 2014; Peel et
al. 2017). In contrast, CSD is a concept directly integrating network topology and node attributes, and its
main aim is to assess overall system performance, which is a level above studying the relationship
between node attributes and network structure.
In effect, the concept of CSD may be viewed as similar to link weight. For example, if we replace the
consilience function fCS(i,j) with an equivalent link weight wi.j, we will get exactly the same
computational result. However, the form of wi.j could intuitively make people think link that weight is an
attribute of link, having nothing to do with node activity states (Albert and Barabási, 2002; Boccaletti et al.,
2006). In other words, link weight is largely a topology-oriented concept. Actually, the connecting effect
transmitting efficiency (such as when the link is a road, a railway or a flightpath), and the states of two
nodes may be supportive or conflictive. Once a link is set up between the two nodes, the actual connecting
effect (measured by link weight) is a combinational result of link transmission efficiency and similarity in
node activity states, but the form of a single wi.j cannot convey such a combination. Fortunately, an
extended form of CSD in Hu et al (2017) can clearly tell which factors may contribute to the actual
connecting effect, and to what extent.
As reported in Hu et al., 2014 and 2017, the concept of CSD, by developing many new CSD-based
network properties and models, can facilitate a new theoretical framework for the study of complex
network systems. As demonstrated by the simulation results in Hu et al., 2014 and 2017, such network
properties and models are rather different from traditional CND-based network properties and models,
and they open a new window to deepen our understanding of many real-world complex systems, such as
social-ecological systems. For instance, a society that has a consensus of wills and practices a
coordination of activities between individuals for the sake of disaster prevention, mitigation and relief is
often observed to be less vulnerable to disasters, and a CSD-based simulation study quantitatively
echoes such a real-life observation (Shi, et al. 2014).
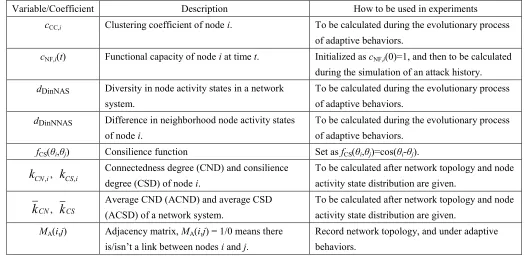
Before progressing to the next sections, we present the major variables and coefficients used in this
[image:9.612.42.567.475.732.2]study in Table 1 so that readers may review any of them easily whenever they wish.
Table 1. A list of major variables and coefficients used in this study.
Variable/Coefficient Description How to be used in experiments
cCC,i Clustering coefficient of node i. To be calculated during the evolutionary process
of adaptive behaviors.
cNF,i(t) Functional capacity of node i at time t. Initialized as cNF,i(0)=1, and then to be calculated
during the simulation of an attack history.
dDinNAS Diversity in node activity states in a network
system.
To be calculated during the evolutionary process of adaptive behaviors.
dDinNNAS Difference in neighborhood node activity states
of node i.
To be calculated during the evolutionary process of adaptive behaviors.
fCS(θi,θj) Consilience function Set as fCS(θi,θj)=cos(θi-θj).
kCN,i, kCS,i
Connectedness degree (CND) and consilience degree (CSD) of node i.
To be calculated after network topology and node activity state distribution are given.
kCN, kCS
Average CND (ACND) and average CSD (ACSD) of a network system.
To be calculated after network topology and node activity state distribution are given.
MA(i,j) Adjacency matrix, MA(i,j) = 1/0 means there
is/isn’t a link between nodes i and j.
NN, NE Numbers of nodes and links in a network system. Set as NN=100, NE=400.
NSN,i(t), NDN,i(t) Numbers of supportive, disturbing neighboring
nodes of node i at time t.
To be updated during the evolutionary process of adaptive behaviors.
PCAS, PRWL Percentages of nodes randomly chosen to change
activity states, and to rewire links, respectively, at each simulated time instant.
PCAS=2% & PRWL=0%, PCAS=0% & PRWL=2%,
and PCAS=1% & PRWL=1% in three different
experiments.
PSR,i(t), PFO,i(t) Probabilities of applying the selfish rule, the
following-others rule to node i at time t, given node i is chosen to conduct an adaptive behavior.
To be calculated during the evolutionary process of adaptive behaviors.
Sθ The speed of adjusting state. Sθ=0.2. TSP How many simulation time units in a simulation
period of evolutionary process.
TSP=50000, except for Fig.6, where TSP=1000.
α(i) Selfish coefficient of node i. α(i)=0.3 except for Fig.6, where α(i)=0, 0.05,…,1.
αR Recovering ratio. αR=0.1.
θi Activity state of node i. Within [0 2π], change under adaptive behaviors.
ΩSN,i(t), ΩDN,i(t) Sets of supportive, disturbing neighboring nodes
of node i at time t (simulated time in this study).
To be updated during the evolutionary process of adaptive behaviors.
3. Adaptive behaviors and system consilience
As discussed in Section 1, there is a fundamental question about the concept of consilience degree
(CSD): Is CSD necessary or useful to study real-world network systems? To shed a little more light on
this question, in this section, we will investigate the relationship between the concept of CSD and two
adaptive behaviors which are well acknowledged in real-world systems.
3.1 Modeling adaptive behaviors
In many natural and social-ecological systems, individuals, i.e., network system nodes, usually keep
changing their activity states and links according to two common rules: the selfish rule and the
following-others rule (Ball, 2012). It is well known that individuals in a society usually pursue the
maximization of their own benefits/profits is the result of the selfish rule (Axelrod, 1997; Wexler, 2006),
and the herd effect widely observed in both human and animal systems can be explained with the
following-others rule (Granovetter, 1978; Hirshleifer and Teoh, 2003). Under the selfish rule, a node is
more likely to change its activity state according to the states of supportive neighboring nodes, and it is
also more likely to rewire a link from a disturbing neighboring node to a supportive node. Under the
disturbing set. The node is more likely to change its activity state according to the set which has more
nodes, and the node is also more likely to rewire a link from the smaller set to a node which is connected
to the larger set but currently not connected to the node.
Suppose at time instant t=0, we have an initial network system without consilience design, and
therefore the system consilience level is low. First, we give a mathematic description of node adaptive
behavior under the selfish rule. Assume at simulation time instant t≥0, node i has NSN,i(t)>0 supportive
neighboring nodes, and node i is changing its activity state θi(t) under the selfish rule. Then, at the next
time instant t+1, the activity state of node i will become
( )) ) ( ) ( ( ) ( ) 1 ( , ) ( , t t N t s t t i i SN t j j i i i SN
, (5)where Sθ is the speed of changing activity state, and ΩSN,i(t) represents the set of all supportive
neighboring nodes of node i at time t. Eq.(5) means that node i will adjust its activity state towards the
mean value of all activity states of set ΩSN,i(t).
Fig.2(a) gives an example of changing node activity state under the selfish rule. In Fig.2, the
similarity in node colors represents the similarity in node activity states, red (resp. blue) links represent
positive (rep. negative) effects between nodes because of their similar (resp. different) activity states,
and we assume node 1 currently needs to adjust its activity state or links. In Fig.2(a), since neighboring
nodes 2 and 3 are supportive to node 1 (they all have similar warm colors), under the selfish rule, node 1
changes its activity state to become even more similar to those of nodes 2 and 3, and as the result, the
CSD of node 1 is increased.
Assume at time t, node i has NDN,i(t) disturbing neighboring nodes, which compose a set ΩDN,i(t). If
NSN,i(t)>0, NDN,i(t)>0 and node i needs to rewire its links under the selfish rule at time instant t, then it
will randomly disconnect from a node in set ΩDN,i(t) (assume node j is chosen), and then rewires the link
to a supportive node which is linked to set ΩSN,i(t) but not to node i at time instant t (assume node k is
chosen). At next time t+1 after rewiring the link,
} { ) ( ) 1 ( ,
,i t SNi t k
SN
, NSN,i(t1) NSN,i(t)1, (6)
} { ) ( ) 1 ( ,
,i t DNi t j
DN
Fig.2(b) is an example of rewiring links under the selfish rule. Node 1 first disconnects a link from
node 5, as they have conflictive activity states with each other. Then, node 1 rewires the link to node 4,
which is a supportive neighbor of node 1’s supportive neighboring nodes. This gives node 1 a good
chance to improve its CSD.
Now, we mathematically describe how to change the activity state of node i under the
following-others rule. Based on θi(t), the activity state of node i at time t+1 will become
) ( ) ( )), ( ) ( ) ( ( ) ( ) ( ) ( )), ( ) ( ) ( ( ) ( ) 1 ( , , , ) ( , , , ) ( , , t N t N t t N t s t t N t N t t N t s t t i SN i DN i i DN t j j i i DN i SN i i SN t j j i i i DN i SN . (8)
Eq.(8) shows that node i will change its activity state to follow the majority of its neighboring nodes,
even if they currently have disturbing activity states to node i.
Fig.2(c) gives an example of changing node activity state under the following-others rule. Since most
neighboring nodes of node 1 have cold colors, under the following-others rule, node 1 changes its
activity state from warm color to cold color. This enables node 1 to get more supportive effects from its
neighboring nodes, which causes the CSD of node 1 to increase.
Now, we explain how to rewire a link of node i under the following-others rule. If NSN,i(t)≥NDN,i(t)>0,
then node i will rewire its links in the same way as under the selfish rule according to Eq.(6) and Eq.(7).
If 0<NSN,i(t)<NDN,i(t), then node i will randomly disconnect from a node in set ΩSN,i(t) (assume node j is
chosen), and then rewires the link to a node which is supportively linked to set ΩDN,i(t) but not to node i
at time t (assume node k is chosen). At next time t+1 after rewiring the link,
} { ) ( ) 1 ( ,
,i t DNi t k
DN
, NDN,i(t1) NDN,i(t)1, (9)
} { ) ( ) 1 ( ,
,i t SNi t j
SN
, NSN,i(t1) NSN,i(t)1. (10)
Fig.2(d) is an example of rewiring links under the following-others rule. In this case, node 1 has just
1 supportive neighbor, i.e. node 2, but 3 disturbing neighbors, i.e., nodes 3, 5 and 6. So, under the
following-others rule, node 1 disconnects from node 2, and rewires the link to node 4, which is a
node 1 temporarily decrease, but if it gets a chance to change its activity state under the selfish rule in
future, its CSD will rise dramatically.
Fig.2. Examples of adaptive behaviors under the selfish rule and the following-others rule
(Similarity in node colors represents the similarity in node activity states; red (resp. blue) links represents positive (resp. negative) effects between nodes because of their similar (resp. different) activity states).
Based on the above adaptive behaviors defined by Eq.(5) to Eq.(10), we can start an evolutionary
process to evolve an initial network system. At each time instant of the evolutionary process, PCAS
percent of all NN nodes will be randomly picked out to change their activity states, and PRWL percent to
rewire their links. Assuming node i is chosen to evolve at time t, then the probabilities of applying the
selfish rule and the following-others rule are calculated as follows, respectively
) ( ) ( ) ( )) ( 1 ( ) ( ) ( , , , , t N t N t N i i t P i DN i SN i SN i
SR , (11)
) ( 1
)
( ,
, t P t
PFOi SRi , (12)
where 0(i)1 is a coefficient which determines how likely node i is to employ the selfish rule.
It should be noted that this paper aims to study the relationship between adaptive behaviors and
system consilience, so the adaptive behaviors above are defined to be of a well-established form. In
other words, we do not aim to introduce new adaptive behavior models, or to compare with any existing
adaptive behavior models. Actually, in future extensions and applications of this study, a comparison (a) Change node activity state under the selfish rule (c) Change node activity state under the following-others rule
between the adaptive behaviors defined above and some other relevant models is certainly worth
investigating. For example, on the one hand, the selfish rule of Eq.(5) to Eq.(7) has something in
common with the basic premise of Axelrod (1997) , which states that the more similar an actor is to a
neighbor, the more likely it is that the actor will adopt one of the neighbor’s traits. On the other hand, the
culture evolution model of Axelrod (1997) is based on grid networks, while this study mainly focuses on
small-world networks. In a grid network, the influence of an actor often needs to pass through many
intermediate nodes to reach a spatially distant nodes, while in a small-world network, the influence of a
node can spread much faster by passing through only a few intermediate nodes to reach any node in the
system (Watts and Strogatz, 1998). Taking another example, the following-others rule of Eq.(8) to
Eq.(10) is similar to the threshold model of Granovetter (1978), in particular, the selfish coefficient α(i)
plays a role similar to a threshold in partially determining whether a node will employ the selfish rule or
the following-others rule. However, the threshold model of Granovetter (1978) used a two-valued node
attribute, while this study allows node activity state to vary continuously between 0 and 2π. It should be
pointed out that the models of Axelrod (1997) and Granovetter (1978) have a closer focus on certain
real-world applications. Therefore, comparing with and learning from such models may largely improve
the application potential of this study, which will form the basis of extending this study in future
research.
3.2 Simulation results
In this simulation, three trials were initially conducted. In the first of these, only node activity states
changed according to the selfish and following-others rules. In the second one, only links between nodes
changed according to the selfish and following-others rules. In the third test, both node activity states
and links between nodes changed according to the selfish and following-others rules.
In each trial, the same initial network system with NN=100 nodes and NE=400 links was used. In the
initial system, node activity states were distributed randomly within the range of [0 2π], and links were
randomly set up between nodes according to the rule reported in Watts and Strogatz (1998). As a result,
the ACSD of the initial system was almost 0. Then, the initial system started to evolve based on adaptive
sake of simplicity, we set (i)0.3 for all nodes, unless specified. At the final time instant t=50000,
we inspected the evolved network system, and compared it with the initial network system. We also
recorded how the ACSD value, the clustering coefficient (CC) value, the diversity in node activity states
(DinNAS), and the difference in neighborhood node activity states (DinNNAS) changed during the
evolutionary period; the ACSD value was calculated according to Eq.(4).
Clustering coefficient describes how tense a node and its neighbors are connected to each other by
links (Albert and Barabási, 2002; Boccaletti, et al., 2006), and for node i, the CC value is usually
calculated as
cCC,i = 2nE,i
kCN,i(kCN,i-1), (13)
where
n
E,i is the number of all links existing in the cluster, which is composed of node i and all its kCN,ineighbors.
The diversity in node activity states (DinNAS) is assessed as following. The range of [0 2π] is evenly
divided into NSS=100 subsets. Then, we check the activity states of all the NN=100 nodes in the network
system at a given time instant, to see how many subsets have covered at least one node. Assume the
activity states of all the NN=100 nodes are distributed in 1≤NSS≤100 subsets. Then, the DinNAS is
measured by SS SS DinNAS N n
d . (14)
Based on Eq.(14), a larger value of dDinNAS implies a better diversity in node activity states.
The difference in neighborhood node activity states (DinNNAS) is assessed as following. First, we
measure the DinNNAS for each individual node, say, for node i, we have
CNi
k j i NS i i DinNNAS j d , 1 ,
, ( ), (15)
where θNS,i(j) is the activity state of the jth node in the neighborhood set of node i, and the neighborhood
set of node i has kCN,i neighbors connected to node i. Then, the average DinNNAS is calculated as
NN
i
i DinNNAS N
DinNNAS N d
d
1
,
1
The results of three trials are given in Fig.3 to fig.5, respectively. In each figure, the left-top subplot
(a) is the initial network system at time instant t=0, the right-top subplot (b) is the final evolved network
system at time instant t=50000, the left-bottom subplot (c) gives the ACSD and DinNNAS curves, and
the right-bottom subplot (d) gives the CC and DinNAS curves. When plotting a network system, we plot
nodes with positive CSD values as triangles, while nodes with negative CSD values as circles. The color
of a node is determined by the activity state of the node. Basically, the similarity in node colors indicates
the similarity in node activity states. We also use different colors to indicate positive or negative effect
of a link. If a link between two nodes has a negative (resp. positive) effect due to the dis/similarity in the
activity states of these two nodes, we plot the link in blue (resp. red). The deeper the blue (resp. red)
color the stronger the negative (resp. positive) effect of the link.
Fig.3. Only changing node activity states can improve the system consilience of a network system
(Trisl parameter setup: NN=100, NE=400, TSP=50000, α(i)=0.3, PCAS=2% and PRWL=0%).
(a). Initial system at time t=0
(ACSD=-0.73; CC=0.31; DinNAS=0.63; DinNNAS=2.20)
(b). Final evolved system at time t=50000
(ACSD=7.43; CC=0.31; DinNAS=0.25; DinNNAS=0.36)
(c). ACSD curve and DinNNAS curve (d). CC curve and DinNAS curve
Simulation time t Simulation time t
ACSD DinNNAS
From Fig.3, one can observe: (i) allowing node activity states to change according to adaptive
behaviors can significantly improve the system consilience level (in this case, the ACSD increases from
-0.73 to 7.43); (ii) because of adaptive behaviors, the diversity in node activity states (DinNAS) drops
dramatically, which means at the end of evolutionary process, most nodes have similar activity states;
(iii) during the co-evolutionary process, the difference in neighborhood node activity states (DinNNAS)
decreases gradually, which is the reason why the ACSD increases; (iv), since no links are allowed to
rewire, the network topology remains unchanged, and therefore, the CC remains the same.
Fig.4. Only changing links between nodes can improve the system consilience of a network system
(Trial parameter setup: NN=100, NE=400, TSP=50000, α(i)=0.3, PCAS=0% and PRWL=2%).
According to the definition of CSD in Eq.(2), when the consilience funtion is set as
fCS(
q
i,q
j)=cos(q
i-q
j) as in this simulation, a system network with all nodes having the same activity(a). Initial system at time t=0
(ACSD=-0.73; CC=0.31; DinNAS=0.63; DinNNAS=2.20)
(b). Final evolved system at time t=50000
(ACSD=6.45; CC=0.56; DinNAS=0.63; DinNNAS=1.36)
(c). ACSD curve and DinNNAS curve (d). CC curve and DinNAS curve
Simulation time t Simulation time t
ACSD DinNNAS
state (i.e., no diversity at all) will have the potential maximal ACSD (here this value is eight). However,
diversity is common and important to many natural and man-made systems. Then, can system
consilience still be improved without sacrificing the diversity in node activity states?
Fortunately, this is possible if adaptive behaviors only change links between nodes. Fig.4 gives a test
example where only links between nodes can change under the selfish rule and the following-others rule.
From Fig.4, one can see: (i) only changing links between nodes under adaptive behaviors can still
improve the system consilience level (in this case, the ACSD increases from -0.73 to 6.45), because the
simulated adaptive behaviors re-group nodes according to the similarity in node activity states; (ii) as
node activity states are not allowed to change, the DinNAS remains the same during the evolutionary
process, which is a good news to a system pursuing diversity among individuals; (iii) since link rewiring
under adaptive behaviors makes a node more likely to be connected to those nodes with similar activity
states, the DinNNAS decreases over time; (iv) the CC goes up from 0.31 to 0.56, and this is mainly
because the connections within a cluster with similar node activity states have been largely enhanced
during the evolutionary process; (v) when compared with Fig.3, the ACSD, DinNNAS and CC curves
soon reach certain stable levels, and this probably implies that, for a given, unchangeable diversity in
node activity states, there might be an upper bound for the achievable ACSD.
Fig.4 clearly demonstrates that adaptive behaviors can improve system consilience without changing
the diversity in node activity states. From Fig.3 and Fig.4, it seems that allowing diversity in node
activity states to decrease may lead to a better system consilience. Suppose that both system consilience
and the diversity in node activity states are desirable. Then, can adaptive behaviors achieve a good
balance between system consilience and the diversity in node activity states? Fig.5 gives a test example
where the initial network system is exactly the same as that in Fig.3 and Fig.4, but both the diversity in
node activity states and links between nodes can change under the selfish rule and the following-others
Fig.5. Allowing both the diversity in node activity states and links between nodes to change can improve the system consilience of a network system
(Test parameter setup: NN=100, NE=400, TSP=50000, α(i)=0.3, PCAS=1% and PRWL=1%).
When compared with Fig.3, one can see that the diversity in node activity states is less changed in
Fig.5, i.e., the DinNAS drops from 0.63 to 0.25 in Fig.3, while to just 0.48 in Fig.5. When compared
with Fig.4, one can see that system consilience is largely improved in Fig.5, i.e., the ACSD increases
from -0.73 to 6.45 in Fig.4, while this is 7.64 in Fig.5. Actually, by the end of evolutionary process, the
ACSD in Fig.5 is even larger than that in Fig.3. This implies that allowing both the diversity in node
activity states and links between nodes to change is more effective in a sense of Pareto optimality (Barr,
2004; Hu et al., 2013) than only changing the diversity in node activity states, because both system
consilience and diversity levels are higher in Fig.5 than in Fig.3. (a). Initial system at time t=0
(ACSD=-0.73; CC=0.31; DinNAS=0.63; DinNNAS=2.20)
(b). Final evolved system at time t=50000
(ACSD=7.64; CC=0.54; DinNAS=0.48; DinNNAS=0.30)
(c). ACSD curve and DinNNAS curve (d). CC curve and DinNAS curve
Simulation time t Simulation time t
ACSD DinNNAS
Alpha(i)
0 0.2 0.4 0.6 0.8 1 -0.5
0 0.5 1 1.5 2 2.5
ACSD(t) ACSD(0) DinNNAS(t) DinNNAS(0)
A l p h a ( i )
0 0.2 0.4 0.6 0.8 1 0.3
0.35 0.4 0.45 0.5 0.55 0.6 0.65
CC(t) CC(0) DinNAS(t) DinNAS(0)
Fig.6. The influence of α(i) on ACSD, CC, DinNAS and DinNNAS of the final evolved network system (Test parameter setup: NN=100, NE=400, TSP=1000, α(i)=0,0.05,…,1, PCAS=1% and PRWL=1%).
We further conducted an experiment to test how the value of parameter α(i) influences ACSD, CC,
DinNAS and DinNNAS of the final evolved network system during a period of TSP=1000 simulated time
units. It should be noted that in Fig.3 to Fig.5, the initial network system evolved for a period of
TSP=50000 simulated time units but here we only allowed 1000 simulated time units for system
evolution. This is mainly because if the evolutionary period is too long, then a small value and a large
value for α(i) can both eventually lead to similar ACSD, CC, DinNAS and DinNNAS. We set
α(i)=0,0.05,…,1. We applied each α(i) value to 100 randomly generated initial network systems and then
obtained the average final ACSD, CC, DinNAS and DinNNAS of the 100 evolved systems at time
t=1000. We plot how the average final ACSD, CC, DinNAS and DinNNAS change as α(i) increases
from 0 to 1 in Fig.6, from which one can see that no matter what the value of α(i), the system consilience
level will always be improved under adaptive behaviors when compared with the associated initial
consilience level. Here we do not draw any conclusion such as which value of α(i) is the best, because (i)
the main goal of this study is just to demonstrate that adaptive behaviors can improve system consilience
level, and (ii) all experiments here are based on abstract network systems rather than real-world ones. A
discussion about the best value of α(i) does not make much realistic sense here, and it would be better to
optimize such a parameter value in future real-world case studies. For the same two reasons, here we do
not go further with other experimental parameters, in order to avoid distracting readers’ attention from
To summarize, from Fig.3 to Fig.6, one can see clearly that the simulated adaptive behaviors under
the selfish rule and the following-others rule can improve the consilience level of a network system, no
matter whether diversity in node activity states is allowed to change, or if links between nodes are
allowed to rewire. Since the selfish rule and the following-others rule are very common in many
real-world network systems, one can image that the consilience level of such real-world network
systems should be reasonably high (at least significantly greater than zero) due to adaptive behaviors.
Given the generality of such behaviors in reality, we therefore argue that CSD is an inherent attribute
rather than an artificial concept, which underpins the fundamental importance of CSD to the study of
real-world complex network systems such as social-ecological systems, that is to say that concept of
CSD in Eq.(2) can provide an effective mathematical method to describe and study the consilience level
of real-world network systems.
4. System consilience and system performance against disturbances
One may wonder: Why might a network system need a high consilience level? This is apparently a
fundamentally important question for the study of adaptive behaviors and the concept of CSD. In this
section, we attempt to explore a possible reason: system performance against external disturbances (e.g.,
natural disasters, terrorism attacks, and environmental changes). Actually, the concept of CSD was
initially motivated by some practices and observations in disaster reduction and risk management, e.g.,
consensus of wills and coordination of activities often make a community more robust (or less
vulnerable) to natural or man-made disasters (Shi et al. 2014).
4.1 Setup of anti-attack investigation
Here, we conducted a simulation trial to study the relationships between system performance against
disturbances, system consilience and adaptive behaviors. In this test, we compared three network
systems in terms of performance against disturbances. Each of these three network systems had NN=100
nodes and NE=400 links, and therefore, each network system had the same average CND (ACND) of 8.
The first network system, i.e., system (a) in Fig.7, was generated by the highly-acknowledged model
of Watts and Strogatz (1999), which has a wide range of representations in the real world and can well
purely based on CND, and the diversity in node activity states is not taken into account at all when
setting up a link between nodes. Therefore, the resulting network systems usually have an average CSD
(ACSD) around 0. For example, system (a) in Fig.7 had randomly diversified node activity states, which
however were not considered when the network topology was developed. As a result, system (a) had an
ACSD of -0.75.
The second network system, i.e., system (b) in Fig.7, was developed based on the adaptive behavior
model as described in Section 3. System (a) in Fig.7 was used as the initial network system. Then, node
activity states and links of system (a) changed, or evolved according to the selfish rule and the
following-others rule as given in Section 3. This was actually a co-evolutionary process, because each
node constantly changed its activity state and links by referring to its neighboring nodes. Such a
co-evolutionary process went on for 1000 simulation time units. At the end of this evolutionary period,
we obtained system (b). As has been proven in Section 3, the simulated adaptive behaviors can improve
the level of system consilience, i.e., system (b) had an ACSD of 1.94, which was much higher than the
ACSD of the initial system, i.e., system (a).
Given that the maximum theoretical ACND value is clearly 8 for a system with an ACND of 8, we
wanted to develop a network system with an ACSD as close to the maximum possible to better
understand the influence of system consilience on system performance against disturbances. To this end,
we used the global CSD optimization model reported in Hu et al (2017). First, we removed all of the NE
links in system (a), and kept node activity states untouched. Then, we re-set NE links one by one
between nodes as follows. Each time when re-setting a link, we put the link between such a pair of nodes
that would make the current ACSD maximal. In this way, we obtained system (c), which had an ACSD
of 5.61, the closest to the maximal value of 8. As shown in Fig.7, system (c) had exactly the same
diversity in node activity states as that of system (a), but different link distribution, or topology. This is
likened to that organizing the same group of people in different way could result in rather different
group performance. It should be noted that, compared with system (a), system (b) not only had a
different link distribution but also different diversity in node activity states because of those adaptive
behaviors in the model of Section 3.
Now, we exposed systems (a), (b) and (c) to the same series of external disturbances (random attack
simulation time instant was t=0, all nodes had a functional capacity of 1, denoted as cNF,i(0)=1 for node i
at time t=0. Then, at each simulation time instant 0<t≤10000, an attack event occurred, which randomly
picked up 1% to 10% of the nodes and reduced their functional capacity to 0, i.e., if node i was under
attack at time t, then, its functional capacity immediately became cNF,i(t)=0. During the simulation
process, if a node at time instant t, say node i, had functional capacity cNF,i(t)<1, then, at the next time
instant t+1, its functional capacity may recover to some extent as following cNF,i(t+1)=min(1, max(0,cNF,i(t)+aR´(cNF,i(t)
+ cNF,j(t)´MA(i,j)´fCS(qi,qj))
j=1
NN
å
) , (17)where 0<
a
R is recovering ratio. In this test, we seta
R=0.1, and the consilience function was again setas fCS(i,j)cos(ij).
According to Eq.(17), we can see that the recovery of functional capacity at a node with cNF,i(t)<1
largely depends on supports from its neighboring nodes. Even if all of its neighboring nodes have the
maximal functional capacity, i.e., cNF,j(t)=1, but if they are conflictive with node i in terms of node
activity states, then they will not contribute to the recovery of node i, and instead, they will disrupt and
even jeopardize the recovery that node. In other words, if without such conflictive neighboring nodes,
node i might recover gradually based on its own remaining functional capacity cNF,i(t), given 0<cNF,i(t)<1,
with conflictive neighboring nodes, the functional capacity of node i might never recover. Clearly, the
CSD concept as defined in Section 2 can be used to well assess such supportive and conflictive
situations. Basically, if a network system has a larger ACSD, then according to Eq.(17), its nodes will
recover more quickly on average under attacks. The recovery behavior defined by Eq.(17) is highly
consistent with common sense in daily life. For example, practices in disaster mitigation and relief often
witness that whether people are supporting or looting each other largely determines community recovery
performance after disasters (Shi et al., 2014).
We wish to point out that the recovery behavior defined by Eq.(17) is a dynamical process, because
functional capacities of neighboring nodes may change from time to time. For example, suppose node i
with cNF,i(t)<1 has some supportive neighboring nodes as well as some conflictive neighboring nodes. At
will remain unchanged at time t+1. Then, assuming at time t+1, a few conflictive neighboring nodes are
turned down by the random attack of time t+1, as a result, those supportive neighboring nodes will
overwhelm the remaining conflictive neighboring nodes, and therefore, the functional capacity of node i
will increase at time t+2. Then, assuming the random attack at time t+2 hits some supportive
neighboring nodes and makes the balance shift to those conflictive neighboring nodes, the functional
capacity of node i will decrease at time t+3.
During the random attack history of 10000 simulation time units, at each time instant 0≤t≤10000,
we checked the average node functional capacity (ANFC) in each of the 3 network systems, and we also
counted the number of all non-functional nodes (ANFN) in each of the 3 network systems. In Fig.7, we
plot ANFC and ANFN curves over the random attack history of 10000 simulation time units, in order to
study how systems (a), (b) and (c) perform against attacks. Basically, if a network system can maintain a
high level of ANFC and a low level of ANFN during the random attack history, then we can say the
system has a good performance against attacks.
4.2 Results and discussions of anti-attack experiment
The results of the anti-attack investigation are given in Fig.7. From those ANFC and ANFN curves in
Fig.7, one may have the following observations.
System (a), which does not consider node activity states and therefore has no consilience design,
has the poorest performance against attacks. Actually, in system (a), the number of nodes with a
negative CSD value (such nodes are plotted as circles) is about 50, a half of NN=100 nodes, and
based on the recovering behavior defined in Eq.(17), most of such nodes, once hit by an attack,
will never recover but simply remain with cNF,i(t)=0. For the other half of NN=100 nodes, they
have positive CSD values, which means they can get effective supports from their neighboring
nodes, and therefore, their functional capacities can usually recover over time more or less from
attacks. For these nodes with positive CSD values, they have cNF,i(t)>0 at most time. This
explains why system (a) has the ANFN curve stabilized at a value about 48. Although the
average number of functional nodes is about 52 over time, there are often some nodes in the
recovering process and having cNF,i(t)<1. Therefore, system (a) has the ANFC curve stabilized at
The co-evolutionary dynamics based on those adaptive behaviors of Section 2 gives system (b) a
positive ACSD of 1.94. However, it should be noted that in system (b), there are still some nodes
which have negative CSD values. For such nodes, they are very likely to stay with cNF,i(t)=0 once
they are hit by attacks. Apparently, as shown by the topology of system (b) in Fig.7, the number
of nodes with negative CSD values is much smaller than that of system (a). Therefore, system (b)
has the ANFN curve stabilized at a value about 28, 43% smaller than that of system (a). At the
same time, system (b) has the ANFC curve stabilized at a value about 60%, 44% larger than that
of system (a).
Fig.7. Comparison between anti-attack performances of three network systems with different ACSD values (Investigation parameter setup: NN=100, NE=400, and αR=0.1).
In system (c), based on the global optimization model of Hu et al (2017), every link is carefully
set up in order to maximize ACSD. As the result, all nodes in system (c) have positive CSD
much larger than the ACSD of system (b), let alone the ACSD of system (a). Under the same
attack history, system (c) has the ANFN curve maintained at a value about 1, and the ANFC
curve stabilized at a value around 95%. In other words, those attacks have almost no impact on
the performance of system (c), because almost all nodes are functioning well with cNF,i(t)≈1 on
average all time.
Now, we come back to the fundamental question about CSD: Why might a network system need
a high consilience level? In other words, the fact that adaptive behaviors can
naturally/automatically improve the consilience level of a network system must be for certain
purposes. The results from systems (a), (b) and (c) in Fig.7 might give us a clue about one of
such purposes, i.e., a higher level of system consilience implies a better system performance
against attacks. As is well known, system robustness against attacks is often a top systemic goal,
which makes some sense of CSD.
One might argue that adaptive behaviors, although they widely exist in many natural and
man-made network systems, do not lead to the highest consilience level in Fig.7. Does this mean
consilience is not so really important in real world? The highest consilience level in Fig.7 is
achieved by the global optimization model of Hu et al (2017), which basically demands a central
governor having all necessary global information and absolute power to decide on every local
detail of network design. However, having such a central governor is often an ideal situation, too
good to be true. Unfortunately, in most natural and man-made network systems of real world,
there is no such a central governor. Actually, in the real world, such a central governor is often
not desirable, because many natural and man-made network systems are of multi-agent or
multi-stakeholder, which means each node has self-governing power and usually does not want
to be governed by others. In many natural systems, having such a central governor is often not
practicable, either, because it is very difficult, if not impossible, for a natural system to collect all
necessary global information. In fact, most natural systems, if not all, are driven and run by
decentralized, local-information-based, multi-agent-based self-organizing mechanisms, such as
those adaptive behaviors defined in Section 3. Surprisingly but quite reasonably, although
without any powerful central governor, nature still finds its way to achieve a high level of system
order to, for example, deal with external disturbances effectively. In other words, based on the
multi-agent-based, self-organizing feature, nature has evolved adaptive behaviors to achieve a
high level of system consilience. When compared with a central governor strategy, such adaptive
behaviors might not be ideal from the viewpoint of achieving the highest level of system
consilience, but they are the most suitable to the multi-agent-based, self-organizing feature of
natural systems.
It should be emphasized that another reason for why adaptive behaviors do not give a very high
level of system consilience in Fig.7 is because system (b) evolves from system (a) through just
1000 simulation time units. In Section 3, we allowed an initial system to evolve over 50000
simulation time units, which led to a very high level of system consilience. In the experiment of
this section, we deliberately restrict system (a) to evolve for only 1000 simulation time units, for
two reasons: (i) we want to show the influence of different levels of system consilience, and (ii)
in reality, external environment usually changes constantly and rapidly, and there could not be
much or enough time for a network system to evolve and become fully fit to the external
environment of a specific time instant.
We would also like to point out that, although system (c) has a better anti-attack performance
than system (b) in Fig.7, it does not mean the adaptive behavior model is less useful than the
global optimization model. There are many natural systems as well as many decentralized
social-ecological systems (such as market-driven economic systems) where there lacks an
explicit/strong central governing body, and individuals compete with each other largely based on
local/limited information. The adaptive behavior model reported in Section 3 is much more
useful to study these real-world network systems. Of course, advances in modern scientific
technologies, such as information communication technologies, enable many social systems to be
aware and then to make use of global information for making decisions/policies. Therefore, the
results of Fig.7 might imply that, if a social system with a central governing body could make
and implement proper top-down central policies/strategies for all individuals in the system, then
it could make most of the diversity in individuals and achieve a better performance than in a
natural, decentralized, self-organizing situation. How to modify and improve the adaptive
systems are driven by adaptive behaviors. How to make a proper top-down policy/strategy for a
centralized system is also a great application area for consilience theory.
5. Conclusions
This paper reports a simulation study on the adaptive behaviors based on the selfish rule and the
following-others rule. The simulation results show that, because of such adaptive behaviors, a network
system will automatically evolve to a high level of average consilience degree. Since selfish and
following-others behaviors are common in both natural and man-made systems, we conclude that system
consilience is an inherent, fundamental property of real-world complex network systems. The simulation
study also demonstrates that a high level of system consilience, as a result of adaptive behaviors, will
contribute to a better system performance against external disturbances. Therefore, the concept of
consilience degree may help with the understanding of complex phenomena in many real-world network
systems.
This paper takes a specific and tightly defined goal to just demonstrate the relationship between
adaptive behaviors and system consilience, and does not pursue many other issues in depth. For example,
regarding why a network system might need a high consilience level, besides anti-attack performance as
discussed in the paper, there could be some other reasons, such as cost-efficiency and sustainability of
system, which are all worth further investigation. More efforts can also be made to conduct
comprehensive investigations, in order to test the influence and learn the role of those model parameters
by changing their values over a wide range. It will be interesting to design trials to compare system
consilience with some other relevant concepts, e.g., link weight, metadata and assortativity coefficient,
so that by comparing how they will change/evolve under adaptive behaviors, we may gain a deeper
understanding concerning the merits and demerits of system consilience. Besides the selfish rule and the
following-others rule, attention may be paid to include more other relevant adaptive behaviors, such as
the majority rules in culture evolution models (Axelrod, 1997) and threshold models (Granovetter, 1978).
In particular, future research needs to put a focus on applications of theoretical consilience concept in
various real-world, natural and man-made network systems, and in such applications, more knowledge is
expected to be obtained regarding how to define node activity state and how to design consilience