warwick.ac.uk/lib-publications
Manuscript version: Author’s Accepted Manuscript
The version presented in WRAP is the author’s accepted manuscript and may differ from the
published version or Version of Record.
Persistent WRAP URL:
http://wrap.warwick.ac.uk/117155
How to cite:
Please refer to published version for the most recent bibliographic citation information.
If a published version is known of, the repository item page linked to above, will contain
details on accessing it.
Copyright and reuse:
The Warwick Research Archive Portal (WRAP) makes this work by researchers of the
University of Warwick available open access under the following conditions.
Copyright © and all moral rights to the version of the paper presented here belong to the
individual author(s) and/or other copyright owners. To the extent reasonable and
practicable the material made available in WRAP has been checked for eligibility before
being made available.
Copies of full items can be used for personal research or study, educational, or not-for-profit
purposes without prior permission or charge. Provided that the authors, title and full
bibliographic details are credited, a hyperlink and/or URL is given for the original metadata
page and the content is not changed in any way.
Publisher’s statement:
Please refer to the repository item page, publisher’s statement section, for further
information.
Mosaic-Based Color-Transform Optimization
for Lossy and Lossy-to-Lossless Compression
of Pathology Whole-Slide Images
Miguel Hern´andez-Cabronero
∗, Victor Sanchez,
Member, IEEE
, Ian Blanes,
Senior Member, IEEE
,
Francesc Aul´ı-Llin`as,
Senior Member, IEEE
, Michael W. Marcellin,
Fellow, IEEE
,
and Joan Serra-Sagrist`a,
Senior Member, IEEE
.
Abstract—The use of whole-slide images (WSIs) in pathology entails stringent storage and transmission requirements because of their huge dimensions. Therefore, image compression is an essential tool to enable efficient access to these data. In particular, color transforms are needed to exploit the very high degree of inter-component correlation and obtain competitive compression performance. Even though state-of-the-art color transforms re-move some redundancy, they disregard important details of the compression algorithm applied after the transform. Therefore, their coding performance is not optimal. We propose an optimiza-tion method called Mosaic Optimizaoptimiza-tion for designing irreversible and reversible color transforms simultaneously optimized for any given WSI and the subsequent compression algorithm. Mosaic Optimization is designed to attain reasonable computational complexity and enable continuous scanner operation. Exhaustive experimental results indicate that, for JPEG 2000 at identical compression ratios, the optimized transforms yield images more similar to the original than other state-of-the-art transforms. Specifically, irreversible optimized transforms outperform the Karhunen-Lo`eve Transform (KLT) in terms of PSNR (up to 1.1 dB), the HDR-VDP-2 visual distortion metric (up to 3.8 dB) and accuracy of computer-aided nuclei detection tasks (F1 score up to 0.04 higher). Additionally, reversible optimized transforms achieve PSNR, HDR-VDP-2 and nuclei detection accuracy gains of up to 0.9 dB, 7.1 dB and 0.025, respectively, when compared to the reversible color transform (RCT) in a lossy-to-lossless compression regime.
Index Terms—Color-Transform Optimization, Whole-Slide Im-ages, Image Compression.
I. INTRODUCTION
In the traditional pathology workflow, pathologists examine specimens under an optical microscope to detect biological structures relevant to the diagnosis. In virtual pathology, tra-ditional glass slides are being replaced by digital whole-slide images(WSIs). WSIs allow concurrent examination of a case by several pathologists, possibly in different geographical lo-cations, to reduce medical errors [1]. Remote diagnosis can be
This work has been funded by the EU Marie Curie CIG Programme under Grant PIMCO, the Engineering and Physical Sciences Research Council (EPSRC), UK, and by the Spanish Ministry of Economy and Competitiveness and the European Regional Development Fund under Grant TIN2015-71126-R (MINECO/FEDETIN2015-71126-R, UE) and by the Catalan Government under grant 2014SGR-691.
∗M. Hern´andez-Cabronero is with the University of Warwick and the
University of Arizona, USA (email: [email protected]). V. Sanchez is with the University of Warwick, UK. M. W. Marcellin is with the University of Arizona, USA. F. Aul´ı-Llin`as, I. Blanes and J. Serra-Sagrist`a are with the Universitat Aut`onoma de Barcelona, Spain.
life-critical in isolated, impoverished or otherwise underserved regions where experts are not available. Moreover, virtual pathology can increase pathologist availability [2] and reduce costs in pathology laboratories [3]. Recently, computer-aided diagnosis (CAD) algorithms are being developed [4]–[12] to assist the pathologists in the diagnosis, especially in tedious and error-prone tasks. WSIs can also enhance performance to help pathologists detect and classify clinical markers, and to create annotated databases for training, research and reference purposes [13].
An important difficulty when dealing with WSIs is their huge size. A15×15mm specimen scanned at 40× magnifica-tion requires a60000×60000, 24-bit RGB color image, result-ing in over 10 GB of raw data. Even at a lower, more common 0.5µmresolution, images attain sizes of 30000×30000and 2.5 GB of uncompressed data [1], [14].
Furthermore, multiple WSIs –sometimes exceeding 35 [15]– are commonly produced per case. Thus, hundreds of Terabytes are produced yearly by a single WSI scanner [15], [16]. These massive data volumes hinder the adoption of virtual pathol-ogy. Excessive bandwidth demands can handicap the remote visualization of WSIs, while stringent storage necessities – including archiving and backup systems– can diminish the cost-effectiveness of digital pathology workflows. In such a scenario, image compression is paramount to alleviate these storage and transmission problems.
Lossless coding provides perfect reconstruction of the data produced by the WSI scanner. To the best of our knowledge, only one work has proposed a lossless compression algorithm specific for these images. In [17], Hight Efficiency Video Coding (HEVC) [18] intra coding mode is adapted to the multidirectional patterns that are typically present in these images. In particular, sample-by-sample differential pulse-code modulation is combined with uniform angular modes to improve prediction across strong edges. However, perfect reconstruction comes at the cost of relatively low compression ratios, commonly between 2:1 and 4:1, which may not suffice for interactive and remote WSI visualization purposes.
yield statistically indistinguishable diagnostic results from those obtained using traditional glass slides [20]–[22], and do not affect the pathologists’ confidence on the diagnosis [23]. Average compression ratios of approximately 13:1 produce images that pathologists deem indiscernible from the original WSIs [24]. Compression ratios up to 200:1 can hinder human-made diagnoses [21], but not some carcinoma-detection CAD algorithms [23]. Traditional JPEG [25] has also been shown to produce reconstructed images that can be employed for diag-nosis [26]. Produced results are on par with the ones obtained using glass slides [27], [28], although exact compression ratios for JPEG have not been reported. An accurate rate-allocation method specific for WSIs has also been proposed [29] for lossy regimes with HEVC. In most commercial WSI scanners, standard JPEG 2000 or JPEG compression is employed [14]. Color transforms improve compression by removing inter-component redundancy [30]. Due to the especially strong sim-ilarities among color components in WSIs, applying adequate transforms can greatly improve compression performance. WSI-specific color transforms are scarce [31], [32], although other transforms can also be applied to exploit inter-component similarities. In HEVC, fixed color-space translations can be applied to the prediction residuals using the Adaptive Color Transform [33]. JPEG 2000 Part 1 supports the irreversible color transform (ICT) and the reversible color transform (RCT) to decorrelate color components [19]. Arbitrary linear transforms can be used in Part 2 of the standard [34]. In commercial WSI scanners [14] and WSI compression works in the literature [20]–[24], the ICT is the most common color transform. The Karhunen-Lo`eve Transform (KLT) typically produces highly competitive compression results, which nor-mally improve upon the ICT. For Gaussian sources, the KLT is known to provide perfect color component decorrelation. Notwithstanding, WSIs do not follow a Gaussian distribution. Moreover, the KLT does not take into account the details of the compression algorithm applied after the transform. Hence, its compression performance is not optimal either. The Optimal Spectral Transform algorithm (OST [35]) produces linear transforms that minimize the mutual information among color components considered as random variables. Mutual information of two random random variablesX andY can be expressed as I(X;Y) =H(X)−H(X|Y), where H(·) de-notes the marginal entropy andH(·|·)the conditional entropy. Therefore, lower mutual information implies less redundant information inX andY, which often improves compression performance. The OST considers the spatial wavelet transform and the quantization of JPEG 2000, but does not consider other important aspects of JPEG 2000 such as its entropy coder. Therefore, its actual compression performance is also subop-timal. Color deconvolution methods are successfully applied in CAD algorithms for WSIs [36]–[38]. These methods separate image colors by using so-called deconvolution matrices, which can be considered color transforms as well. However, these transforms are not designed for compression and do not yield competitive coding performance in practice.
This work introduces a fast mosaic-based optimization method for designing color transforms that overcomes the inherent drawbacks of the approaches described above. In what
follows, this method is referred to as Mosaic Optimization. For any input image, Mosaic Optimization produces a color transform that is optimized simultaneously for the image and for the compression algorithm applied after the transform. As a result, the produced transform attains compression perfor-mance results that improve upon the state of the art.
To allow reasonable computational complexity, the pro-posed Mosaic Optimization employs a novel mosaic-based sampling technique. Representative blocks of the image are first extracted using a fast heuristic, and then an optimization process is applied to a mosaic of the extracted blocks. Mosaic Optimization builds upon theFull Optimizationmethod, orig-inally presented in [31]. Even though both methods produce transforms that yield very similar compression performance, Full Optimization has a prohibitive computational complexity, i.e., exceeding 2 hours per image on average–, which makes it unusable in practical scenarios. The proposed Mosaic Opti-mization method enables execution times close to 2.4 minutes on the workstation used for research, i.e., 54 times faster than Full Optimization and comparable to the time it takes to scan the WSIs [14], [27]. This allows continuous pipelining of the scanning and the compression of WSIs using reasonable computing power and requiring additional storage space for only one scanned image. Mosaic Optimization also builds upon theSingle Patch Optimizationmethod introduced in [32]. Although both exhibit similar computational complexity, Mo-saic Optimization yields better compression performance than Single Patch Optimization, as discussed later in Section IV. We also propose an extension to design optimized reversible color transforms that can be used for lossless and progressive lossy-to-lossless compression. This can be useful in scenarios where the original data must be stored losslessly, e.g., due to legal restrictions, and bandwidth-efficient lossy representations are necessary, e.g., for remote visualization of the WSIs.
Exhaustive experimental results are provided to evaluate the color transforms produced with Mosaic Optimization when applied to WSIs depicting different tissue types. The PSNR– based on the mean squared error–, the HDR-VDP-2 [39] met-ric –calibrated to emulate a human observer– and the accuracy of a CAD nuclei detection algorithm [10] are employed for this purpose. Results indicate that the Mosaic Optimization produces irreversible transforms that outperform the ICT and the KLT in terms of PSNR, HDR-VDP-2 and nuclei detection performance. The optimized reversible transforms improve upon the RCT with respect to the PSNR, HDR-VDP-2 and CAD metrics in lossy-to-lossless regime, i.e., when only part of a losslessly compressed image is used for reconstruction. Both the optimized transforms and the RCT produce very similar bitrates in lossless compression regimes.
To recap, we propose a color transform optimization method based on [31]. The main novelties of this work are an original mosaic-based method to reduce computational complexity that outperforms the one described in [32], an extension of [31] to allow progressive lossy-to-lossless compression, and an exhaustive performance analysis that extends those of [31], [32] with more test images, new tissue types and comparison with more color transform design algorithms.
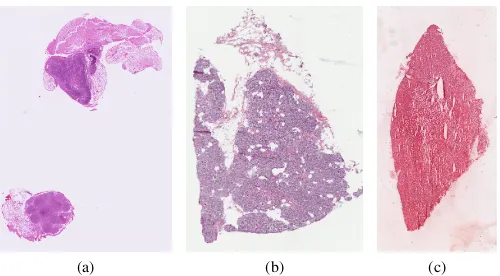
(a) (b) (c)
Fig. 1: Sample WSIs depicting (a) lymphatic tissue; (b) pancreatic tissue; (c) renal tissue.
describes key properties of WSIs that motivate the use of color transformations for compression. Section III describes the proposed color-transform optimization framework, including the mosaic-based approach. Section IV provides extensive experimental results and Section V concludes the paper.
II. WHOLE-SLIDEIMAGES ANDCOLORTRANSFORMS
A key step to generate WSIs is to stain the biological sample to highlight structures relevant to the diagnostic task at hand. The most commonly employed stain for many types of WSIs is Hematoxylin and Eosin (H&E) [40], which exposes cell nuclei and cytoplasm. The stained slide is then inserted in a special scanner with objective lenses for magnification, which registers a color image depicting the complete glass slide. This takes less than 3 minutes per slide [14], [27].
Optical magnification factors of 20×, 40× or even
100×[1], [10], [27] are necessary to provide a microscope-like viewing experience. These magnification factors correspond to resolutions of 0.5 µm, 0.25 µm and 0.1 µm per pixel, respectively, and are often used with numerical aperture (NA) of 0.75 [14]. A comprehensive description of the hardware and methods employed to scan WSIs is available in [14]. As a result of the high magnification levels, the 24-bit RGB WSIs output by the scanners have very high spatial resolutions, which motivates compression, but also limits the complexity of the algorithms that can be used under reasonable time and memory constraints.
Due to the staining process, each image exhibits a limited range of color gamut. H&E-stained images typically contain violet, blue and red hues only, as can be seen in Fig. 1. Therefore, WSIs exhibit inter-component redundancy signif-icantly higher than regular photographic imagery. Table I shows average values of these key characteristics for 50 WSIs considered in this work. In order to provide meaningful discussion for all types of WSI, a total of 16 types of tissue are hereinafter considered. The average inter-component correlation for these images exceeds 0.95, whereas for the ISO-12640-1 [41] and ISO-12640-2 [42] sets of natural images the average correlation is 0.81 and 0.66, respectively.
Due to the high inter-component correlation present in WSIs, employing adequate color transforms is crucial to
ob-tain competitive compression performance. Traditional static transforms such as YCbCr [19] and YIQ [43] translate each
RGB pixel into a different color space using a fixed 3×3
matrix M = (mi,j):
u
v w
=
m1,1 m1,2 m1,3
m2,1 m2,2 m2,3 m3,1 m3,2 m3,3
r g b
, (1)
where (u, v, w) represents the pixel in the new color space and mi,j are real-valued entries. Typical transforms are not
designed for the particular characteristics of WSIs. Thus, they fail to properly decorrelate color components, which in turn may negatively affect compression.
Data-dependent approaches adapt the coefficients of the transform matrix M to the image to be compressed. For instance, the well-known Karhunen-Lo`eve Transform (KLT) removes any inter-component correlation in the transformed image components. Other methods based on independent component analysis such as the Optimal Spectral Transform (OST) [35] minimize the mutual information. In Strutz’s work [44], an adaptive transform is implemented by choosing an optimal mode based on the entropy of the image trans-formed with that mode. Another reversible transform was proposed by Kim et al., which applies an additional lifting step to decorrelate the U and V components produced by the ICT [45]. These data-dependent approaches yield significant compression performance gains as compared to non-adaptive methods. Although data-dependent methods in the literature are designed to optimize criteria such as inter-component cor-relation or mutual information, they neglect important aspects of the coding algorithm employed after the color transform. For example, the KLT does not take into account any spatial decorrelation –e.g., a 2D discrete wavelet transform (DWT)– that may be applied after the color transformation, and neither the KLT nor the OST consider the probability model used to drive the entropy coder. Hence, existing data-dependent color transforms do not attain optimal compression performance either.
III. COLORTRANSFORMOPTIMIZATION
This section describes a color transform optimization algo-rithm that attains higher compression efficiency for WSIs than the KLT and other state-of-the-art component transforms. Sec-tion III-A describes a numerical transform-optimizaSec-tion frame-work and Section III-B describes the Mosaic Optimization algorithm, which is a fast approximation to this framework. An extension of Mosaic Optimization that allows progressive lossy-to-lossless transmission is introduced in Section III-C.
A. Optimization Framework
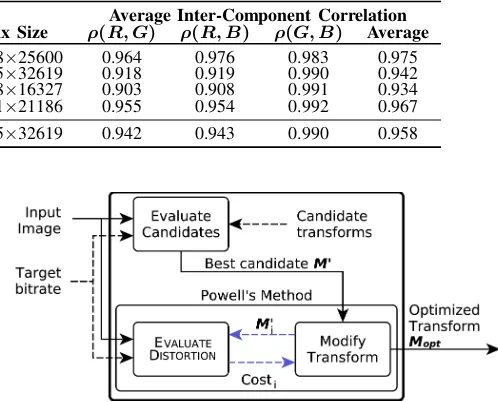
TABLE I: Properties of 50 H&E-stained WSIs considered in this work.
[image:5.595.53.312.69.260.2]Set #Images #Tissue Dimensions Average Inter-Component Correlation Types Min Size Max Size ρ(R, G) ρ(R, B) ρ(G, B) Average Lymphatic 6 1 12288×17408 17408×25600 0.964 0.976 0.983 0.975 Pancreatic 10 1 12470×12938 31655×32619 0.918 0.919 0.990 0.942 Renal 7 1 9352×8139 34018×16327 0.903 0.908 0.991 0.934 Mixed 27 13 34018×16327 32001×21186 0.955 0.954 0.992 0.967 All images 50 16 9352×8139 31655×32619 0.942 0.943 0.990 0.958
Fig. 2: Diagram of the EVALUATEDISTORTIONcost function.
sources for the KLT, which may not hold in practice and therefore lead to suboptimal performance [46]. Contrarily, the proposed framework is conceived to optimize compression performance directly. Given an input imageI, our framework aims at finding a transform matrixM that minimizes the cost function EVALUATEDISTORTION,
M = argmin
M0
{EVALUATEDISTORTION(M0, I)}. (2)
This function appraises a color transform M0 by comparing I with the reconstructed image obtained after compression and decompression with M0. This scheme is depicted in Fig. 2. Note that, for each I, the same bitrate R must be used for compression in EVALUATEDISTORTIONfor all color transforms M0 so that their relative performance can be compared. A single M that works well for a wide range of R can be obtained by using R=RICT(I)/2, where RICT(I)
is the compression rate attained for I by lossy JPEG 2000 using Kakadu v7.8 [47] with its default parameters with the irreversible color transform, without limiting the target bitrate. The value of R for each test image considered in this work is available as supplementary content at http://ieeexplore.ieee. org.
By construction, the resulting transformM is not only opti-mized forI, but also for the compression algorithm employed in the cost function. As discussed in Section I, JPEG 2000 has been successfully employed for compression of WSIs. Part 2 of the standard provides the syntax for user-defined color transforms [34]. Therefore, JPEG 2000 is considered exclusively hereafter. Nevertheless, any other compression algorithm that admits arbitrary linear color transforms could also be used within this framework.
Any distortion metric can be used to compare the input and the reconstructed images in Fig. 2. In this work, the mean squared error (MSE) is employed due to its low computational complexity. As discussed later in Section IV, optimizing for MSE ultimately improves results for the HDR-VDP-2 metric and for the accuracy of CAD nuclei detection tasks.
Fig. 3: Diagram of the TRANSOPT transform optimization framework.
Deriving an analytical expression for (2) is not practical for coding systems such as JPEG 2000. This is due to the complex non-linear nature of reversible transforms, spatial decorrelation transforms, quantizers, entropy coders and rate-allocation algorithms. Therefore, unlike for the KLT or the OST, which assume simpler models, closed-form solutions cannot be easily obtained for (2).
To produce competitive transforms, we employ our previ-ously proposed iterative numerical optimization framework, TRANSOPT[31], summarized in Fig. 3. In the Evaluate Candi-dates box, several candidate transform matrices are compared using the EVALUATEDISTORTION cost function described above. Here, the identity transform (i.e., not applying any color transform), the KLT, the YCbCr and the YIQ (a rotation of
YCbCr) transforms are employed as candidates. Only the best
of these, i.e., the one that yields the smallest cost for the input image, is further considered. This transform, denoted “Best candidate M0” in Fig. 3, undergoes iterative optimization based on Powell’s conjugate direction algorithm [48]. In the i-th iteration of this algorithm, the coefficients of M0 are modified using a conjugate gradient method to produce Mi0, to which EVALUATEDISTORTION is applied to obtain Costi.
Powell’s algorithm employsMj0 and Costj,j≤i, to generate Mi+10 . This process, depicted with blue dashed arrows in the figure, is repeatedNitertimes. The output optimized transform Mopt is then defined as theMi0 with the smallest associated
Costiamong all iterations. No improvements are observed for Niter >250.
B. Mosaic Optimization
[image:5.595.299.548.70.271.2]Fig. 4: Diagram of the mosaic-based fast approximation to TRANSOPT.
Algorithm 1 Mosaic-based generation of a smaller image.
1: functionGENERATEMOSAIC(inputImage,blockSize,ϕ)
2: gridBlocks←CREATEGRID(inputImage,blockSize)
3: for allgridBlocksasblockdo
4: block.colors←COUNTDIFFERENTCOLORS(block)
5: end for
6: sortedBlocks←SORTBYCOLORS(gridBlocks)
7: candidateBlocks←sortedBlocks[|sortedBlocks| ·ϕ:
8: |sortedBlocks|]
9: selectedBlocks←UNIFORMSAMPLE(candidateBlocks)
10: mosaicImage←COMBINECELLS(selectedBlocks)
11: returnmosaicImage 12: end function
averaged for the 50 images referenced in Table I, as discussed later in Section IV. A fast mosaic-based approximation to Full Optimization, denoted Mosaic Optimization, is proposed next. Over 95% of the run time of TRANSOPT is spent in the EVALUATEDISTORTIONfunction in compression, decompres-sion and comparison tasks. To accelerate the execution, a small version S of the input image is generated first, and then the optimization framework is applied toS, as depicted in Fig. 4. It is important to generate a representative version of the full-size image so that the resulting color-transform MS yields
good coding performance for the original image. The proposed method for generating S, referred to as GENERATEMOSAIC, is provided in Algorithm 1. The image is first divided in a rectangular grid with blocks of size blockSize×blockSize (line 2). Some of the blocks are then selected to build the mosaic image as follows. The number of different pixel colors is computed for each grid block (lines 3–5). Here, a color is defined as the 3D vector (r, g, b), and two colors (r, g, b)
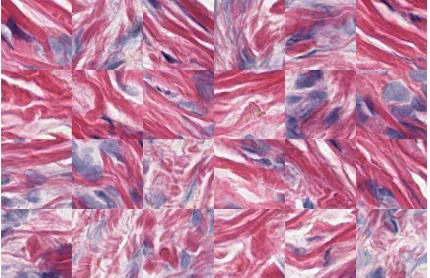
[image:6.595.47.284.57.108.2]and(r0, g0, b0) are considered identical if and only if r=r0, g = g0 and b = b0. Blocks that contain very few different colors typically depict portions of the background, which is normally bright and homogeneous, as can be observed in Fig. 1. Conversely, blocks with many different colors tend to depict stained tissue and be more representative of the relevant parts of the image. Consistent with this, grid blocks are sorted by the number of colors (line 6) and only the top fraction ϕ is kept as candidate blocks for the mosaic (line 7), whereϕ is a real parameter in (0,1). Finally, blocks are selected with uniform probability from the list of candidates until the total number of pixels reaches a certain target value (line 9). For this work, random uniform sampling is used. The resulting mosaic image is then created by concatenating the selected blocks (line 10), as depicted in Fig. 5. Note that by using adequate values ofϕ, blocks depicting only background regions, which carry no useful information for the optimization process, are rarely included in the mosaic images.
Fig. 5: Crop of a mosaic image produced with Algorithm 1.
When the produced mosaic image is used in the EVALUATEDISTORTION function, the JPEG 2000 compressor is invoked with tiles of size blockSize, so that the 2D spatial wavelet transform is never performed across the (ar-tificial) block boundaries. Additionally, identical bit budgets are assigned to each mosaic block to avoid individual blocks dominating the rate allocation and the cost function. Since the selected blocks are chosen in a spatially uniform way, the mosaic image is representative of all regions depicting stained tissue. Moreover, the probability of a given biological structure appearing in a block is comparable to the fraction of tissue area depicting this structure. Therefore, this mosaic-based approach produces color transforms MS optimized to
produce good overall performance across the original WSI. This is in contrast with the fast method presented in [32], where the small image version contains pixels from a single area of the image.
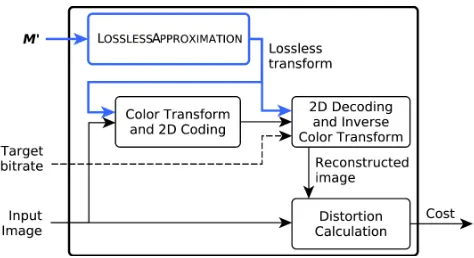
Fig. 6: Diagram of REVERSIBLEEVALUATEDISTORTION.
C. Progressive Lossy-to-Lossless Optimization
The optimized color-transform matrices produced by Mo-saic Optimization have real-valued entries. They are irre-versible and cannot be directly employed for efficient lossless or progressive lossy-to-lossless compression of WSIs. In some situations it is desirable or even necessary to retain the original image data without loss, e.g., due to archiving policies or legal constraints. Mosaic Optimization can be extended to produce optimized, reversible integer-to-integer color transforms. WSIs can be losslessly compressed with these transforms, achieving compression ratios similar to other state-of-the-art lossless coding algorithms. The losslessly compressed image files can be transmitted partially or progressively, yielding rate-distortion results that improve upon the state of the art.
The proposed extension of the TRANSOPT framework to
lossless and lossy-to-lossless scenarios is based on the work by Galli et al. [49]. In that work, transform matrices are factorized as a product of permutation matrices and triangular elementary reversible matrices (TERMs), similar to a well-known lower-upper LU matrix decomposition [50], where TERMs are defined as triangular matrices containing only ±1 in the diagonal. The resulting factorization is equivalent to a reversible integer-to-integer transform that approximates the original lossy transform [49]. In [51], another algorithm for producing reversible transform based on the matrix fac-torization proposed in [50] is described. Both [49] and [51] produce accurate approximations. Galli’s method is employed exclusively hereafter, and referred to as LOSSLESSAPPROX.
The EVALUATEDISTORTION function is modified to as-sess the compression performance of the reversible ap-proximation of M0 in each iteration of the design pro-cedure. The resulting evaluation function, denoted by REVERSIBLEEVALUATEDISTORTIONand depicted in Fig. 6, substitutes EVALUATEDISTORTION in TRANSOPT.
IV. EXPERIMENTALRESULTS
A. Materials and Methods
To evaluate the performance of the proposed framework, we use 50 H&E images from the Cancer Genome Atlas (TCGA [52]) data portal. Images were selected to depict 16 different tissue types and a broad range of hues so that results can be representative of WSIs in general. The Mosaic Opti-mization method and its lossy-to-lossless extension are applied
to each image to generate optimized irreversible and reversible transforms, respectively. The obtained transform matrices are available as supplementary content at http://ieeexplore.ieee. org. The Kakadu v7.8 implementation of JPEG 2000 Part 2 is employed for compression and decompression [47]. In all cases, Niter= 250. Our evaluations shown thatblockSize=
128 and ϕ = 0.5 produce the best overall results, hence only these parameters are hereinafter considered. To evaluate complexity, total execution times have been measured on a dedicated workstation with a 4-core i5-4570 CPU at 3.2 GHz and 16 GB of RAM. All reported time results are relative to this platform.
Section IV-B compares Mosaic Optimization to the identity transform (i.e., no color transform), the ICT, the KLT, the OST [35], the YCoCg [53], the color transforms proposed by Strutz et al. [44] and Kim et al. [45], the Full Opti-mization method described in Section III-A, and the Single Patch Optimization method introduced in [32]. The 50 images summarized in Table I are compressed and reconstructed using each color transform at 15 bitrates ranging from 0.04 to 1.6 bits per pixel per component (bpppc). These correspond to compression ratios from 200:1 to 5:1, typically considered in the literature [20]–[24]. Results for HEVC [18] using the Adaptive Color Transform1 are also provided for reference.
The optimized reversible transforms are compared in Section IV-C to the default reversible color transform of JPEG 2000 (RCT [19]), to the OST [35], to the YCoCg-R transform [54], to the reversible KLT (RKLT [49]) of each image, and to the Single Patch Optimization method. Images are losslessly transformed, compressed and reconstructed at 13 bitrates linearly spaced between 0.04 bpppc and 1.2 bpppc. Five of the 50 images are not included in the comparison since their lossless compression bitrate is lower than 1.2 bpppc. Reversible transforms are not compared to HEVC since it does not provide progressive lossy-to-lossless compression for single images.
Several image distortion metrics have been employed to assess the severity of the distortion introduced in WSIs [23], [24], [28], [29], [55]. In [55], the ability of several metrics to detect synthetic noise is evaluated. PSNR is employed in [29] to compare different rate-allocation algorithms for WSIs. In [24], the PSNR, the SSIM and a Visual Discrimination Model (VDM) based on the works by Daly [56] and Lubin [57] are investigated as tools to guide compression of WSIs. In [23], [28], the accuracy of CAD algorithms is employed to evaluate imaging and compression systems, respectively. Consistent with this, the coding performance of the different transforms is appraised using the PSNR, the High Dynamic Range Vi-sual Difference Predictor v2.2.1 [39] (HDR-VDP-2)2 and the effect on a recent CAD nuclei detection algorithm [10]. The HDR-VDP-2 metric extends [56] and [57] to predict visible differences between two images, and has been shown [39]
1Produced with the HM reference software v16.5, available at https://hevc.
hhi.fraunhofer.de/
2The probability map produced by the HDR-VDP-2 method is summarized
TABLE II: Average BD∗-PSNR and BD∗-HDR-VDP-2 results in dB for irreversible color transforms.
Color transform Lymphatic Pancreatic Renal Mixed All Images
PSNR VDP PSNR VDP PSNR VDP PSNR VDP PSNR VDP
No transform 42.56 19.13 51.22 38.86 48.31 32.09 47.31 27.07 47.67 29.20 YCoCg 48.33 41.15 51.57 42.06 47.71 30.53 47.82 31.47 48.63 34.93 ICT 47.85 38.72 51.26 42.37 47.01 29.43 47.31 31.38 48.14 34.22 KLT 46.89 38.01 52.38 42.65 48.96 32.45 48.49 30.82 49.14 34.30 OST 46.79 38.82 52.53 41.26 49.50 33.79 47.65 30.78 48.79 34.29 Full Optimization 48.37 42.36 52.70 43.00 49.43 33.41 49.18 31.74 49.83 35.54 Single Patch Optimization 48.02 41.64 50.74 39.69 49.54 32.85 48.56 31.14 49.07 34.37 Mosaic Optimization
blockSize= 128,ϕ= 0.5 48.33 42.82 52.63 43.92 49.27 32.52 49.02 31.77 49.70 35.65
to provide higher accuracy than other visual metrics such as SSIM, MS-SSIM [59] and mDCT-PSNR [60].
To compare the average PSNR performance of each trans-form across all tested bitrates, a modified version of Bjonte-gaard’s BD-PSNR [61] metric is defined as
BD∗-PSNR= 1
rmax−rmin
Z rmax
rmin
PSNR(r)dr. (3)
Here, PSNR(r)is the PSNR between the original and recon-structed image at rater, andrmin andrmaxare the minimum
and maximum reconstruction bitrates. This integral is numeri-cally approximated with Simpson’s rule at the aforementioned reconstruction target bitrates. To compare the HDR-VDP-2 metric across the range of tested bitrates, the BD∗ -HDR-VDP-2 metric is defined analogously. The BD∗-PSNR and BD∗ -HDR-VDP-2 metrics provide, respectively, the average PSNR and HDR-VDP-2 values in dB across the tested bitrate ranges, hence higher values correspond to smaller distortion.
To evaluate the effect of the transforms on the CAD nuclei detection algorithm described in [10], each of the 100 H&E images employed in that study is compressed and recon-structed at the same range of bitrates as described above. The CAD algorithm is then applied to the original and the reconstructed images using the most competitive irreversible and reversible transforms. The nuclei coordinates detected in the original images are used as ground truth and the performance of each transform at each bitrate is calculated using the F1 score –i.e., the harmonic mean of precision and recall/sensitivity– defined as
F1 Score= 2·T P
2·T P +F P+F N, (4)
where T P (true positives) are the nuclei detected in the original and the reconstructed image,F P (false positives) are the nuclei detected only in the reconstructed image andF N (false negatives) are the nuclei detected in the original image but not in the reconstructed image. F1 scores lie in[0,1], and higher values indicate better detection performance.
B. Irreversible Transforms
Average BD∗-PSNR and BD∗-HDR-VDP-2 results for lossy color transforms are provided in Table II for each test set
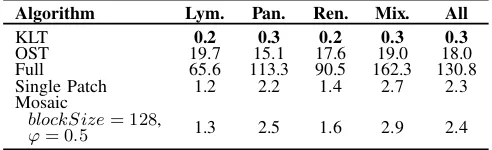
TABLE III: Average execution times in minutes for obtaining irreversible color transforms.
Algorithm Lym. Pan. Ren. Mix. All
KLT 0.2 0.3 0.2 0.3 0.3
OST 19.7 15.1 17.6 19.0 18.0
Full 65.6 113.3 90.5 162.3 130.8 Single Patch 1.2 2.2 1.4 2.7 2.3 Mosaic
blockSize= 128, 1.3 2.5 1.6 2.9 2.4
ϕ= 0.5
individually3. Consistent with [31], [32], and as expected due to the inter-component correlation described in Table I, all of the transforms (optimized or not) outperform not using any color transform. As can be observed, the ICT –commonly used in WSI scanners [14] and in the WSI compression litera-ture [20]–[24]– yields average BD∗-PSNR results 1 dB lower than the KLT, and very similar BD∗-HDR-VDP-2 results. The YCoCg transform produces similar results as the ICT, with some improvements in terms of PSNR. In turn, the optimized transforms produced by the Full, Single Patch and Mosaic modes yield average results that are more competitive than the ICT and the KLT. In particular, Full Optimization and Mosaic Optimization improve upon the ICT and the KLT for each set and for both distortion metrics. Average results for the OST are slightly lower than those of the KLT in terms of PSNR, and very similar in terms of the HDR-VDP-2 metric.
Full Optimization yields better BD∗-PSNR results than Mosaic Optimization for all test sets. This is because all image samples are available for optimization in the Full mode. Notwithstanding, Mosaic Optimization provides very similar results for each set, between 0.04 dB and 0.16 dB lower than the Full mode. In terms of BD∗-HDR-VDP-2, Mosaic Optimization exhibits gains over Full Optimization of up to 0.92 dB for the Pancreatic set, and 0.11 dB on average for all images. This can be explained by the fact that Mosaic Optimization prioritizes candidate grid blocks depicting tissue. Hence, the resulting color transforms enable more accurate reconstruction of visually relevant areas, e.g., edges between nuclei and cytoplasm.
Average PSNR and HDR-VDP-2 rate-distortion results are plotted in Figs. 7a and 7b, respectively. Results indicate that
3BD∗-PSNR and BD∗-HDR-VDP-2 results for HEVC are not included
[image:8.595.306.552.220.295.2](a) (b) (c)
[image:9.595.63.537.257.334.2]Fig. 7: Average rate-distortion comparison of irreversible transforms for all images (a) using the PSNR metric; (b) using the HDR-VDP-2 metric; (c) using the F1 score based on [10].
Fig. 8: Magnified sample crop (50×90) of imageNCI02of the Lymphatic set. (left) Original; (center) reconstructed at 0.1 bpppc using Mosaic Optimization; (right) reconstructed at 0.1 bpppc using the KLT. Areas of interest are highlighted in yellow.
TABLE IV: Average BD∗-PSNR and BD∗-HDR-VDP-2 results in dB for reversible color transforms.
Color transform PSNRLymphaticVDP PSNRPancreaticVDP PSNRRenalVDP PSNRMixedVDP PSNRAll ImagesVDP
No Transform 35.37 11.83 44.07 18.48 41.03 12.28 41.21 12.95 40.59 13.84 RCT 42.87 18.64 45.43 20.04 41.13 13.13 42.26 15.34 42.82 16.85 YCoCg-R 39.88 12.02 42.25 18.13 41.10 12.83 41.77 12.56 41.79 13.74 Strutz’s [44] 38.53 11.62 43.01 19.16 41.15 11.37 41.35 12.87 42.12 13.80 Kim’s [45] 41.56 11.82 42.12 18.61 41.38 12.72 41.70 12.65 42.51 13.79 OST 41.58 20.08 44.84 19.15 41.69 13.21 42.28 14.53 42.62 16.15 RKLT 42.06 21.19 44.84 18.71 41.35 13.04 42.43 15.62 42.72 16.64 Single Patch Optimization 42.88 22.29 45.37 20.12 41.75 13.26 42.91 15.13 43.24 17.36 Mosaic Optimization
blockSize= 128,ϕ= 0.5 43.11 25.07 45.47 21.09 41.76 13.33 42.86 15.51 43.27 17.61
PSNR gains between 0.6 dB and 1.1 dB and HDR-VDP-2 gains up to 3.8 dB over the KLT are obtained with the proposed method at the same bitrates. Therefore, at identical compressed file sizes, images reconstructed using the Mosaic Optimization method exhibit smaller distortion –e.g., fewer morphological and chromatic artifacts– than those recon-structed using the KLT, as illustrated in Fig. 8. Note that a low bitrate (0.1 bpppc) is used in Fig. 8 so that artifacts are more easily appreciable. These artifacts disappear at higher bitrates. Mosaic Optimization attains similar PSNR and HDR-VDP-2 levels –i.e., similar quality– at bitrates between 0.05 bpppc and 0.10 bpppc lower than the KLT, i.e., smaller compressed files. Thus, the transmission of images at similar quality levels can be completed faster. For instance, PSNR values of approximately 47 dB are produced on average at 0.5 bpppc for the optimized transforms and at 0.6 bpppc for the KLT, i.e., 20% data volume reduction. As can also be observed in Figs. 7a and 7b, the proposed method is better than HEVC
with the Adaptive Color Transform for the PSNR and HDR-VDP-2 metrics. This is due to the rate-allocation algorithm of HEVC not being designed for compressing only one frame. Even though this is reasonable for a video coding algorithm such as HEVC, it does affect the coding performance of WSIs, as discussed in [17], [29].
Average F1 scores for the KLT, for the ICT and for Mosaic Optimization obtained for the CAD nuclei detection algorithm described in [10] are plotted in Fig. 7c. As can be observed, all transforms produce F1 scores above 0.9 at bitrates as low as 0.4 bpppc. Mosaic Optimization produces F1 scores consistently higher than the ICT and the KLT for all tested bitrates. These results suggest that, for any compression ratio, the Mosaic Optimization method enables more accurate CAD analysis results than the ICT and the KLT.
[image:9.595.68.528.391.501.2](a) (b) (c)
Fig. 9: Average rate-distortion comparison of reversible transforms for all images (a) using the PSNR metric; (b) using the HDR-VDP-2 metric; (c) using the F1 score based on [10].
to compress an image using that transform matrix. For all tested image sets, the KLT is the fastest algorithm. However, as discussed above, its coding performance is lower than that of the optimization methods. Full Optimization has an average execution time exceeding 130 minutes, rendering it impractical for most use cases. On the other hand, Mosaic Optimization requires under 2 minutes for the Lymphatic and Renal image sets, and under 3 minutes for the Pancreatic and Mixed sets. These execution times are comparable to the scanning time of many commercial scanners, i.e., up to 3 minutes depending on the objective magnification [14], [27].
To recap, the optimized transforms produced by the pro-posed method outperform the ICT –the most usual transform in commercial scanners and in the WSI compression literature– as well as transforms such as the KLT and the OST for traditional, visual and CAD-based distortion metrics.
C. Reversible Transforms
Average BD∗-PSNR and BD∗-HDR-VDP-2 results for the reversible transforms are provided in Table IV. As can be observed, the proposed Mosaic Optimization method improves upon the RCT, the OST, Single Patch and the RKLT in almost all cases. In general, larger improvements are observed for the BD∗-HDR-VDP-2 than for the BD∗-PSNR metrics. Again, this is explained by the fact that optimization is designed to focus on visually relevant areas of the WSIs. Note that the large compression performance differences between the irreversible transforms described in Section IV-B can be explained by the different DWTs used for 2D decorrelation, i.e., the CDF 9/7 DWT for irreversible transforms and the integer-to-integer CDF 5/3 DWT for reversible ones.
As shown in Figs. 9a and 9b, significant PSNR improve-ments over the RKLT are observed for bitrates of 0.2 bpppc and higher, with gains up to 0.9 dB. HDR-VDP-2 improve-ments become significant from 0.4 bpppc onwards, with max-imum gains of 3.7 dB. Results suggest that similar distortion can be attained for smaller data volumes with the proposed method, e.g., an average PSNR of 44 dB can be obtained transmitting 14% less data.
TABLE V: Average lossless compression rates in bpppc.
Color transform Lym. Pan. Ren. Mix. All No Transform 3.41 1.98 1.96 2.07 2.14
RCT 2.44 1.90 1.98 1.97 2.00
YCoCg-R 2.36 1.87 1.99 2.02 1.99 Strutz’s [44] 2.38 1.87 1.95 2.01 1.98 Kim’s [45] 2.42 1.84 2.01 2.03 1.99
OST 2.96 2.01 1.99 2.06 2.15
RKLT 2.87 2.09 1.99 1.94 2.09
Single Patch 2.71 2.01 1.93 1.95 2.02 Mosaic
blockSize= 128, 2.69 1.96 1.87 1.92 1.99
ϕ= 0.5
Lossless compression bitrates are provided in Table V. On average for all images, all tested methods yield similar results. This indicates that the progressive lossy-to-lossless coding gains produced by the Mosaic Optimization method are not at the expense of hindering lossless compression efficiency, as compared to other works in the literature.
Average F1 scores for the RCT and for Mosaic Optimization obtained for the CAD nuclei detection algorithm described in [10] are plotted in Fig. 9c. As can be observed, both the RCT and Mosaic Optimization allow accurate CAD-based analysis of the images, with F1 scores above 0.9 for bitrates of 0.27 bpppc or higher. Identical F1 scores can be obtained at bitrates up to 0.1 bpppc lower with Mosaic Optimization than with the RCT.
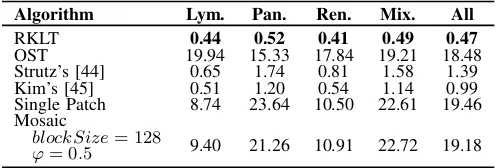
[image:10.595.310.547.296.404.2]TABLE VI: Average execution times in minutes for obtaining reversible color transforms.
Algorithm Lym. Pan. Ren. Mix. All
RKLT 0.44 0.52 0.41 0.49 0.47
OST 19.94 15.33 17.84 19.21 18.48 Strutz’s [44] 0.65 1.74 0.81 1.58 1.39 Kim’s [45] 0.51 1.20 0.54 1.14 0.99 Single Patch 8.74 23.64 10.50 22.61 19.46 Mosaic
blockSize= 128 9.40 21.26 10.91 22.72 19.18
ϕ= 0.5
V. CONCLUSIONS
WSIs can help pathologists improve their diagnostic accu-racy, reach underserved regions and enhance their productivity, thus reducing the operational costs of pathology laboratories. However, the enormous data volumes associated with WSIs make image compression necessary to enable efficient stor-age and agile remote access. In particular, lossy compres-sion can greatly reduce compressed data volumes without affecting pathologists’ diagnoses or their confidence therein. WSIs exhibit exceptionally high inter-component correlation, which can be exploited using color transforms that enhance coding performance. Color transforms in the literature are designed to minimize theoretical criteria such as correlation, but do not fully take into account all details of the coding algorithm applied after the transform. Therefore, in practice, their compression performance is suboptimal. The proposed Mosaic Optimization method is tightly integrated with the implementation of the subsequent coding algorithm and the produced color transforms improve upon the ICT, the KLT and other state-of-the-art methods in terms of mean squared error (PSNR), visual distortion metrics (HDR-VDP-2) and F1 score for a recent CAD nuclei detection algorithm. At identical rates, PSNR values up to 1.1 dB higher, HDR-VDP-2 results up to 3.8 dB higher and average F1 scores up to 0.04 higher than the KLT are obtained on average. Conversely, equal distortion levels are produced for bitrates between 0.05 bpppc and 0.17 bpppc lower, i.e., file sizes up to 20% smaller than for the KLT. An extension to design reversible transforms is proposed as well to allow lossless and progressive lossy-to-lossless compression. Without hindering lossless compression performance, the optimized transforms yield average PSNR values up to 0.9 dB higher, average HDR-VDP-2 results up to 7.1 dB higher, and average F1 scores 0.025 higher than the RCT at the same bitrates. Similar distortion levels are obtained at bitrates up to 14% lower than for the RCT. Moreover, Mosaic Optimization is designed to attain execution times comparable to that of a typical WSI scanning process. This enables continuous operation of the WSI scanner with only reasonable computational resources dedicated to compression. In summary, the proposed color-transform optimization method can produce tangible benefits for WSI-centered laboratories in practical scenarios.
ACKNOWLEDGMENTS
We thank M. Barret for kindly providing an implementation of the OST algorithm from [35], and the authors of [10]
for sharing an implementation of their CAD nuclei detection algorithm.
REFERENCES
[1] M. May, “A better lens on disease,”Scientific American, vol. 302, no. 5, pp. 74–7, May 2010.
[2] J. Ho, S. M. Ahlers, C. Stratman, O. Aridor, L. Pantanowitz, J. L. Fine, J. A. Kuzmishin, M. C. Montalto, and A. V. Parwani, “Can digital pathology result in cost savings? A financial projection for digital pathology implementation at a large integrated health care organization,”
Journal of Pathology Informatics, vol. 5, no. 33, 2014.
[3] M. Isaacs, J. K. Lennerz, S. Yates, W. Clermont, J. Rossi, and J. D. Pfeifer, “Implementation of whole slide imaging in surgical pathology: A value added approach,”Journal of Pathology Informatics, vol. 2, no. 39, 2011.
[4] A. Madabhushi, “Digital pathology image analysis: opportunities and challenges,”Imaging in Medicine, vol. 1, no. 1, pp. 7–10, 2009. [5] O. Sertel, J. Kong, H. Shimada, U. V. Catalyurek, J. H. Saltz, and M. N.
Gurcan, “Computer-aided Prognosis of Neuroblastoma on Whole-slide Images: Classification of Stromal Development.” Pattern recognition, vol. 42, no. 6, pp. 1093–1103, Jun. 2009.
[6] M. D. DiFranco, G. O’Hurley, E. W. Kay, R. W. G. Watson, and P. Cunningham, “Ensemble based system for whole-slide prostate cancer probability mapping using color texture features.”Computerized Medi-cal Imaging and Graphics, vol. 35, no. 7-8, pp. 629–45, Jan. 2011. [7] S. Samsi, A. K. Krishnamurthy, and M. N. Gurcan, “An efficient
compu-tational framework for the analysis of whole slide images: Application to follicular lymphoma immunohistochemistry,”Journal of Computational Science, vol. 3, no. 5, pp. 269–279, Sep. 2012.
[8] J. Xu, L. Xiang, Q. Liu, H. Gilmore, J. Wu, J. Tang, and A. Madabhushi, “Stacked Sparse Autoencoder (SSAE) for Nuclei Detection on Breast Cancer Histopathology Images,”IEEE Trans. Med. Imag., vol. 35, no. 1, pp. 119–130, Jan. 2016.
[9] S. B. Ginsburg, G. Lee, S. Ali, and A. Madabhushi, “Feature Importance in Nonlinear Embeddings (FINE): Applications in Digital Pathology,”
IEEE Trans. Med. Imag., vol. 35, no. 1, pp. 76–88, Jan. 2016. [10] K. Sirinukunwattana, S. E. A. Raza, Y. W. Tsang, D. R. J. Snead,
I. A. Cree, and N. M. Rajpoot, “Locality Sensitive Deep Learning for Detection and Classification of Nuclei in Routine Colon Cancer Histology Images,”IEEE Trans. Med. Imag., vol. 35, no. 5, pp. 1196– 1206, May 2016.
[11] A. Vahadane, T. Peng, A. Sethi, S. Albarqouni, L. Wang, M. Baust, K. Steiger, A. M. Schlitter, I. Esposito, and N. Navab, “Structure-Preserving Color Normalization and Sparse Stain Separation for Histo-logical Images,”IEEE Trans. Med. Imag., vol. 35, no. 8, pp. 1962–1971, Aug. 2016.
[12] B. E. Bejnordi, M. Balkenhol, G. Litjens, R. Holland, P. Bult, N. Karsse-meijer, and J. A. W. M. van der Laak, “Automated Detection of DCIS in Whole-Slide H&E Stained Breast Histopathology Images,”IEEE Trans. Med. Imag., vol. 35, no. 9, pp. 2141–2150, Sep. 2016.
[13] The Digital Pathology Association. (2017) Whole Slide Imaging Repository. [Online]. Available: https://digitalpathologyassociation.org/ whole-slide-imaging-repository
[14] N. Farahani, A. Parwani, and L. Pantanowitz, “Whole slide imaging in pathology: advantages, limitations, and emerging perspectives,” Pathol-ogy and Laboratory Medicine International, vol. Volume 7, p. 23, Jun. 2015.
[15] D. R. J. Snead, Y.-W. Tsang, A. Meskiri, P. K. Kimani, R. Crossman, N. M. Rajpoot, E. Blessing, K. Chen, K. Gopalakrishnan, P. Matthews, N. Momtahan, S. Read-Jones, S. Sah, E. Simmons, B. Sinha, S. Suor-tamo, Y. Yeo, H. El Daly, and I. A. Cree, “Validation of digital pathol-ogy imaging for primary histopathological diagnosis,”Histopathology, vol. 68, no. 7, pp. 1063–1072, 2016.
[16] A. Huisman, A. Looijen, S. M. van den Brink, and P. J. van Diest, “Creation of a fully digital pathology slide archive by high-volume tissue slide scanning,”Human pathology, vol. 41, no. 5, pp. 751–757, 2010. [17] V. Sanchez, F. Aul´ı-Llin`as, J. Bartrina-Rapesta, and J. Serra-Sagrist`a,
“HEVC-based Lossless Compression of Whole Slide Pathology Images,” inIEEE Conference on Signal and Information Processing (GlobalSIP). IEEE, Dec. 2014, pp. 297–301.
[18] G. J. Sullivan, J. R. Ohm, W. J. Han, and T. Wiegand, “Overview of the High Efficiency Video Coding (HEVC) Standard,”IEEE Trans. Circuits Syst. Video Technol., vol. 22, no. 12, pp. 1649–1668, Dec. 2012. [19] D. S. Taubman and M. W. Marcellin,JPEG 2000: Image Compression
[20] T. Kalinski, R. Zw¨onitzer, S. Sel, M. Evert, T. Guenther, H. Hofmann, J. Bernarding, and A. Roessner, “Virtual 3D Microscopy Using Multi-plane Whole Slide Images in Diagnostic Pathology,”American Journal of Clinical Pathology, vol. 130, no. 2, pp. 259–264, 2008.
[21] T. Kalinski, R. Zw¨onitzer, F. Grabellus, S. Y. Sheu, S. Sel, H. Hofmann, J. Bernarding, and A. Roessner, “Lossy compression in diagnostic virtual 3-dimensional microscopy – where is the limit?” Human Pathology, vol. 40, no. 7, pp. 998–1005, 2009.
[22] T. Kalinski, R. Zw¨onitzer, F. Grabellus, S. Y. Sheu, S. Sel, H. Hofmann, and A. Roessner, “Lossless compression of JPEG2000 whole slide images is not required for diagnostic virtual microscopy,” American Journal of Clinical Pathology, vol. 136, no. 6, pp. 889–895, 2011. [23] S. Doyle, J. Monaco, A. Madabhushi, S. Lindholm, P. Ljung, L. Ladic,
J. Tomaszewski, and M. Feldman, “Evaluation of effects of JPEG2000 compression on a computer-aided detection system for prostate cancer on digitized histopathology,” in IEEE International Symposium on Biomedical Imaging: From Nano to Macro (ISBI), Apr. 2010, pp. 1313– 1316.
[24] J. P. Johnson, E. A. Krupinski, M. Yan, H. Roehrig, A. R. Graham, and R. S. Weinstein, “Using a visual discrimination model for the detection of compression artifacts in virtual pathology images,”IEEE Trans. Med. Imag., vol. 30, no. 2, pp. 306–14, Feb. 2011.
[25] JPEG Requirements and guidelines, ISO/IEC IS Std. 10 918-1, 1994. [26] A. Sharma, P. Bautista, and Y. Yagi, “Balancing image quality and
compression factor for special stains whole slide images,”Analytical Cellular Pathology, vol. 35, no. 2, pp. 101–106, 2012.
[27] D. D. Rhoads, N. F. Habib-Bein, R. S. Hariri, D. J. Hartman, S. E. Monaco, A. Lesniak, J. Duboy, M. E.-S. Salama, and L. Pantanowitz, “Comparison of the diagnostic utility of digital pathology systems for telemicrobiology,”Journal of Pathology Informatics, vol. 7, p. 10, 2016. [28] L. Barisoni, J. P. Troost, C. Nast et al., “Reproducibility of the NEPTUNE descriptor-based scoring system on whole-slide images and histologic and ultrastructural digital images,”Modern Pathology, vol. 29, no. 7, pp. 671–684, Jul. 2016.
[29] V. Sanchez, F. Auli-Llinas, R. Vanam, and J. Bartrina-Rapesta, “Rate control for lossless region of interest coding in HEVC intra-coding with applications to digital pathology images,” in IEEE International Conference on Acoustics, Speech and Signal Processing (ICASSP), Apr. 2015, pp. 1250–1254.
[30] V. Goyal, “Theoretical foundations of transform coding,”IEEE Trans. Signal Process., vol. 18, no. 5, pp. 9–21, 2001.
[31] M. Hern´andez-Cabronero, F. Aul´ı-Llin`as, V. Sanchez, and J. Serra-Sagrist`a, “Transform Optimization for the Lossy Coding of Pathology Whole-Slide Images,” inProceedings of the Data Compression Confer-ence, DCC, Mar. 2016.
[32] M. Hern´andez-Cabronero, V. Sanchez, F. Aul´ı-Llin`as, and J. Serra-Sagrist`a, “Fast MCT Optimization for the Compression of Whole-Slide Images,” inProceedings of the IEEE International Conference on Image Processing, ICIP, Sep. 2016, pp. 2370–2374.
[33] L. Zhang, J. Chen, J. Sole, M. Karczewicz, X. Xiu, and J. Z. Xu, “Adaptive Color-Space Transform for HEVC Screen Content Coding,” inProceedings of the Data Compression Conference, DCC, April 2015, pp. 233–242.
[34] JPEG 2000 image coding system: Core coding system, ISO/IEC IS Std. 15 444-2, 2004.
[35] I. P. Akam Bita, M. Barret, and D. T. Pham, “On optimal transforms in lossy compression of multicomponent images with JPEG2000,”Signal Processing, vol. 90, no. 3, pp. 759–773, 2010.
[36] A. C. Ruifrok and D. A. Johnston, “Quantification of histochemical staining by color deconvolution,”Analytical and quantitative cytology and histology, vol. 23, no. 4, pp. 291–299, 2001.
[37] M. K. K. Niazi, K. Yao, D. Zynger, S. Clinton, J. Chen, M. Koyuturk, T. LaFramboise, and M. Gurcan, “Visually meaningful histopathological features for automatic grading of prostate cancer,” IEEE Journal of Biomedical and Health Informatics, 2016, In press.
[38] M. K. K. Niazi, A. V. Parwani, and M. N. Gurcan, “Computer-assisted bladder cancer grading: α-shapes for color space decomposition,” in
SPIE Medical Imaging, 2016, pp. 979 107–1 – 979 107–8.
[39] R. Mantiuk, K. J. Kim, A. G. Rempel, and W. Heidrich, “HDR-VDP-2: a calibrated visual metric for visibility and quality predictions in
all luminance conditions,” inACM Transactions on Graphics (TOG), vol. 30, no. 4. ACM, 2011, p. 40.
[40] A. Khan, N. Rajpoot, D. Treanor, and D. Magee, “A Non-Linear Map-ping Approach to Stain Normalisation in Digital Histopathology Images using Image-Specific Colour Deconvolution,”IEEE Trans. Biomed. Eng., vol. 61, no. 6, pp. 1729–1738, 2014.
[41] Graphic technology - Prepress digital data exchange - Part 1: CMYK standard colour image data, International Standard Organization (ISO) Std. 12 640-1, 1997. [Online]. Available: http: //www.iso.org/iso/catalogue detail.htm?csnumber=40928
[42] Graphic technology - Prepress digital data exchange - Part 2: RGB en-coded standard colour image data, International Standard Organization (ISO) Std. 12 640-2, 2004.
[43] W. H. Buchsbaum,Color TV Servicing, E. Cliffs, Ed. Prentice Hall, 1975.
[44] T. Strutz, “Multiplierless reversible color transforms and their automatic selection for image data compression,”IEEE Trans. Circuits Syst. Video Technol., vol. 23, no. 7, pp. 1249–1259, Jul. 2013.
[45] S. Kim and N. I. Cho, “Hierarchical prediction and context adaptive coding for lossless color image compression,” IEEE Trans. Image Process., vol. 23, no. 1, pp. 445–449, Jan 2014.
[46] M. Effros, H. Feng, and K. Zeger, “Suboptimality of the Karhunen-Loeve transform for transform coding,”IEEE Trans. Inf. Theory, vol. 50, no. 8, pp. 1605–1619, Aug 2004.
[47] Kakadu JPEG2000 implementation, available [Online]: http://www. kakadusoftware.com, 2017.
[48] J. Nocedal and S. Wright,Numerical Optimization. Springer, 2006. [Online]. Available: https://www.springer.com/us/book/9780387303031 [49] L. Galli and S. Salzo, “Lossless hyperspectral compression using KLT,”
in IEEE International Geoscience and Remote Sensing Symposium, IGRSS, vol. 1, Sep. 2004, p. 316.
[50] P. Hao and Q. Shi, “Matrix factorizations for reversible integer map-ping,”IEEE Trans. Signal Process., vol. 49, no. 10, pp. 2314–2324, Oct. 2001.
[51] S. C. Pei and J. J. Ding, “Improved reversible integer-to-integer color transforms,” inProceedings of the IEEE International Conference on Image Processing, ICIP, Nov. 2009, pp. 473–476.
[52] “The Cancer Genome Atlas, National Cancer Institute, National Institute of Health,” Available [Online]: https://cancergenome.nih.gov/. [53] H. Malvar and G. Sullivan, “Transform, scaling & color space impact of
professional extensions,”ISO/IEC JTC1/SC29/WG11 and ITU-T SG16 Q, vol. 6, 2003.
[54] S. S. Henrique S. Malvar, Gary J. Sullivan, “Lifting-based reversible color transformations for image compression,” pp. 7073.1 – 7073.10, 2008.
[55] A. Jim´enez, G. Bueno, G. Crist´obal, O. D´eniz, D. Toomey, and C. Conway, “Image quality metrics applied to digital pathology,”SPIE Photonics Europe, vol. 9896, p. 98960S, 2016.
[56] S. Daly, Digital Images and Human Vision. MIT Press, 1993, ch. The Visible Differences Predictor: An Algorithm for the Assessment of Image Fidelity, pp. 179–206.
[57] J. Lubin,Vision Models for Target Detection and Recognition. World Scientific, 1995, vol. 2, ch. A visual discrimination model for imaging system design and evaluation, pp. 245–357.
[58] K. J. Kim, B. Kim, R. Mantiuk, T. Richter, H. Lee, H. S. Kang, J. Seo, and K. H. Lee, “A Comparison of Three Image Fidelity Metrics of Dif-ferent Computational Principles for JPEG2000 Compressed Abdomen CT Images,”IEEE Trans. Med. Imag., vol. 29, no. 8, pp. 1496–1503, Aug. 2010.
[59] Z. Wang, E. P. Simoncelli, and A. C. Bovik, “Multiscale structural similarity for image quality assessment,” in Asilomar Conference on Signals, Systems and Computers, vol. 2, Nov. 2003, pp. 1398–1402. [60] T. Richter, “On the mDCT-PSNR image quality index,” inInternational
Workshop on Quality of Multimedia Experience (QoMEx, Jul. 2009, pp. 53–58.
![Fig. 7: Average rate-distortion comparison of irreversible transforms for all images (a) using the PSNR metric; (b) using theHDR-VDP-2 metric; (c) using the F1 score based on [10].](https://thumb-us.123doks.com/thumbv2/123dok_us/9425776.446680/9.595.68.528.391.501/average-distortion-comparison-irreversible-transforms-images-metric-metric.webp)
![Fig. 9: Average rate-distortion comparison of reversible transforms for all images (a) using the PSNR metric; (b) using theHDR-VDP-2 metric; (c) using the F1 score based on [10].](https://thumb-us.123doks.com/thumbv2/123dok_us/9425776.446680/10.595.310.547.296.404/average-distortion-comparison-reversible-transforms-images-metric-metric.webp)