Abstract— The goal is to create an automatic computer control system for well-logging unit based on math modeling of the device and processing radiant excitations and measurements of characteristic X-ray radiation of atoms of the elements which are a part of rocks and ores in well.
Index Terms— well-logging unit, X-ray, computer control system, mathematical modeling.
I.INTRODUCTION
The present work approaches the topical problem of geological prospecting high-grade ore deposits. One of the effective methods of handling the problem is logging principle that consists in the following: a well is drilled (with the hole diameter of 25-35 cm) with subsequent analysis of lateral surface, i. e. ore percentage is determined throughout the well depth.
In the recent years, X-ray radiometrical logging has become mostly popular in prospecting ore deposits. In most cases, this method can locate ore minerals more precisely showing definitely their competence and concentration of industrially important elements. This logging method is based on radiant excitation and measurement of characteristic X-ray radiation of atoms of the elements which are a part of rocks and ores in well. Certain relation between atomic number of the element in question, Z, and its characteristic X-ray radiation energy have proved logging method for direct element definition
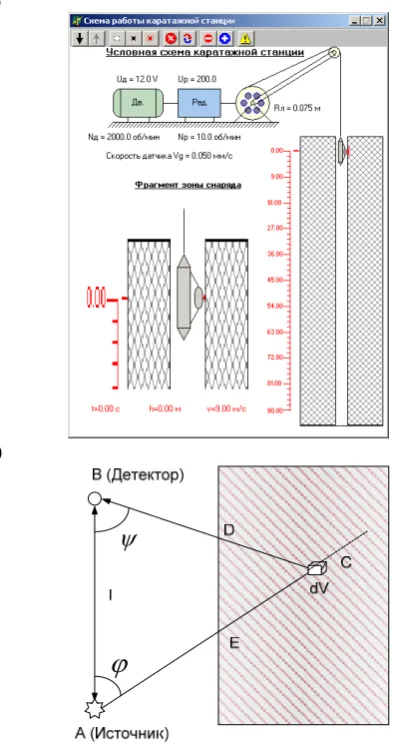
The suggested well-logging unit (Figure 1) consists of a main step motor, reducer, winch, and downhole tool with a pull-out sensor. The sensor has ionizing radiation sources, proportional counter as a detector, preamplifier , and step motor for sensor pulling out.
The goal is to create an automatic computer control system for well-logging unit based on mathematical modeling of the device and processing radiant excitations and
B. T. Zhumagulov is with the of the National Engineering Academy of the Republic of Kazakhstan , Almaty, Kazakhstan (corresponding author to provide phone: 727-291-7082; e-mail: aman_58@ mail.ru).
А.К.Tuleshov is with the of the National Engineering Academy of the Republic of Kazakhstan , Almaty, Kazakhstan (corresponding author to provide phone: 727-291-7082; e-mail: aman_58@ mail.ru).
Yu.М.Drakunovis with the of the National Engineering Academy of the Republic of Kazakhstan , Almaty, Kazakhstan (corresponding author to provide phone: 727-291-7082; e-mail: aman_58@ mail.ru).
measurements of characteristic X-ray radiation of atoms of the elements which are a part of rocks and ores in well.
II.THEORETICAL PREREQUISITES.
Multicomponent testing is carried out by means of fluorescent X-ray radiometrical method based on dependence of element characteristic radiation flux density on its content in the given volume. Analyzed elements characteristic radiation is excited by ionizing radiation source, A, and detected by proportional counter, B (Fig. 1, b). Total flux density of the secondary radiation can be represented in integral form
0 1 2 2 2
1 2
exp[ ( )] 4
s
s s
V
K Q
N Q r r dV
R R
, (а) whereQ
- source activity;K
s- Compton scattering factor;0
,
s
- primary and secondary radiation mass attenuation factor;dV
- ore body elementary volume;1
,
2,
1,
2R
AC
R
BC
r
EC
r
DC
.Global task is inversion of energy spectrum
J E
( )
on hardware spectrumf x
( )
and it boils down to the solution of a linear first kind Fredholm integral equation( , ) ( )
( )
K x E J E dE
f x
. (b) Ideally, the equation kernel should represent Gaussianfunction.
2
1 ( )
( , ) exp
2 ( ) 2 ( )
x E K x E
E E
. (c) As the resolution of the hardware is limited and due to
different influences of the amplifier, this task has an approximate solution since mathematical formulation of all processes in electric units is rather impossible.
Quanta of characteristic radiation of the analyzed elements cause pulses in the proportional counter with amplitude rising with their energy and which are amplified and formed in the preamplifier. Pulses from the preamplifier, are sent to detection and process device . Spectrometry device, is designated for signal conversion from the proportional counter with subsequent accumulation of information in microprocessor to obtain amplitude spectra of secondary radiation. Conversion channel number is set up by the program (256 or 1024). Mathematical treatment of secondary spectra is performed by the program in the control computer.
Computer Modeling and Control System for
X-ray Radiometrical Well-Logging Unit
III.PC PROGRAMMED OPERATION.
The analyzed elements content in a sampler when using X-ray radiometrical method can be determined as soon as the following two main tasks have been solved: definition of analyzed elements analytical lines intensity; calculation of analyzed elements contents based on the intensities determined.
a)
b)
[image:2.595.54.251.142.515.2]
Fig. 1. Well-logging unit and radiation pattern Analyzed elements analytical intensities can be determined by root-mean-square deviation function minimization
2( ) 1 1 2( ) ( ) ( , )
p
n m i Y i Y i F i p
, (1) where р - required parameters vector, n - number ofchannels processed, m - required parameters number, i - channel current number, Y(i) - intensity in i-channel, F(i,p) - required functional.
IV.RESPONSE FUNCTION DEFINITION.
Functional in question or so called detector response generalized function for any energy line of each analyzed element can be represented in the following form
1 2 3 1
( ) ( ) ( ) ( ) ( ) ( ) ( ) ( ) ( )
F x B x G x S x D x D x D x ESC x G x
Function and designations used hereby:
( )
B x
- background function, which has Chebyshev polynomial form;2 2
0 0
1
( ) exp ; ( ) exp
2 2
x x x x x
G x G x
- main and complementary Gaussian functions
correspondingly; ( ) 1 0
2 2
x x S x Erfc
- step function; 0 *
2 *
( ) exp 2
x x c ESC x
c
- take-off peak function;
0 0
1
( ) exp , 1, 2
2 2 2
j
j j
x x x x
D x Erfc j
- left tail function;
0 0
3
3 3
1
( ) exp
2 2 2
x x x x
D x Erfc
- right
tail function;
x
- variable, in terms of energy or channels;x
0- main Gaussian centre;x
- complementary Gaussian shift;
- main Gaussian resolution;
1,
2,
3 - appropriate tails resolution;c
*- take-off peak shift. Figure 2 features typical response functionandits components.Fig. 2. Detector response function andits components
V. ORE CONTENT CALCULATION PROCEDURE.
Energetic spectrometer calibration, i.e. setting up dependencies
i
c
c
i
c
c
E
4 3
2 1
is accomplished on the results of calibration sampler measurement.
Analyzed elements content calculation based on their intensities can be performed by means of two methods – simplified method and complete method. Simplified method uses spectral ratio method
i i S i i
i
F
b
J
J
F
[image:2.595.307.545.367.520.2]absorption effects and subexcitation, scattered radiation subexcitation, and presence of 2 intensive lines in excitation spectrum. Scattered radiation allows for change of measurement geometrical conditions as well as for mass attenuation factor caused by indefinite elements. After some mathematical transformation the mathematical expression for analyzed elements content calculation will have the following form:
2
1 1 1
1 1
1
нк нк к к
i
i i
ij j is
i i j
I d d
C F I
K h C h
t t
, (3)
Where
1
1 2
1 2 1
1 1 Sin
; ; ; ;
1 1 Sin
нк к S I
I
P
t K
t t P
.
Indices 1 and 2 refer to two lines of exciting radiation (uranium line
L
corresponds to Pu-238 - 1, 2 - uranium line
L
; argentum lineK
corresponds to Cd-109 - 1, 2 - argentum lineK
). Each element consists of several K-series and L- series lines correlated with each other byk
i factors. Prior to determination ofk
i, mass attenuation factors for an average sampler are defined, i. e. for a sampler with inserted average contents considering Zн filler.I.
j cp j Zн u j cp j j u пр
u1 1C 1 (1 C )
,
j cp j Zн i j cp j j i прi1 1C 1 (1 C )
,
1 1 1
sin '
sin
пр пр пр
i t i i
,
j cp j Zн i j cp j j i прi2 2 C 2 (1 C )
,
пр
i
пр
i2
t
2'
.For K-series lines:
пр i пр u пр i пр u i K i K i K i K i
P
P
P
P
k
2 1 1 1 2 1 2 1'
'
,where Р – emergence probability of the corresponding lines. For L- series it is predefined:
i i i L i L i i L i L i i L i L i L i L i L i L i L i LIII f f S S f S S f S S S S S S S r 3 , 2 2 , 1 1 1 3 , 1 1 1 3 , 2 2 2 2 2 2 3 3 1 1 1 1 , i i L i L i L i L i L i
LII
S
f
S
S
S
S
r
1,21 1 2 2
2
1
1
, i L i L i LI S S r 1 11 .
Finally, for L- series lines:
пр i пр u пр i пр u i L i LIII i LIII i L i L i L i LII i LII i Ll i L i L i LIII i LIII i P r P P P r P P P r k 2 1 1 1 2 4 3 1 2 1 ' ' )] ( 2 . 0 [ ) (
It is introduced mass absorption and scattering factors array for definition of concentrations. This array formation is effected on original algorithm: mass absorption and scattering factors array is introduced that can be represented in tabular form (Table 1).
Table 1- Mass absorption factors
)
(
' 1Fe
'(
)
2Cu
'(
)
3Zn
Z
н
'1Zн
'2Zн
'3Zн
)
(
1Fe
Z
' 1 1Z
' 1 2Z
' 1 3Z
)
(
2Cu
Z
' 2 1Z
' 2 2Z
' 2 3Z
)
(
3Zn
Z
' 3 1Z
' 3 2Z
' 3 3Z
)
(
4Pb
Z
' 4 1Z
' 4 2Z
' 4 3Z
To Continue Table 1
)
(
' 4
Pb
u1d
Zi'' 4Zн
'1Zн
u
' Zнd
' 1 4Z
' 1 1Z u
' 1 Zd
' 2 4Z
' 2 1Z u
' 2 Zd
' 3 4Z
' 3 1Z u
' 3 Zd
' 4 4Z
' 4 1Z u
' 4 Zd
Here,
ij'
t
ij, where
ij- mass attenuation factor of i-element analytical line by j-element;
1Zн- attenuation of Fek
- line by element with Z=Zн,
1Z1- attenuation of Fe
k
- line by Fe itself and etc.Values of mass scattering factors
d
Zi' are:d
Zi'
d
Ziнк
нк
d
Ziк
к,where
d
Ziнк andd
Ziк - mass factors for incoherent and coherent scattering of the main line of pure element excitation radiation.Here,
нк and
к- invariables determined according to the following formulae:пр u пр us нк t 1 1 1
, t нк 1 1
.Value
j j cp j usZн cp j usj пр
us
C
(1 C )
, wherecp j
samplers,
usj- mass attenuation factors for incoherent scattering line of analyzed elements excitation radiation. For determination of
usj, scattering excitation energy ispredetermined:
1
1
1
[1 cos(
)]
512
U S UE
E
E
.
For calculation of contents it is necessary to define two factors allowing for 2 intensive lines in excitation spectrum which enter the final formulae for calculation of contents.
j j cp j Zн U cp j j U j j cp j Zн U cp j j U пр U пр U С C С C d ) 1 ( ) 1 ( 1 1 2 2 1 2 .If characteristic radiation of К - series is exciting one, then м k м k м k м k U U u
P
P
P
P
E
E
K
2 1 2 1 3 2 1
,where
P
м - emergence probability of the characteristic lines for target element or anode РТ.If characteristic radiation of L - series is exciting one, then м L м LIII м LIII м L м L м L м LII м LII м Ll м L м L м LIII м LIII U U u P r P P P r P P P r E E K 2 4 3 1 2 1 3 2 1 )] ( 2 . 0 [ ) (
,where index “м” refers to target element or anode РТ. It is essential to introduce factors array of analyzed elements analytical lines cross subexcitation. Subexcitation is considered present if analytical lines are excited. Array formation is effected as per the following method:
The following vector should be formed:
12 13 14 23 34
)
(
i
h
h
h
h
h
H
If radiation of К - series is subexciting one, then
sin 1 ln sin sin 1 ln sin 1 2 1 1 1 1 1 пр j пр i р п i пр j пр U р п U i U i j j U j k j k j k ij S S h ,where
Uj1- primary radiation mass absorption factor in pure element j;
Ui1 and
ij - primary radiation and j – radiation mass absorption factors in pure element i;S
kj- element j absorption jump;
kj- fluorescence efficiency.If radiation of L - series is subexciting one, then
sin 1 ln sin sin 1 ln sin 2 1 1 1 1 1 пр j пр i р п i пр j пр U р п U i U i j j U J LI j LI J LII j LII J LIII j LIIIij r r r
h
.
Calibration factors Fi and F’i are selected experimentally on sampler test measurements.
VI.PROGRAMMED OPERATION OF COMPUTER CONTROLLED
WELL-LOGGING UNIT
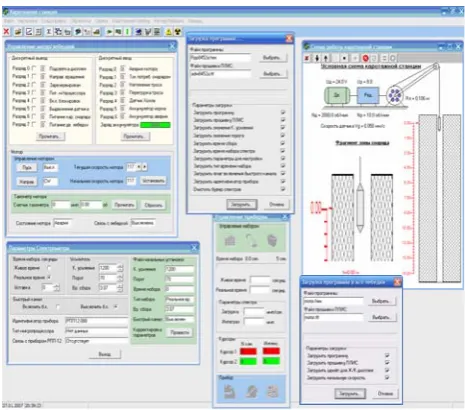
Figure 3 feathers application dialog box for well-logging unit with typical control panels of the system. Let’s take a look at some of them. “Motor/winch control” panel is used for main modes control: display lighting, motor rotation direction, microprocessor power, interlocking system switch on, sensor pull out, power for downhole tool and winch motor, emergency for motor, downhole tool useful current, ropes tension and strain, Hall sensor and accumulator charging control, motor and tachometer speed. Two panels “Program download …” are designated for downloading flash files and programmable integrated logic circuit flash files and also other parameters essential for electronic unit and mechanics operation into microprocessor sensors and motor/winch. “Spectrometry parameters” panel can set up main operation characteristics of electronic spectrometry: type and setting time for spectrum, amplification factor, fast channel correction, etc. «Logging unit operation scheme» panel constantly displays system dynamical working process and enables controlling main stages of logging in semi-automatic and manual modes: such as downhole tool hoisting and pulling down, sensor pulling in/out, switching on/off the measurement, etc.
[image:4.595.313.546.348.553.2]
Fig. 3. Application dialog box for well-logging unit Also, here, downhole tool velocity and its penetration into the well are displayed. “Device control” panel is used for manual spectrum setting control from the control computer. Once secondary radiation spectrum set, it is sent by computer serial port and processed thereafter.
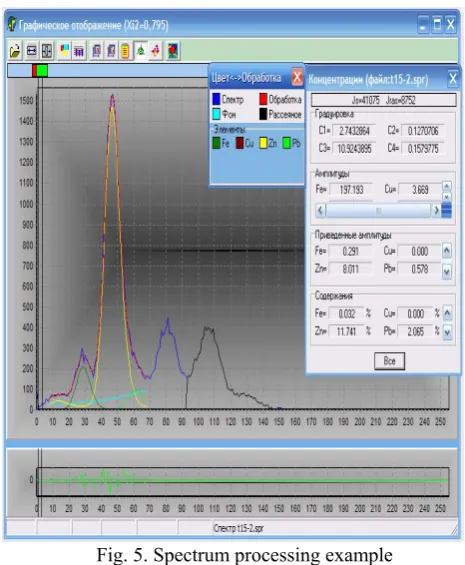
In order to adjust detector response function, menu option “Adjustment/Process and ФО Cu+Fe” is pressed, a dialog box showed on the Figure 4 appears then. This dialog box helps to adjust response function on processing two elements spectrum of copper and iron with known contents.
Fig. 4. To response function adjustment
Fig. 5. Spectrum processing example
During logging process all of this is done in automatic mode. Before logging, calibration is performed: calibrating sampler is installed on downhole tool measuring window and button or menu option “Measurement and calibration” is pressed. After calibration, continuous logging process can be started: downhole tool measuring window is applied at the entry of the well and button or menu option “Logging measurement and calculation” is pressed to start logging process in the following sequence:
а) downhole tool gets down to the well bottom automatically, sinking velocity and depth are recorded and displayed on PC; б) on reaching the well bottom, tension sensor trips and the downhole tool stops, then it slightly goes up to slack it up; г) the sensor pulls out of the downhole tool and once pulled out it starts measuring the given point of the well;
д) when the measurement time (about several seconds) expires, the obtained spectrum is sent to the PC and processed. At the same time the downhole tool moves up the
well at a rated pitch and stops again for measuring. The cycle repeats thus analyzing the whole well;
[image:5.595.306.548.108.250.2]е) when reaching the top of the well, the downhole tool stops in compliance with the distance set up in the counter.
Fig. 6. Elements content throughout the well depth All measurement results throughout the well (and spectra if desired) can be saved in a file to be displayed or printed in a required form. Figure 6 shows one of the elements content graphic displays throughout the well depth.
REFERENCES
[1] Drakunov Yu.М., Lezin А.N., Pukha N.P., Silachyov I.Yu. Spectral information interpretation for X-ray-fluorescent analyses based on expert system. // Izv. МОНРК, НАНРК, Ser. phys.-math., 2000, № 6, p. 69-76.
[2] Krasnoperov V.А. Gamma-gamma ray well-logging with photon low frequency radioactive nuclides (20-150 keV) for boring log layering. Almaty, 1989, 160 p.
[image:5.595.46.279.284.567.2]