Proceedings of the Third Conference on Machine Translation (WMT), Volume 2: Shared Task Papers, pages 746–750 Belgium, Brussels, October 31 - Novermber 1, 2018. c2018 Association for Computational Linguistics
https://doi.org/10.18653/v1/W18-64082
Abstract
The paper presents our participation in the WMT 2018 Metrics Shared Task. We propose an improved version of Translation Edit/Error Rate (TER). In addition to including the basic edit operations in TER, namely - insertion, deletion, substitution and shift, our metric also allows stem matching, optimizable edit costs and better normalization so as to correlate better with human judgement scores. The proposed metric shows much higher correlation with human judgments than TER.
1
Introduction
There has been several efforts to introduce better automatic evaluation metrics that can help towards the growth of machine translation (MT) systems. Human evaluation is slow and expensive and thereby efficient automatic MT evaluation metrics are required which are faster and correlate strongly with human judgements. Over the years a number of automatic MT evaluation metrics have been proposed like
BLEU (Papineni et al.,
2002), METEOR
(Banerjee and Lavie, 2005), Translation Edit Rate (Snover et al., 2002), NIST (Doddington, 2002), etc., which are widely used in the MT research and development community. However, due to its due to its simplicity and easier interpretability, Translation Edit Rate, or Translation Error Rate (TER), is one of the most commonly used MT evaluation metrics and often it is used as a baseline evaluation metric by MT researchers. In this work, we propose a new MTWork done while at Jadavpur University.
evaluation metric which provides improvements over TER and achieves better correlation with human judgement scores on the segment-level for various language pairs.
2
Related Work
The proposed metric is based on and an extension of TER (Snover et al., 2006), one of the most popular MT evaluation metrics. TER is an edit distance style error metric and it provides an edit ratio (often referred to as edit rate or error rate) in terms of how much editing is required to transform the MT output (also known as hypothesis) into a human translation (reference translation) with respect to the average length of the references. The term average is defined in case of multiple references, where normalization is done over the closest reference. The required editing is measured in terms of four edit operations - insertion, deletion, substitution and shifting.
Other related work relevant to our metric includes word error rate (WER) (Zechner and Waibel, 2000) and CharacTER (Wang et al., 2016). WER is the basis of TER and, unlike TER, it does not include the ‘shift’ operation. Both WER and TER consider word level edit operations. CharacTER is character level TER which calculates the edit distance at character level while performing the shift operations at word level.
Our work is different from CharacTER since we allow edit operations at character level only for those words in the hypothesis which find a stem match in the reference. Although TER outperforms WER, the normalization of the WER metric is the basis of our metric, i.e.,
ITER: Improving Translation Edit Rate through Optimizable Edit Costs
Joybrata Panja
Sudip Kumar Naskar
Indian Institute of Technology (ISM)
Jadavpur University
Dhanbad, India
Kolkata, India
normalization in our metric is a modified version of the normalization technique in WER.
3
Improvements over TER
Our metric includes all the edit operations carried out by TER, namely, insertion, deletion, substitution and shift. Apart from these operations, we improve over the TER metric by inclusion of stem matching, better normalization technique and optimal edit operation costs so as to improve the correlation of the new metric with human judgement score. We call our metric ITER, (Improved TER).
3.1
Stemming cost
Stemming is a very standard technique widely used in many natural language processing tasks. Whenever a hypothesis word and a reference word are different while having the same stem, instead of substituting the entire word as in TER, we allow character level edit operations as follows:
Figure 1: Character level edit operations for tokens having the same stem. Here, nop refers to no-operation (i.e., character match), del(x) refers to deletion of character ‘x’, ins(x) refers to insertion of character ‘x’ and sub(x, y) refers to substitution of character ‘x’ by character ‘y’.
In Figure 1, two substitutions and one insertion operation have to be made at character level in order to convert “played” into “playing”. ITER uses Porter Stemmer available in the nltk package. Assuming that all edit operations have uniform cost of 1, we obtain the minimum edit cost of 3 for this string pair. The normalizing factor here is the number of the ‘Edit operations:’ (cf. Figure 1) which includes the number of matched (corresponding to nop) characters plus the number of actual edit operations made. The motivation behind such normalization is to constrain the stemming cost to less than one. This is different from characTER and TER as their normalizing factors consider only characters and
tokens of the reference respectively, and therefore exceeding their metric score over 1 (i.e., 100%) in case of number of insertions exceeding the hypothesis length.
Stemming cost = min 𝑒𝑑𝑖𝑡 𝑐𝑜𝑠𝑡
#𝑐ℎ𝑎𝑟𝑎𝑐𝑡𝑒𝑟𝑠 𝑚𝑎𝑡𝑐ℎ𝑒𝑑+min 𝑒𝑑𝑖𝑡 𝑐𝑜𝑠𝑡
3.2
Improved Normalization
Normalization at segment level is performed similar to the normalization for stem match. The minimum edit cost comprises of shifting cost, insertion cost, deletion cost, substitution cost and
stemming cost (cf. Section 3.1). The
normalization factor includes the total number of tokens (or words) in the hypothesis plus the number of tokens matched at the stem level and minimum edit cost.
ITER = min 𝑒𝑑𝑖𝑡 𝑐𝑜𝑠𝑡
𝑛𝑜𝑟𝑚𝑎𝑙𝑖𝑧𝑖𝑛𝑔 𝑓𝑎𝑐𝑡𝑜𝑟
where normalizing factor = #tokens of hypothesis + #tokens stemmed + min edit cost.
The first term (i.e. tokens of hypothesis) in the normalization factor represents that in the worst case, all tokens might need to be shifted. Considering the reference to be a different permutation (or alignment) of the tokens of the hypothesis with no added (or extra) tokens, we might go with shifting all the tokens of hypothesis. The shifted tokens could further be stemmed or edited thereby justifying the second and third component respectively in the normalization factor. In case stemming is not taken into consideration (as in the case of out-of-English translations, cf. Section 4.1), stemming cost is not be considered in min edit cost. Similarly, in the normalizing factor, there would not be any tokens stemmed, instead the concerned tokens will be substituted and will contribute to the min edit cost. Next we hypothesize that all edit costs lie between 0 and 1, therefore, in order to keep ITER in the [0, 1] range, we formulate our normalization in this way.
3.3
Optimal edit operation cost
TER considers equal cost for all the edit operations. The key motivation behind having optimal edit costs, or for that matter different edit costs for different edit operations, is that different edit operations take different time and effort during actual human post-editing. On the other hand, human judgement scores are direct Hypothesis: p l a y e d
Reference: p l a y i n g
Edit operations: nop(p), nop(l), nop(a), nop(y), sub(e, i), sub(d,n), ins(g)
F
reflection of how much time and effort is required to correct the translations; they are inversely related. Prior to justifying the term ‘optimal edit operation cost’, Figure 2 explains the change in edit operations when the edit costs are changed. In order to find the optimal costs for the different edit operations, we trained our metric by varying each edit cost in the range [0.1, 1] with a difference of 0.1. Since we consider 4 different edit operations, this resulted in 10,000 (i.e., 104)
combinations for the edit costs. The set which gives the best correlation with human judgement scores is selected as the optimal set of edit costs.
4
Setup
ITER gives both segment level as well as system level score. Like TER, ITER is essentially a segment level metric and the system level scores are obtained by the weighted average of segment level scores. For optimizing the segment level scores, we trained our metric on the WMT15 datasets and tested on the WMT16 datasets for out-of-English and to-English translations.
4.1
Segment level score
Training data from WMT15 were used to tune our metric. All the edit operation costs were varied from 0 to 1 so as to find the optimal set of edit costs that results in highest correlation with
human judgement scores.
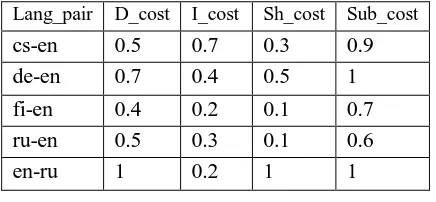
For out-of-English translations, we skipped stemming since we could not avail reliable stemmers for the target languages and considered the basic operations at word level similar to TER. The normalizing factor of ITER have zero tokens to be stemmed in this case. Table 1 gives the optimal set of edit costs after training our metric on the WMT15 datasets.
4.2
System level score
The system level score is the weighted arithmetic average of segment level scores. Let us consider a test set having m segments. We assume the ITERs to be 𝑥1, 𝑥2 , 𝑥3, … . . , 𝑥𝑚for m segments respectively where 𝑥𝑖 = 𝑒𝑖⁄𝑛𝑖. The term ‘𝑒𝑖’
represents minimum edit cost for the ith segment
whereas ‘𝑛𝑖’ represents the normalizing factor for
the ith segment. The system level score is defined
as follows.
ITERSystem =
𝑒1 + 𝑒2+ 𝑒3+ ………. + 𝑒𝑚 𝑛1 + 𝑛2+ 𝑛3+ ………. + 𝑛𝑚
5
Experiments and Results
We tuned our metric on the training datasets of the WMT15 and obtained the following optimal sets of edit costs presented in Table 1.
Original Ref: Hearts set for SFA battle over Neilson comments Original Hyp: Hearts will fight SFA over comments against Neilson
At cost 1:2 shifts + 3 substitution
Hyp After Shift: Hearts will fight SFA against over Neilson comments 2 shifts: [over, 1], [comments, 2]
Edit operations after shift: nop(Hearts), sub(will, set), sub(fight, for), nop(SFA), sub(against, battle), nop(over Nielson comments)
At cost 2:1 shift + 1 insertion + 1 deletion + 2 substitution
Hyp After Shift: Hearts will fight SFA over Neilson comments against 1 shift: [Nielson, -2] Edit operations after shift: nop(Hearts), sub(will, set), sub(fight, for), nop(SFA), ins(battle), nop(over Nielson comments), del(against)
Figure 2: Here, cost 1 and cost 2 represent two different cases of edit costs reflecting the change in edit operations. Although in both cases, there are 5 edit operations involved but the total edit cost
will vary depending on the cost of each edit operation. The term [Nielson, -2] represents that ‘Nielson’ is shifted two places back. Similarly, [over, 1] represents that ‘over’ is shifted one place
forward. For ‘nop’, ‘ins’, ‘del’ and ‘sub’, refer to section 3.1.
Lang_pair D_cost I_cost Sh_cost Sub_cost
cs-en 0.5 0.7 0.3 0.9
de-en 0.7 0.4 0.5 1
fi-en 0.4 0.2 0.1 0.7
ru-en 0.5 0.3 0.1 0.6
[image:4.595.70.288.70.171.2]en-ru 1 0.2 1 1
Table 1: Optimal sets of edit costs obtained after training ITER on WMT15 datasets (DAseg-wmt-newstest2015). Here, D_cost, I_cost, Sh_cost and Sub_cost refer to the cost of deletion, insertion, shifting and substitution, respectively.
We carried out the evaluation of our metric on the
WMT16 (DAseg-wmt-newstest2016) dataset
using the corresponding optimal sets of edit costs (cf. Table 1) tuned on the WMT15 datasets and computed the segment level correlation with human judgement scores in terms of Pearson correlation coefficient (Pearson, 1895). For a comparative evaluation, we compared our metric with TER on the same dataset and the results are shown in Table 2.
As can be seen from Table 2, the proposed metric provides much higher correlation (9.62% − 32.50%) for every language pair and target language than TER. The fact that even for the en-ru language direction, the metric shows significant improvement in correlation without the stem matching component, indicates that most of the improvements are due to the optimal edit costs. Apart from TER, we compared our results with the top performers of WMT16 segment level metrics (cf. Table 2) like sentBLEU (Bojar et al., 2016), MPEDA (Zhang et al., 2016) and METRICSF (Bojar et al., 2016). sentBLEU is the segment level version of BLEU, MPEDA was developed on the basis of METEOR and METRICSF is a combination of three metrics, namely, BLEU, METEOR and UPF-COBALT (Fomicheva et al., 2016). It can be inferred from Table 2 that ITER performs significantly better than TER and it is among the top few performers. Specifically for ru-en, ITER provides the best result and surpasses all other metrics.
We participated in the WMT 2018 Metrics Shared Task and submitted results for the “no hybrids” (newstest2018+testsuites) test set. Due to resource constraints, we could not evaluate the “hybrids” test set which contain artificially created 10K+ system outputs per language pair and test set. To establish better confidence
intervals for system-level evaluation, the WMT18 metric task organizers computed system level scores for 10K hybrid super-sampled systems from our non-hybrid segment level scores using simple arithmetic average. The results of our participation in the WMT 2018 Metrics Shared Task are reported in (Ma et al., 2018).
6
Conclusions
This paper presents ITER, a TER style MT evaluation metric, which shows way better correlation than TER. The key idea behind ITER is optimizable edit costs. On the other hand, ITER gives the user the flexibility to choose their own set of edit operation costs and choose the one that suits the most. Since error rate higher than 100% does not make any sense, we improved the normalization in ITER. ITER also considers stem matching and character level edit operations.
Acknowledgments
Sudip Kumar Naskar is supported by Digital India Corporation (formerly Media Lab Asia), MeitY, Government of India, under the Young Faculty Research Fellowship of the Visvesvaraya PhD Scheme for Electronics & IT.
References
Satanjeev Banerjee, and Alon Lavie. 2005. An Automatic Metric for MT Evaluation with
Improved Correlation with Human
Judgments. In Proceedings of the ACL-2005
Workshop on Intrinsic and Extrinsic
Evaluation Measures for MT and/or
Summarization. pages 65–72, Ann Arbor, Michigan.
Ondřej Bojar, Yvette Graham, Amir Kamran, and Miloš Stanojević. 2016. Results of the
WMT16 Metrics Shared Task. In Proceedings
of the First Conference on Statistical Machine Translation, pages 199–231, Berlin, Germany. George Doddington. 2002. Automatic evaluation of machine translation quality using n-gram co-occurrence statistics. In Proceedings of the second international conference on Human Language Technology Research (HLT '02). Pages 138–145, San Diego, California.
Marina Fomicheva, Nuria Bel, Lucia Specia, Iria da Cunha, and Anton Malinovskiy. 2016. CobaltF: A Fluent Metric for MT Evaluation. In Proceedings of the First Conference on
Machine Translation, Volume 2: Shared Task Papers, pages 483-490, Berlin, Germany. Qingsong Ma, Ondřej Bojar, and Yvette Graham.
2018. Results of the WMT18 Metrics Shared Task. In Proceedings of the Third Conference on Machine Translation, Volume 2: Shared Task Papers, Brussels, Belgium.
Papineni, K., Roukos, S., Ward, T., and Zhu, W.-J. 2002. BLEU: A method for automatic
evaluation of machine translation. In
Proceedings of the 40th Annual Meeting of the Association for Computational Linguistics (ACL ’02), pages 311–318, Philadelphia, Philadelphia, PA.
Karl Pearson. 1895. Notes on Regression and Inheritance in the Case of Two Parents. In Proceedings of the Royal Society of London, volume 58, pages 240–242, London, UK.
Matthew Snover, Bonnie Dorr, Richard
Schwartz, Linnea Micciulla, and John Makhoul. 2006. A study of translation edit rate with targeted human annotation. In Proceedings of the Conference of the Association for Machine Translation in the Americas, pages 223–231, Cambridge, MA, USA.
Weiyue Wang, Jan-Thorsten Peter, Hendrik Rosendahl, Hermann Ney. 2016. CharacTER: Translation Edit Rate on Character Level. In Proceedings of the First Conference on Machine Translation, Volume 2: Shared Task Papers, pages 505–510, Berlin, Germany. Klaus Zechner and Alex Waibel. 2000.
Minimizing Word Error Rate in Textual
Summaries of Spoken Language. In NAACL
2000 Proceedings of the 1st North American chapter of the Association for Computational Linguistics conference, Pages 186–193, Seattle, Washington, USA.
Lilin Zhang, Zhen Weng, Wenyan Xiao, Jianyi Wan, Zhiming Chen, Yiming Tan, Maoxi Li, and Mingwen Wang. 2016. Extract Domain-specific Paraphrase from Monolingual Corpus
for Automatic Evaluation of Machine
Translation. In Proceedings of the First Conference on Machine Translation, Volume 2: Shared Task Papers, pages 511-517, Berlin, Germany.
Lang_pair ITER TER MPEDA METRICSF sentBLEU DPMFCOMB COBALTF BEER
cs-en 0.652 0.576 0.644 0.696 0.557 0.713 0.671 0.661
de-en 0.534 0.444 0.538 0.601 0.448 0.584 0.591 0.462
fi-en 0.524 0.478 0.513 0.557 0.484 0.598 0.554 0.471
ru-en 0.625 0.525 0.545 0.615 0.502 0.618 0.618 0.533
en-ru 0.591 0.446 0.645 - 0.550 - - 0.666
Table 2: Segment-level correlations of automatic evaluation metrics on the WMT16 test set. Blank spaces indicate scores are not available. We calculated the ITER and TER scores and cited the other scores from the Bojar et al. (2016).