Abstract— This work studies the dynamic behavior of
process networks consisting of a hard chrome electroplating bath connected with a heat exchanger, which is immersed in the electroplating bath and connected with a cooling system. The heat exchanger is used to remove the heat produced from high current load in the electroplating process as well as to maintain the temperature of the bath at a properly specified range of between 45 and 50oC. However, in most cases, the temperature of the plating solution cannot be kept at the range due to the fact that the heat exchanger cannot sufficiently remove the heat released from chemical reactions in the electroplating bath. As a result, a new design heat exchanger regarding its shape is developed. It was found that with the new design heat exchanger, the temperature of the bath can be maintained at the range throughout the process. In addition, to study the dynamic behavior of the bath, its mathematical models have been developed and unknown parameters have been estimated based on actual plant data. Simulation results have shown that the developed models give good prediction of the bath’s solution temperature.
Index Terms— Electroplating, Hard Chrome, Dynamic
Behavior, Heat exchanger
I. INTRODUCTION
Hard chrome electroplating, functional chrome plating, is the chromium plating applied as a fairly heavy coating. This process is generally used to give deposit thicknesses of greater than 2.5 micron and up to 500 micron or more. The property of chromium plated on work pieces are depend on the operating condition as a concentration of chromic acid and sulfuric acid, a directed current power voltage and current requirements [1], [2]. In addition, the operating temperature in plating bath is the one of the factors that can be made the defect on surface of work piece. Mostly, the major problem in hard chrome electroplating manufactory in Thailand is the high temperature of plating solution while the work pieces are being plate. Generally, the heat exchanger is used to remove the heat produced from high current load in the electroplating process. However, the temperature of the plating solution is out of specification of between 45 and 50oC [2], [3]. This is due to the fact that the heat exchanger adequately cannot remove the heat released from chemical reactions in the electroplating bath. At the time which the work pieces are being plate, the heat is produced by the high current load and accumulated in the plating solution to induce high temperature. Hence, this is
P. Boriboonsri, is with the Department of Chemical Engineering Chulalongkorn University, Bangkok, 10330, Thailand (e-mail: [email protected])
P. Kittisupakorn is now with the Department of Chemical Engineering, Chulalongkorn University, Bangkok, 10330, Thailand (email: [email protected])
reasonable to establish this work and also focus on the temperature of plating solution problem in the hard chrome electroplating bath. This work was also compared the simulation results with the hard chrome plating actual plant data.
The actual hard chrome electroplating plant consisting of the hard chrome electroplating bath connected with an internal heat exchanger, which is immersed in electroplating bath and connected with a cooling system. The cooling water is used as a cooling medium to cool the plating solution inside the plating bath. After that the high temperature water transferred from plating bath is removed the heat by passing through the cooling tower. Then, the lower temperature water, from the cooling tower, is sent back to electroplating bath. The system is shown on fig. 1.
A
V
dynamo
+ +
-Cooling tower Internal Heat Exchanger
Electroplating
Fig.1. Hard chrome plating bath and cooling system of electroplating manufactory
The objective of this work is to study the development of the appropriate mathematical models by using the MATLAB program to find the heat transfer coefficient in of term of UA of immersion coils and the factors that cause the temperature of plating solution out of the optimal range.
II. DYNAMICS OF THE PLATING BATH AND THE COOLING SYSTEM
In the plating bath, assume that the released heat of electroplating current load is significant to raise the plating solution temperature. To prove this assumption to the actual plant data, the mathematical models including the mass and energy balance are developed to describe the dynamics behavior of system. This system consists of the electroplating bath, the internal heat exchanger, the receiver tank of cooling water and the cooling tower. The mathematical models are derived for the dynamics of four batch samplings. The randomized samplings are got from the actual plant, short time plating and long time plating. The operations of short time electroplating batches (actually 2 to 4 hours) are operated on the day time whereas the long time electroplating
Study of Dynamic Behavior of Heat Exchanger
System in Hard Chrome Electroplating
batches (more than 7 hours depending on the work pieces) are operated on the night time.
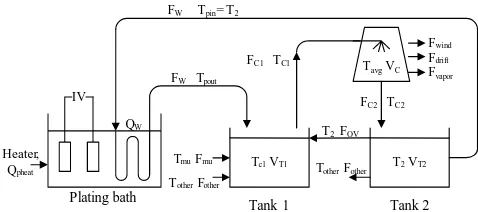
Plating bath
Tank 1 Tank 2
IV
FW Tpin= T2
Heater, Qpheat
TmuFmu
TotherFother
Tc1VT1 T2VT2
FC1 TC1
FW Tpout
TavgVC
Fwind
Fdrift
Fvapor
FC2 TC2
T2FOV
TotherFother
[image:2.595.54.293.89.195.2]QW
Fig. 2.The mass and energy of plating bath connected with cooling system.
A. Modeling of a plating bath and a cooling system
A process to be considered in this work consists of a plating bath and a cooling system, as shown in Fig. 2. Let T
denotes the temperature, F denotes the volumetric flow rate and Q denotes the energy rate. The heat transfer between the plating bath connected with the cooling system can be described that the heat produced from the electrical load is removed by an internal heat transfer coil. Starting with the water flow rate, FW with temperature, Tpin is flowed through the internal heat exchanger immersed in the plating solution, with have the temperature of Tp. At that time, the heat is transferred from the plating solution to raise the water temperature in the coil up toTpout. The water left out of plating bath is transferred to the tank 1. The water from the other plating baths (TotherFother), the make up water (TmuFmu) and the over flow water from the tank 2 (T2 Fov) are also added into the tank 1 to maintain the water level in the tank1 and the tank 2. The water from the tank 1 (TC1FC1) is pumped
as input of the cooling tower and the output water (TC2 FC2)
is sent to the tank 2. At the cooling tower, the water loss (including mass and heat loss) is come from three sections, evaporation loss (Fvapor), drift loss (Fdrift) and blow down ( Fwind )[4]. In the tank 2, the water is continuously re-circulated to the plating bath. For this study, the mass conservation models are developed under the steady state condition whereas the energy conservation equations are derived based on the dynamic condition of the actual plant data. The energy conservation model of the plating bath (eq.1) is composed of the energy input, energy output. The energy from the power current load and the heater are considered as an energy input into the platning bath and the energy out is considered the heat transferring of the internal coil, the heat of plating bath removed by internal heat exchanger coil, and the heat loss to surroundings. The energy conservation of internal coil (eq.2) relates to the heat transfering of internal coil and also assumes as a lumped model. Since the energy consvered is the following equation [5], [6] are:
iv t ht lm
p pheat loss
p pp p
F IV Q Q FUA T
dT
dt ρ C V
+ − − Δ
=
i i
(1)
0 0
( )
pout w pin pout t ht lm
w pw
dT F T T FUA T
dt LA ρ C LA
− Δ
= + (2)
Where
ln ( )
pout pin lm
p pin p pout
T T
T
T T T T
−
Δ =
⎡ − − ⎤
⎣ ⎦
The last term in eq.(1) and eq.(2), the overall heat transfer coefficient, U term, is represented the overall ability of a series of conductive and convective barriers to transfer heat across the heat exchanger tube.
The water left out the internal coil is sent to the tank 1; afterward it is transferred to the cooling tower in order to cool its water temperature. The cooling water left the cooling tower is delivered to the tank 2 before re-circulated to the plating bath. The cooling water is also interacted between the tank 1 and the tank 2, to maintain the water level of these tanks. The mathematical models, the mass conservations were used to find the make up flow rate and over flow water between the tank 1 and 2 and were developed under the steady state [6], [7]. The models are following: Mass balance:
mu wind evap drift
F =F +F +F (4)
2 1
c c mu
F =F −F (5)
2
ov c w other
F =F −F −F (6) For the temperature profiles of the tank 1 and 2 and the overall cooling tower can be described by the energy conservation of cooling system. The cooling tower
mathematical model was developed from P.Naphon [8] and Jameel-Ur-Rehman Khan [9]. The equation was justified into simple equation, by assumption that the heat removal of cooling tower based on two terms such as the convective and the evaporative heat transfer. The heat transfer equations of the cooling system, the tank 1, 2 and cooling tower are following, accordingly:
Energy balance:
2 1 1
1
1
w pout mu mu other other ov c c c
t
F T F T F T F T F T
dT
dt V
+ + + −
= (7)
2 2 2
2
2
( )
c c w ov other
t
F T F F F T
dT
dt V
− + +
= (8)
1 1 2 2
2
( )
A s avg air evap eva
c c avg mu c c
w pw pw
c
C
h A T T F C
F T T F F T
C C
dT
dt V
ρ −
− − − −
=
Where Tavg =(Tc1+Tc2) 2 (9)
III. SIMULATION RESULTS AND DISCUSSIONS
All of the models were considered to simplify simulation by assuming that:
• The physical properties, density and heat capacity of the plating solution and the water to be constant in the temperature ranges.
• The temperature water in the internal tube heat exchanger is linearly changes with the distance in the flow direction. And the heat transfer between air and the coil outside the plating bath is neglected.
• All units are modeled as lumped parameter systems.
• The initial value of UAht is calculated fromFwρwCpw(Tpout−Tpin)=UAhtΔTlm of many points of the actual data.
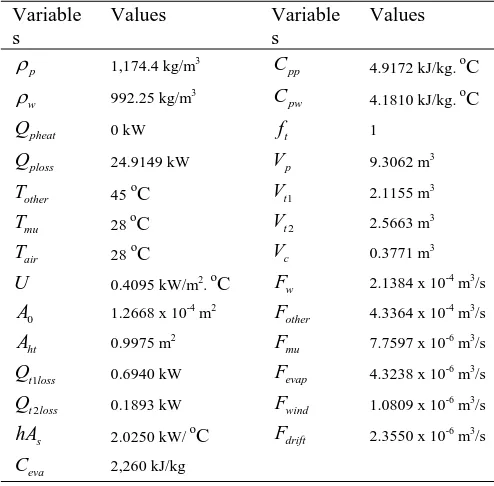
[image:3.595.312.528.161.348.2]From the models, there are various unknown parameters such as temperature of the other plating bath and temperature of the air etc. The models may use these values as the average temperature. The randomized 2 batch (batch 1 and 2) samplings of short time electroplating batch were considered to simulate and compare with the actual plant collected data. The properties of fluids and the parameters of units are presented in Table 1 and the initial value of variables is shown in table 2 and 3 for batch 1 and 2, of short time plating batch, respectively.
Table 1: Nominal values for the process parameters Variable
s
Values Variable s
Values
p
ρ 1,174.4 kg/m3
pp
C 4.9172 kJ/kg. oC
w
ρ 992.25 kg/m3
pw
C 4.1810 kJ/kg. oC
pheat
Q 0 kW ft 1
ploss
Q 24.9149 kW Vp 9.3062 m3
other
T 45 oC Vt1 2.1155 m3
mu
T 28 oC Vt2 2.5663 m
3
air
T 28 oC Vc 0.3771 m3
U 0.4095 kW/m2. oC w
F 2.1384 x 10⁻⁴ m3/s
0
A 1.2668 x 10⁻⁴ m2
other
F 4.3364 x 10⁻⁴ m3/s
ht
A 0.9975 m2
mu
F 7.7597 x 10⁻⁶ m3/s
1
t loss
Q 0.6940 kW Fevap 4.3238 x 10⁻⁶ m3/s
2
t loss
Q 0.1893 kW Fwind 1.0809 x 10⁻⁶ m3/s
s
hA 2.0250 kW/ oC Fdrift 2.3550 x 10
-6
m3/s
eva
[image:3.595.46.293.306.549.2]C 2,260 kJ/kg
Table 2: The initial value of variables for batch 1
Variable Value (oC) Variable Value (oC)
p
T 60.5 T1=Tc1 36.8
pout
T 44.5 Tpin=T2 34.3
IV 2100 amperes x 8.5 volts
Table 3: the initial value of variables for batch 2
Variable Value (oC) Variable Value (oC)
p
T 61.6 T1=Tc1 36.8
pout
T 45.8 Tpin=T2 35.2
IV 2600 amperes x 9.5 volts
Firstly, the actual plant data was used to find the value of
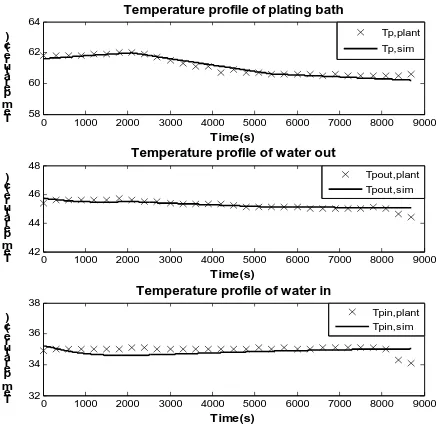
U and hAs for heat transferring of internal coil and cooling tower, respectively, that used as a constant in the simulation. The simulation results were compared with the actual plant data at the same real time. The fig. 3 shown the simulation
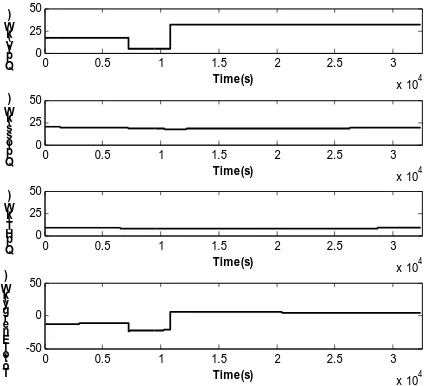
results of batch 1, at the first graph, the plating solution temperature varying with time was nearly fitted with the actual data. At the beginning of batch, the temperatures tend to heighten due to heat generated by high current load and then it slightly drop down. From the fig. 4 shows the total heat added into plating bath, was depended on the heat generated by IV but the heat out of plating bath, Qploss and QpHT, are quite constant.
0 1000 2000 3000 4000 5000 6000 7000 55
60 65
Temperature profile of plating bath
time(s) T
e m p er at ur e(
c) Tp,plant
Tp,sim
0 1000 2000 3000 4000 5000 6000 7000 40
45 50
Temperature profile of water out
time(s) T
e m p er at ur e(
c) Tpout,plant
Tpout,sim
0 1000 2000 3000 4000 5000 6000 7000 30
35 40
Temperature profile of water in
time(s) T
e m p er at ur e a(
c) Tpin,plant
Tpin,sim
Fig. 3 The temperature profile of plating solution, water in and out compare with the actual plant data of batch 1.
0 1000 2000 3000 4000 5000 6000 7000 0
20 40
Time(s) QpI
V ( k W )
0 1000 2000 3000 4000 5000 6000 7000 0
20 40
Time(s) Qpl
o s s ( k W )
0 1000 2000 3000 4000 5000 6000 7000 0
20 40
Time(s) Qp
H T ( k W )
0 1000 2000 3000 4000 5000 6000 7000 -40
-20 0 20 40
Time(s) T
ot ol En er g y (k W )
Fig. 4 the heat fromIV, heat loss to surrounding, heat transfer by internal heat exchanger and the total heat in the plating bath.
[image:3.595.312.529.390.589.2]pieces and the plating solution. All of these reasons what the disturbance variable are.
[image:4.595.305.551.58.432.2]On the second graph of the fig. 3, the trend of temperature of water left the plating bath was similar to the collected data and match with the temperature of plating solution. On the last graph of fig. 3, the temperature of water that was transferred to plating bath was acceptable fitted with the data. For the simulation results of the batch 2, as shown on fig. 5, the temperature of the bath obtained from the simulation is almost the same as the actual plant data.
0 1000 2000 3000 4000 5000 6000 7000 8000 9000 58
60 62 64
Temperature profile of plating bath
Time(s) T e m p er at ur e( c)
0 1000 2000 3000 4000 5000 6000 7000 8000 9000 42
44 46 48
Temperature profile of water out
Time(s) T e m p er at ur e( c)
0 1000 2000 3000 4000 5000 6000 7000 8000 9000 32
34 36 38
Temperature profile of water in
Time(s) T e m p er at ur e( c) Tpin,plant Tpin,sim Tpout,plant Tpout,sim Tp,plant Tp,sim
Fig. 5 the temperature profile of plating solution, water in and out compare with the actual plant data of batch 2.
0 1000 2000 3000 4000 5000 6000 7000 8000 9000 0 20 40 Time(s) QpI V(k W )
0 1000 2000 3000 4000 5000 6000 7000 8000 9000 0 20 40 Time(s) Qpl o s s(k W )
0 1000 2000 3000 4000 5000 6000 7000 8000 9000 0 20 40 Time(s) Qp HT (k W )
0 1000 2000 3000 4000 5000 6000 7000 8000 9000 -40 -20 0 20 40 Time(s) T ot ol E ne r gy (k W )
Fig. 6 the temperature profile of plating solution, water in and out compare with the actual plant data of batch 2. For the randomized 2 batches (batch 3 and 4) samplings of long time electroplating batch were considered to simulate and compare with the actual plant collected data. The initial value of variables is shown in table 5 and 6 for batch 3 and 4, of long time plating batch, respectively.
Table 4: The initial value of variables for batch 3
Variable Value (oC) Variable Value (oC)
p
T 59.2 T1=Tc1 36.8
pout
T 44.1 Tpin=T2 34.6
IV 4500 amperes x 8 volts
Table 5: the initial value of variables for batch 4
Variable Value (oC) Variable Value (oC)
p
T 61.6 T1=Tc1 36.8
pout
T 45.8 Tpin=T2 35.2
IV 4000 amperes x 10 volts
0 0.5 1 1.5 2 2.5
x 104 55
60 65
Temperature profile of plating bath
time(s) Te m p e ra tu re (c )
0 0.5 1 1.5 2 2.5
x 104 40
45 50
Temperature profile of water out
time(s) T e m p era tu re (c )
0 0.5 1 1.5 2 2.5
x 104 30
35 40
Temperature profile of water in
time(s) T e m p era tu re (c ) Tpin,plant Tpin,sim Tpout,plant Tpout,sim Tp,plant Tp,sim
Fig. 7 the temperature profile of plating solution, water in and out compare with the actual plant data of batch 3.
0 0.5 1 1.5 2 2.5
x 104 0 50 Time(s) QpI V(k W )
0 0.5 1 1.5 2 2.5
x 104 0 50 Time(s) Q pl o s s(k W )
0 0.5 1 1.5 2 2.5
x 104 0 50 Time(s) Qp HT (k W )
0 0.5 1 1.5 2 2.5
x 104 -50 0 50 Time(s) T ot ol E ne r gy (k W )
Fig. 8 the temperature profile of plating solution, water in and out compare with the actual plant data of batch 3.
[image:4.595.57.275.185.397.2] [image:4.595.57.275.455.652.2] [image:4.595.312.530.486.680.2]was quite constant. For the batch 4, the temperatures of system were acceptable like a batch 3, but the QpIV was different, depended on work pieces.
The plating solution temperature was observed that remarkable changes because the current loads of long time plating batch were significant higher than the short time plating batch. Due to the high thicken desired of chromium layer and the heat released from the chemical reaction of ions, may cause its temperature.
0 0.5 1 1.5 2 2.5 3
x 104 55
60 65
Temperature profile of plating bath
time(s) T
e m p e r at u r e(c )
Tp,plant Tp,sim
0 0.5 1 1.5 2 2.5 3
x 104 40
45 50
Temperature profile of water out
time(s) T
e m p e r at u r e(c )
Tpout,plant Tpout,sim
0 0.5 1 1.5 2 2.5 3
x 104 30
35
40 Temperature profile of water in
time(s) T
e m p e r at u r e(c )
Tpin,plant Tpin,sim
Fig. 5 the temperature profile of plating solution, water in and out compare with the actual plant data of batch 4.
0 0.5 1 1.5 2 2.5 3
x 104 0
25 50
Time(s) QpI
V(k W )
0 0.5 1 1.5 2 2.5 3
x 104 0
25 50
Time(s) Qpl
o s s(k W )
0 0.5 1 1.5 2 2.5 3
x 104 0
25 50
Time(s) Qp
HT (k W )
0 0.5 1 1.5 2 2.5 3
x 104 -50
0 50
Time(s) T
oto l E n er g y(k W )
[image:5.595.57.270.171.366.2]Fig. 6 the temperature profile of plating solution, water in and out compare with the actual plant data of batch 4. Table 5: The IAE errors of short time sampling batch
IAE1 IAE2 IAE3
Batch 1 1.3951 5.6906 2.9246
Batch 2 3.3705 2.6324 7.1433
Batch 3 4.6211 10.8926 7.6292
Batch 4 5.3364 12.4036 9.1228
The errors of the simulation results and the actual plant data were shown on the table5. The IAE1, IAE2 and IAE3 were indicated the integrated absolute error [10] of the plating solution temperature, the cooling water temperature inlet and outlet of internal coil immersed in the plating bath,
respectively. The IAE errors of these system, can be explained the temperature difference between the simulation results and actual plant data of the whole time for each batch, in different Celsius degree unit.
The IAE errors for the short time plating batch, the batch 1 and 2, are found that the IAE1 value is the minimum errors. In the same way, for the long time plating batch, the IAE1 are also the minimum errors. Similarly, the IAE2 values are mostly the maximum errors. Due to the term ofU , heat transfer of internal coil, in the equation (2) is only the one term that can cause the outlet water temperature of internal coil change. TheU value was varied slightly deviation from the first guess initial value, the temperature profile in the second and the last graph of the temperature profiles were distinct change. The final Uvalue is the 1.08 times of the first guess value or 0.4423 kW/m2.oc. Furthermore, the
s
hAvalue can cause inlet water temperature to the internal coil, directly, but this value is not significantly to change the inlet water temperature because of the large receiver tank, the tank 2. In addition, the high value of IAE errors may come from the time delay, the time delay was neglected both of short and long time plating batch when compare with the time of batch.
From all of these simulation results cogently observed that the heat produced from current load is the main cause of temperature of plating bath. The U value is the significant value that can use to design a new internal heat exchanger to control the temperature in the plating bath.
IV. CONCLUSION
The mathematical models have been successfully
formulated to predict the dynamics temperature of the plating bath connected with the cooling system. The results have shown that the heat produced from power input is the main cause of high temperature of the plating solution. Generally, the internal coil heat exchanger was used to remove the heat out of plating bath. To study the dynamic behavior of the bath, its mathematical models have been developed and unknown parameters have been determined based on actual plant data. Simulation results have shown that the developed models give good prediction of the bath’s solution
temperature.
REFERENCES
[1] Lowenheim, F. A., Modern Electroplating, 3rd ed., New York, J. Wiley,
1974
[2] Lawrence J. Durney, Electroplating engineering handbook, 4th ed.,
New York, Van Nostrand Reinhold, 1984
[3] Mordechay Schlesinger, Milan Paunovic, Modern Electroplating, 4th
ed., New York, J. Wiley, 2000
[4] Perry R. H., Perry’s Chemical Engineers’ Handbook, 1997, pp. 12-17 – 12-25.
[5] Frank P. Incropera, David P. DeWitt, Fundamentals of Heat and Mass Transfer, 6th ed., Hoboken, J. Wiley, 2007
[6] R. Byron Bird, Warren E. Stewart, Edwin N. Lightfoot, Transport phenomena, 2nd ed., New York : J. Wiley, 2002
[7] Christie John Geankoplis, Transport Process and Separation Process Principles, 4th ed., Prentice Hall, 2003
[8] Paisarn, N. Study on the heat transfer characteristics of an evaporative cooling tower
[image:5.595.56.273.408.601.2][10] Michael, B.; Daoutidis, P. J. Process Control, 2005, 16 , pp. 265-274 [11] Wayne, B., Process Dynamics modeling, analysis, and simulation,
1998